The purpose of this paper is to evaluate the influence of VND/USD exchange rate on Vietnamese coffee export price (PVN).
The study uses cointegration test, Granger causality test and vector autoregression (VAR) model.
The results reveal that there is no co-integrating equation between two variables. It means the exchange rate does not have an effect on PVN in the long run. Furthermore, there is one Granger causality relationship between VND/USD exchange rate and PVN in the short run, but not vice versa. The study suggests that the first previous period of PVN is the most closely related variable which has the greatest impact on the variation of PVN among the selected variables, meanwhile the effect of VND/USD exchange rate on it, contrarily, is positive and very trivial.
In overall, the impact of VND/USD exchange rate on Vietnamese coffee export price (PVN) has been analyzed deeply in this research by applying new approaches.
1. Introduction
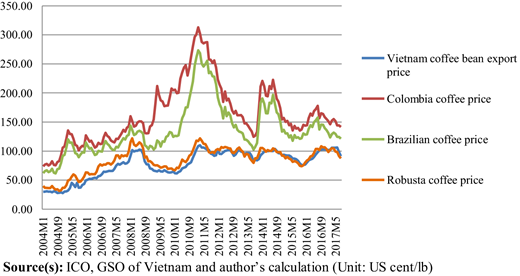
Vietnam is one of the countries exporting a large number of agricultural products, such as maritime products, greengrocery, cashew nut, rice, coffee and so on. According to the report of Gso (2017), Vietnam is the biggest exporter of robusta coffee which is one of two main kinds of coffee in the world with an export value of 3.21 bn USD. During the fourteen-year period 2004–2017, Vietnamese coffee export price was almost parallel with the world's robusta coffee price and more stable than the price of Brazilian coffee price. After a long period of steadily climbing from 40 US cents/lb in 2004 to 111 US cents/lb in 2008, Vietnamese coffee export price had a period of adjustment in the three years from 2008 to early 2011, and the transaction price was adjusted about only 70 US cents/lb. The price peaked at 110.16 US cents/lb in May 2011 before hitting the lowest point of 74.71 US cents/lb in April 2016. Currently, Vietnamese coffee export price is being traded approximately 100 US cents/lb (FOB Ho Chi Minh price). Despite the fact that the fluctuation of Vietnamese coffee export price is more stable than that of Brazilian coffee price, it is very difficult to predict since Vietnamese coffee export price fluctuates without any rules (see Figure 1).
At the same period time, VND/USD exchange rate increased from 15670 VND/USD in January 2004 to 22710 VND/USD in December 2017 and went up by approximately 44.93%. According to Decision No. 2730/QĐ-NHNN of State Bank of Vietnam - SBV (2015) on December 31, 2015, the exchange rate between VND and USD is examined by the central exchange rate mechanism. Based on this decision, the exchange rate will be determined on each day with the fluctuation level of not over ± 3 percent. Significantly, VND/USD exchange rate is controlled by the government; however, with the total export value of more than USD 3 bn each year, only a small change in exchange rate can take a big risk for the coffee farmers and exporting companies. Against this background, a profound understanding of the impact of exchange rate on agricultural commodity export price in general and coffee export price in particular is insignificant to coffee farmers, exporter-producer companies and Vietnamese government, as it helps to better characterize the transmission mechanism of the influence of exchange rate on Vietnamese coffee export price, which are critical inputs to risk management in price volatility.
In the world, there are a large number of studies regarding the relationship between the exchange rate and international trade or export, such as Doğanlar (2002); Buguk et al. (2003); Xie et al. (2008); Rahman and Serletis (2009); Cheung and Sengupta (2013); Thuy and Thuy (2019) and so on. However, the main subjects of these researches are the main agricultural products including corn, soybean, wheat and so on. There are only a small number of researches of Vietnamese scholars on the influence of exchange rate on coffee price in general and Vietnamese coffee price in particular, such as To (2015); Nguyen and Tran (2015) and To (2016). The approaches mainly used in these works are the multiple linear regression model and the cointegration test. According to Granger and Newbold (1974); Hamilton (1994); Ferson et al. (2003) and Mccallum (2010), the biggest lack of multiple linear regression model when estimating time-series data is spurious regression if the variables are not stationary at level.
In light of the background and the limitations of the previous studies, this paper concentrates on the transmission mechanism of the impact of the selected variable to Vietnamese coffee export price, detailed as the equation, level, trend and time of the transmission. Time-series data from January 2004 to December 2017 has been used in order to test the cointegrating relationship, Granger causality and build vector autoregression (VAR) model.
The paper is organized as follows: the literature is reviewed in part 2. Study area and data sources are mentioned in part 3. Research methodologies are outlined in part 4. Interpretation and discussion on empirical results are presented in part 5. Finally, part 6 is a brief summary of this paper.
2. Literature review
There is an enormous amount of the literature researching about the linkages between time series dataset. These papers normally used some models such as multiple linear regression model, VAR model, VEC model, ARCH-family and GARCH-family models to find the relationship among time series variables.
The influence of exchange rate on international trade and export in general and agricultural commodity price in particular has been examined by Doğanlar (2002); Wang and Barrett (2007); Serenis and Tsounis (2012); Devadoss et al. (2014); Asteriou et al. (2016); Senadza and Diaba (2017) and so on. The results of these works, however, are mixed. Some authors such as Doğanlar (2002) and Rahman and Serletis (2009) confirmed that the exchange rate volatility reduces real exports or exchange rate uncertainty has a negative and significant effect. Xie et al. (2008) affirmed the influence of own exchange rate can have negative effect, but the impact of cross exchange-rate are positive or insignificant. Meanwhile, other authors have not found the impact of exchange rate on some export products. It was indicated in the study of Buguk et al. (2003) that the exchange rate and its variability do not have significant impact on Turkish exports of dried figs, grapes and tobacco. Asteriou et al. (2016) showed that, in long term, there is no linkage between exchange rate volatility and international trade activities except for Turkey, and even in this case, the magnitude of the effect of volatility is relatively small. In the short term, however, a significant causal relationship from volatility to import/export demand is detected for Indonesia and Mexico. In the case of Nigeria unidirectional causality from export demand to volatility is found, while for Turkey no causality between volatility and import/export demand is detected.
According to Thuy and Thuy (2019), exchange rate volatility also has a negative effect on the export volume in the long run. A depreciation of the domestic currency affects export negatively in the short run, but positively in the long run, which is consistent with the J curve effect. However, when To (2015) used multiple linear regression model, cointegration test, Granger causality test to identify and measure the impact of some factors such as the world coffee price, exchange rate and gasoline price on the export price of Vietnamese coffee in the period of 2008–2014, the significant result of this study is that exchange rate and gasoline price would put a remarkably positive influence on Vietnamese coffee export price.
Apparently, there is already a large empirical literature on the impact of exchange rate and its volatility on international trade and export. However, these studies have mainly researched the influence of exchange rate volatility on dependent variables as trade flow or export value, but no agricultural commodity export price or coffee export price, and the results are not united. In addition, although there is evidence of the effect of exchange rate on Vietnamese coffee export price, this impact has not been examined deeply since exchange rate is only one of the five selected variables in the research of To (2015).
In an effort to address the limitations about research subject and the lack of multiple regression model in the previous researches, this paper aims to analyze the impact of the selected variable on Vietnamese coffee export price by applying new approaches such as cointegration test, VAR model, Granger causality test. In this paper, based on economics theory, the hypothesis is that there is a negative and significant effect between two selected variables, VND/USD exchange rate and Vietnamese coffee export price. It means that if VND/USD exchange rate increases, Vietnamese coffee export price will go down.
3. Study area and data sources
3.1 Study area
Vietnam is a country of tropical lowlands, hills and densely forested highlands. Within the southern portion of Vietnam is a plateau known as the Central Highlands (Tay Nguyen), approximately 51,800 square kilometers of rugged mountain peaks, extensive forests and rich soil. Because of the great range of latitudes and elevations, the climate in Vietnam is remarkably diverse for a tropical country. Humidity averages 84 percent throughout the year. Annual rainfall ranges from 1,200 to 3,000 millimeters, and annual temperatures vary between 5 degrees C and 37 degrees C. Besides Vietnam's good geographic and climatic conditions for coffee cultivation, the rich and flat basaltic red soil distributing throughout the territory and mainly concentrated at the Central Highlands (about 1 m hectares) with high natural fertility and thick soil layers is also a great advantage to plant coffee tree. Furthermore, according to Gso (2017), the population of Vietnam is about 96 m people, in which the proportion of the labor force is 57% (approximately 55 m labors). Obviously, these are the basic competitive factors to develop coffee plantation and production in Vietnam.
With all of the advantages mentioned above, coffee has become one of the main agricultural export products in Vietnam. According to the statistics reports in 2017, coffee is one of the seven biggest agricultural export commodities with an export turnover of more than USD 3.2 bn or 1.5% of total export turnover. In addition, coffee becomes a major source of income for coffee growers and solves 600 thousand direct jobs and millions of indirect jobs for rural labors every year. Therefore, when Vietnamese coffee export price fluctuates, it affects not only the export turnover of the country but also the lives of million labors directly.
3.2 Data sources
This study uses monthly data for the period from January 2004 to December 2017, including 168 observations for each variable: Vietnamese coffee export price converted from the reports of the Government Statistics Office of Vietnam (GSO of Vietnam) and VND/USD exchange rate from the International Monetary Fund (IMF). Vietnamese coffee export price is adjusted the seasonality, all data then are converted into the log-log equation and the statistics of variables are described in Table 1.
4. Research methodology
4.1 Co-integration test
In the 1980s, Engle and Granger (1987) proposed the concept of cointegration. If the time series (t = 1,2,…) becomes a stationary time series after d differences, and the sequence difference is d − 1 times, then the sequence Xt is called a d-ordered single integer sequence, denoted as Xt ∼ I(d). If the two time series Xt and Yt, which are both I(d). In general, any linear combination of Xt an Yt will be also I(d). If, however, there exists a vector, such that the combination st = aXt + bYt is I(d − b) (d ≥ b ≥ 0), then Xt and Yt are called (d − b) order cointegrated. For those time series variables that are non-stationary, if some of their linear combinations are stationary, the linear combination reflects the long-term equilibrium relationship between the variables, which is the cointegration relationship.
Testing cointegration is a significant step to check either existing empirically meaningful relationships in the model or not. If variables have different trend processes, they cannot stay in a fixed long-run relationship, implying that you cannot model the long-run, and there is usually no valid base for inference based on standard distributions. If cointegration is not found, it is necessary to continue working with variables in differences instead. The cointegration relationship among variables can be tested by using Johansen and Juselius (1990) method and Engle and Granger (1987) two-step cointegration method.
4.2 Granger causality test
The Granger (1969) causality test assumes that all information about the predictions of y and x is contained in the time series of these variables. The inspection requires the estimation as the following regressions:
where: xt, yt, represent two variables; yt−j, xt-i denote the lag of yt, xt respectively; αi, βj, λi, δj denote the coefficient estimation of the lag term; i, j, q, s denote lag order; u1t and u2t are white noise and assumed to be irrelevant.
Eqn (1) assumes that current y is related to y itself and the past value of x, and Eqn (2) assumes similar behavior for x. For (1), the null hypothesis H0: α1 = α2 = … = αq = 0; for (2), the null hypothesis H0 = δ1 = δ2 = … = δs = 0. Values of F-statistic and P-probability will be used to make the decision to accept (if P – probability value is greater than 5 percent) or reject (if P-probability value is less than 5 percent) the null hypothesis.
4.3 VAR model and VEC model
According to Sims (1980), VAR model was introduced as a technique that could be used by macroeconomists to characterize the joint dynamic behavior of a collection of variables without requiring strong restrictions to identify underlying structural parameters. It has become a prevalent method of time-series modeling.
The expression of VAR model can be expressed as:
Among them, zt is k-dimensional vector of the endogenous variable vector (k = 1,…,K), t is the number of samples, p is the order of the lagged variable, and vt is the d-dimensional exogenous variable vector. The (K × k) - dimensional matrix A1,…, Ap and (K × d) - dimensional matrix B are the coefficient matrices to be used for estimation. εt is a vector of k-dimensional disturbances. For the VAR model, in order to fully reflect the dynamic characteristics of the model, generally, p and R-squared must be large enough. But it is uncertain that the bigger p is, the better the model's freedom is. Thus, an equilibrium must be established between p and R-squared, this equilibrium can be determined by the AIC and SC principles.
When the variables of a VAR are co-integrated at the same order, we use a vector error- correction (VEC) model. A VEC model for two variables is as below:
The Eviews 8.0 software will be used to estimate and test all the hypotheses of the above testing and model.
5. Empirical results and discussion
5.1 Unit root test
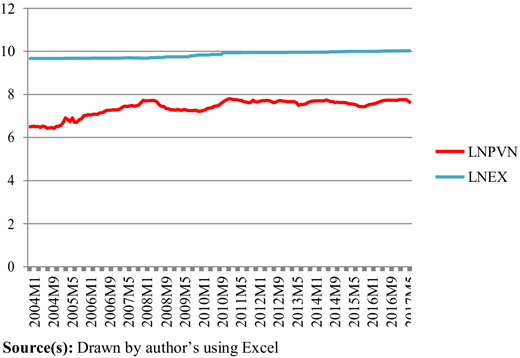
In order to examine the effect of exchange rate on Vietnamese coffee export price, authors go to test the stationary of all variables. Before the stationary test is carried out, it is necessary to make sure all of the variable volatility is a trend and/or an intercept or not. Figure 2 presents that the stationary test of variables will be conducted with intercept and upward trend.
The results of preliminary checking reveal that all of the series is considered to be stationary. To be more conservative, according to Schwert (2002) Pmax = 13, thirteen lagged differences are used to test the stationarity of variables. The stationarity is tested by using the augmented Dickey–Fuller (ADF) and Phillips-Perron (PP) tests. Table 2 describes the ADF test results and the PP test results at level and at first difference. In both tests, the null hypothesis is unit root for each variable.
From the results of Unit root test, these variables are not stationary at the level, in other words, these series contain a unit root. The non-stationary series were tested again by taking the first difference. After the test, five logarithms of variables are stationary at first difference with 1% level. It means that all of the variables are integrated at the same order. Hence we can run cointegration test for all of the variables.
5.2 Determination of lags
According to Ng and Perron (2001), the authors use the lowest of six criteria as a primary concern. LR (likelihood ratio), FPE (final prediction error), AIC (Akaike information criterion), SC (Schwarz information criterion), HQ (Hannan–Quinn information criterion) are used to determine the lag length (see Table 3).
Based on the result of these methods (which is indicated by –*|| in the output), we proceed further test with lags (1)
5.3 Cointegration test
Cointegration rank is estimated by using Johansen methodology. Johansen's approach derives two likelihood estimators for the cointegration rank: a Trace test and a Maximum Eigen's value test.
The results of the cointegration test shown in Table 4 display that there is no cointegrating equation at the 0.05 level between variables. It means that there is no long-term relationship between two variables from 2004 to 2017. From this result, the paper cannot estimate VEC model change for the VAR model either.
5.4 Vector autoregressive model (VAR model)
Because there is no cointegration between variables, they have no relationship in the long-run. Thus, the VAR model can be applied to analyze the relationship between two variables in the short-run. The VAR model shows the relationship between variables in the period from January 2004 to December 2017 with the equation as displayed in Table 5.
The results of Table 5 can be written as below:
Since the purpose of this paper is to determine the impact of exchange rate on Vietnamese coffee export price, the study only analyzes the influence of variables on this variable. It is clearly presented in Table 5 that the influence of the Vietnamese coffee export price in the previous period on itself is the maximum. If LNPVN_1 increases by 1 percent, it will make LNPVN grow by 0.973973 percent. This is followed by the impact of VND/USD exchange rate with the influence coefficient of 0.014374. It means, when VND/USD exchange rate in the previous period goes up by 1 percent, it leads to a trivial rise of Vietnamese coffee export price (0.014374 percent). In terms of the direction of action, all of the independent variables have a positive effect on Vietnamese coffee export price. Hence, the hypothesis of this study is rejected.
According to the deeply analyzed results of this study, the impact of independent variables explains 98.4528 percent of the fluctuation of the dependent variable. It is relatively consistent with the reality of Vietnam coffee export price volatility in terms of the level of the impact of variables. In other words, Vietnam coffee export price is primarily influenced by itself in the previous period. Furthermore, the previous period of VND/USD exchange rate has a very tiny effect on the dependent variable with the influence coefficient of 0.014374. However, the VND/USD exchange rate is absolutely not influenced by Vietnamese coffee export price. It is only affected by the lag (1) of itself. Consequently, the relationship between the two variables is asymmetric and unidirectional. Details are as in Table 6.
5.5 Granger causality test
Although the cointegration test among variables does not specify the direction of a causal relation, economic theory guarantees that there is always Granger causality in at least one direction. A Granger causality test with a lag (1) is conducted to verify the causal relationship between two variables. Estimation results for Granger causality between two variables are presented in Table 7. The authors use F-statistics and probability to test the causality among the variables, with the null hypothesis of no Granger cause among those variables.
In this study, based on F-statistic and probability value, the null hypothesis will be rejected if the probability value is less than 0.05 and vice versa. Then, LNPEX has a unidirectional –Granger cause‖ with LNPVN at the 5 percent significance level, but not vice versa. The relationship found between VND/USD exchange rate and Vietnamese coffee export price is appropriate to the reality as well as the study result of To (2015).
5.6 Impulse response function (IRF) and variance decomposition analysis
In the final step of the empirical modeling analysis, authors define the response of variables to LNPVN when there is a shock in exchange rate and itself. In this regard, the generalized impulse-response functions are derived from VAR model for two variables. The optimal lag lengths in VAR system are determined via the Schwartz information criterion - lag (1).
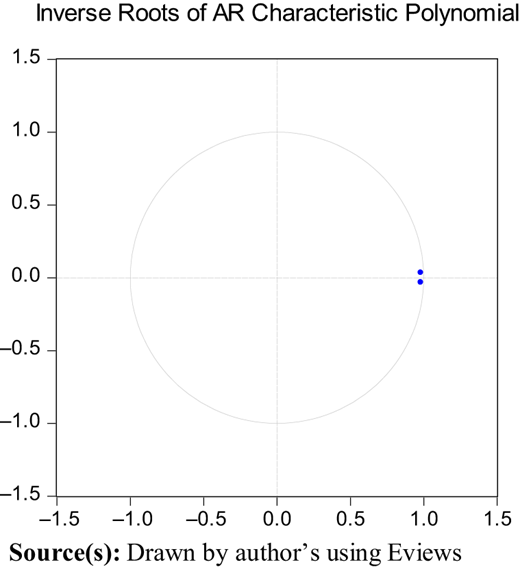
Figure 3 shows that all roots of VAR model are within the unit circle. Hence VAR system satisfies the stability condition.
5.6.1 Impulse response function (IRF)
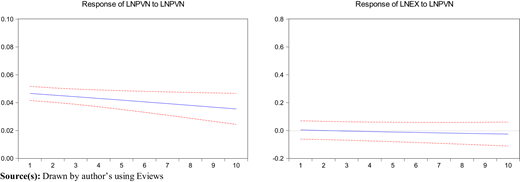
In practical application, VAR model generally does not analyze how the change of one variable affects another variable. It examines the dynamic structural analysis of variables as well as the dynamic influence of one error term of the model or the overall impact of receiving some kinds of shock. In addition, the economic interpretation of the single parameter estimation is relatively difficult, when the impulse response analysis is generally required. This article selects the most commonly used analysis of Cholesky orthogonal impulse response, which is shown in Figure 4.
This part only analyzes the response of exchange rate to Vietnamese coffee export price. Figure 4 illustrates that when getting a shock, Vietnamese coffee export price gives the strongest response to itself (the maximum value is 4.7 percent in period 1) and dies out. Meanwhile, the response of VND/USD exchange rate to a shock in Vietnamese coffee export price decreases slowly.
After determining the response of variable in case a shock appears, this study goes to the next step to examine the volatility variance of Vietnamese coffee export price.
5.6.2 Variance decomposition analysis
From Table 8, in period 1, 100 percent of the fluctuation variance of LNPVN comes from the fluctuation of itself. There is a slight decline from 99.1283 percent in period 2 to 67.05511 percent in period 10. The effect of VND/USD exchange rate on the variance decomposition of the fluctuation of Vietnamese coffee export price is not in the same, it increases from zero in period 1 to 32.94489 percent in period 10.
6. Conclusion
For agricultural commodities exporting countries, the impact of exchange rate on export as well as agricultural commodities export price is always an issue which needs the careful calculation and study. In Vietnam, for instance, the influence of exchange rate on coffee export price directly affects not only the export turnover of Vietnam but also a large number of farmers' income as well.
Using time-series data from January 2004 to December 2017, this paper investigated the impact of VND/USD exchange rate on Vietnamese coffee export price. The results of Cointegration test demonstrated that two variables are not co-integrated with each other at the 99 percent confidence level, but Granger causality test confirmed that Vietnamese coffee export price is influenced by VND/USD exchange rate, but not vice versa. The results from this study also approved the positive relationship between two variables in the short-run, which is not as same as the hypothesis of this study and economic theory. Significantly, this literature affirmed that Vietnamese coffee export price is mainly affected by the first period of itself, while the influence of exchange rate on it is very small.
In summary, the new findings of this article contribute to further improving the studies using of time-series data practically and theoretically. About theoretical values, this study applied Cointegration test, Granger causality test and VAR model to provide further evidence confirming the existence of the relationship between exchange rate and agricultural export price. About practical values, the results of this study can help the Government of Vietnam, coffee enterprises and coffee farmers clearly understand the transmission mechanism of the impact of exchange rate on Vietnamese coffee export price to have appropriate strategies.
However, there are still some limitations in this paper. The restriction can be a hint for future research. In that respect, future studies can extend the literature at least in two ways so as to provide some new insights: Firstly, the number of independent variables or the length of time in collecting data could be extended. Secondly, researchers can extend the number of independent variables and use another model to examine, such as Structure vector autoregressive model, Panel vector autoregressive model or Markov switching vector autoregressive with the same data.