

This study examines how institutions in both home and host countries affect firms’ cross-border mergers and acquisitions (CBM&As) activity in the six most significant Latin American (LATAM) economies (1995–2018).
Data from 1,094 transactions by LATAM companies were used to develop two data panels to examine the impact of institutions on CBM&A activity. Additionally, the influence of the target industry on CBM&A activity is explored. And to operationalize the independent variables, concepts from economic institutionalism are applied.
The research findings indicate that the primary motive of acquirers for investing abroad is not to find better formal institutional conditions, but rather to pursue new markets. In contrast, the home country’s formal institutions motivate LATAM firms to invest overseas. Contrary to previously published studies, there is evidence of an inverted U-shaped relationship between institutional informal distance and CBM&A activity conducted by LATAM firms.
This study analyzes the impact of the formal institutional quality of home and host countries as well as formal and informal institutional distances, on the accumulated value of CBM&As from LATAM. These relationships are underexplored in the literature. This study uses a large and representative sample of complete CBM&As in the region.
1. Introduction
CBM&As are among the most widely used strategies for the international growth of emerging market multinational enterprises (EMNEs) (Pinto et al., 2017). Dunning and Lundan (2008) classified the motivations for implementing these international expansion processes into four categories: market-seeking, natural resource-seeking, strategic asset-seeking and efficiency-seeking. EMNEs use CBM&As to obtain resources faster than through organic growth and development (Buckley, 2018). CBM&A activity increased in Latin America after the trade liberalization reforms of the 1980 and 1990s (Contractor, 2013; Meyer and Grosse, 2019). In 2022, there were 1,952 M&A deals in South and Central America and the Caribbean, totaling USD 94.4 bn, with Brazil accounting for 1,206 transactions (EMIS, 2025).
LATAM is characterized by weak institutions (Fainshmidt et al., 2018), economic volatility (Hermans and Borda Reyes, 2020) and political and social instability (Aguilera et al., 2017). With the rise of EMNEs as leaders in global value chains, academic interest has focused on understanding the development of regions, countries and companies shaped by these conditions (Cuervo-Cazurra, 2008; Ramamurti, 2012). Scholars have highlighted the impact of a company’s country of origin on EMNE behavior (Cuervo-Cazurra and Genc, 2008), internationalization patterns (Cuervo-Cazurra et al., 2018), resource bases (Enderwick and Buckley, 2021) and CBM&A activities (Deng and Yang, 2015; Krug and Falaster, 2022).
Studies on CBM&A activity by LATAM firms are scarce. Literature reviews on outward foreign direct investment (OFDI) from emerging markets (EM) (Paul and Benito, 2018) and the determinants of CBM&As show a focus on Asian countries, particularly China (Xie et al., 2017). LATAM FDI literature includes studies on inward investments (Treviño and Mixon, 2004; Trevino et al., 2005; Vasco et al., 2014), macroeconomic factors determining investment (Cortés et al., 2017a, b, 2018), case studies (Fleury and Leme Fleury, 2014; Kumar, 2018) and the impact of specific investments on stock prices (Goddard et al., 2012; Lozada et al., 2022; Pablo, 2013). Few explore the impact of institutional quality on foreign investment, such as ownership mode (Krug and Falaster, 2022). Other studies used different predictors of CBM&A activity, including common language (Cortés et al., 2017a) and various aspects of governance (Cortés et al., 2017b; Vasco et al., 2014).
This study draws on the institutional perspective of international business (Peng et al., 2009). Institutions, defined as societal “rules of the game” (North, 1990), are classified as formal (laws and regulations) or informal (norms and culture). A country’s institutional development influences the resources available to firms (Cherchye and Verriest, 2016; Enderwick and Buckley, 2021) and shapes strategies such as entry mode (Dikova and Witteloostuijn, 2007) and ownership mode (Brouthers, 2002; Chen and Hennart, 2004). Applying the institutional perspective to LATAM EMNEs, this study proposes the following research questions: (1) how does the quality of formal institutions in home and host countries influence the CBM&A activity of LATAM firms? (2) How do formal and informal institutional distances affect the CBM&A activity of LATAM firms?
This study makes four contributions. First, it focuses on LATAM countries to isolate the impact of local institutions on CBM&As from this region (Aguinis et al., 2020), which has been the subject of only a few studies (Cortés et al., 2017b). Second, building on Deng and Yang’s (2015) application of resource dependence theory, the study argues that home country institutions play a significant role in CBM&A decisions of local firms. The model presented in this study incorporates both formal institutions of home and host countries as well as formal and informal institutional distances. Third, the quality of data is more robust than in previous studies, since the sample includes completed transactions rather than merely announcements and considers the cumulative value of transactions per year. Fourth, the study uses a gravity model that allows for the simultaneous assessment of characteristics of the home and host countries in a single estimate.
The study is structured as follows: First, the theoretical framing of this paper is presented. Second, the theory and the study hypotheses are formulated. Third, the method, sample and operationalization of variables are described. Fourth, the statistical analysis is conducted. Lastly, the study results are reported, their managerial implications are outlined and avenues for future research are suggested.
2. Literature review
In international business, institutional theory integrates economic and behavioral constructs (Nielsen et al., 2017; Silva-Rêgo and Figueira, 2019). North (1990) describes institutions as shaping “the rules of the game in society,” defining them as “humanly devised constraints that structure human interaction” (1991, p. 97) and categorizing them as either formal (FI) or informal (II).
FI, such as laws, constitutions, rules, property rights and regulations dictates economic activity. These institutions intervene in transactions between companies and different actors, whether as government bureaucracy, the judicial system or contract law (Abdi and Aulakh, 2012). When these rules are incomplete or loose, firms must establish specific contractual conditions to outline their responsibilities (Williamson, 1998). In cases of commitment breaches, firms rely on the judicial system to address legal issues (Williamson, 1985b). Therefore, the quality of a country’s FIs can impact transaction costs and firm strategies (Seyoum, 2009). High-quality institutions generally lead to moderate transaction costs, which attract foreign capital (Meyer and Peng, 2005).
II includes customs, traditions, codes of conduct and taboos, which reduce uncertainty and transaction costs in economic life (North, 1990; Williamson, 1985a). Mondolo (2019) identified three types of II: trust, social networks and corruption. Trust involves cooperation and understanding between contracting parties, addressing opportunism and moral risk (Zou et al., 2023). Social networks are connections within and between organizations that foster cooperation and build trust (Inkpen and Tsang, 2005; Putnam et al., 1993). Corruption, defined by Kaufmann et al. (2010) as using public power for private gain, can also facilitate regional development by navigating low-quality formal institutions and securing political privileges in host countries (Zimmerman and Zeitz, 2002).
2.1 Quality of host country FI
The institutional conditions of the host country significantly influence internationalization processes by either providing advantages (Cherchye and Verriest, 2016) or presenting obstacles (Zaheer, 1995). Strong institutions can reduce uncertainty and risk for investors, making the host country more attractive for long-term investments (Krug and Falaster, 2022; Dikova and Witteloostuijn, 2007). The likelihood of an acquisition also hinges on the quality of the financial markets, which is loosely tied to the overall institutional quality (Lebedev et al., 2015).
Multi-country M&A studies using La Porta et al.'s (1998) FI data revealed key findings. Rossi and Volpin (2004) found that investor protection institutions increase M&A activity. Choi et al. (2016) showed that quality institutions attract investors. Using ICRG data, Hyun and Kim (2010) uncovered a positive relationship between institutional quality and CBM&A activity. Slesman et al. (2015) corroborated these findings using EFW and ICRG data. Pandey et al. (2023), employing EFI data, found that host country economic freedom positively impacts shareholder wealth gains. In line with the empirical results found in the literature, this study expects LATAM businesspeople to prioritize legal certainty and stable conditions when making foreign investment decisions. Thus:
The quality of the host country’s FI is positively related to the value of CBM&As conducted by LATAM firms.
2.2 Quality of home country FI
Home country institutions may influence EMNE’s investments abroad in opposing ways: institutional fostering and institutional escapism (Sengupta et al., 2023). In this study, these two influences will be addressed separately. Institutional fostering occurs when strong FI in the firm’s home country supports the internationalization process by facilitating resources and public policies, such as low interest rates and inflation levels, in the home country (Boateng et al., 2017). Moreover, government initiatives in the home country may promote commercial mobility (Yan et al., 2020), while financial and training aid (Falahat et al., 2020) and collaboration networks with the government of the home country (Takyi et al., 2022) may further bolster this support.
Empirical evidence links home country institutional quality to increased CBM&A activity. Studying 30 indicators across 48 EM (2007–2017), Buitrago and Barbosa Camargo (2020) found that quality home institutions positively influence OFDI. Reddy et al. (2022), analyzing 4,130 acquisitions from 48 EM (2006–2018), showed that home institutional quality promotes higher equity stakes. Therefore, it can be expected that
The quality of the home country’s FI is positively related to the value of CBM&As conducted by LATAM firms.
In contrast, the institutional escapism paradigm ascribes the internationalization of EMNEs to a desire to break away from a weak institutional context (Barnard and Luiz, 2018), particularly inadequate intellectual property protection and law enforcement (Stal and Cuervo-Cazurra, 2011). Moreover, domestic governments may offer incentives to attract foreign investment, disadvantaging local industries and encouraging outward investment (Abreo et al., 2022; Kat, 2023). These factors often drive indigenous firms to explore cross-border expansion (Boisot and Meyer, 2008; Child and Rodrigues, 2015; Stal and Cuervo-Cazurra, 2011).
Some empirical studies have shown a negative relationship between a home country’s institutional quality and CBM&A activity. For example, Stoian and Mohr (2016) encountered a negative relationship between OFDI and the institutional quality of the home country (bureaucracy, corruption and protectionism) in their analysis of a multi-country sample of 29 EM (1995–2011). Therefore, a variation of the previous hypothesis has been formulated, suggesting an inverse trend.
The quality of the home country’s FI is negatively related to the value of CBM&As conducted by LATAM firms.
The two opposing hypotheses will be tested although it can be intuitively suggested that the FI of the home countries in the study sample encourages investment abroad. There are two reasons for this conjecture: First, this study does not include those LATAM countries that suffer from the lowest-quality FI, such as Venezuela or Bolivia, and second, there are neither FDI policies for national companies nor internationalization programs as in other countries in the region, such as Argentina, Chile or Brazil (Alcaraz and Zamilpa, 2017).
2.3 Institutional distance
In international business, institutional distance refers to the existing contextual differences between two social entities (Beugelsdijk et al., 2018a, b). Kostova (1996) further expanded upon this notion, defining institutional distance as the variation in institutional frameworks between two countries.
2.3.1 Formal institutional distance (FID)
This study defines the FID between two countries as the difference between regulations and norms governing the market and the laws and rules affecting a firm’s strategy. By applying the equivalences presented by Peng et al. (2009), FID is equated with regulatory distance.
Several empirical studies have explored the relationship between FID and OFDI. Dikova et al. (2010) analyzed 2,389 service industry CBM&As (1981–2001), finding that greater FID led to fewer closed deals and longer processes. In a separate study, Ermolaeva (2019) examined 446 Russian CBM&As (2000–2014), revealing a negative correlation between property rights protection and completed deals. Soleimani and Yang (2022) studied 8,175 CBM&As across 47 home countries and 56 host countries (2003–2009), showing that higher FID hindered market adaptation. Kukreja et al. (2023) found similar financial adaptation challenges in the CBM&As of the BRICS countries compared to 27 host countries. Depperu et al. (2022) analyzed 496 Italian CBM&As in 41 countries (2008–2018), demonstrating increased difficulty accessing financial networks with greater FID. Therefore, a reduction in CBM&A activity is expected when there is considerable FID between the home and host countries. Thus:
The FID between the home and host countries is negatively related to the value of CBM&As conducted by LATAM firms.
2.3.2 Informal institutional distance (IID)
IID is defined as inter-country differences in norms, beliefs, values and language that can affect knowledge transfer or business practices, impacting a company’s foreign effectiveness. Coordination mechanisms within a company depend on II, whether they are referred to as organizational norms, organizational culture, language or administrative practices (Martinez and Jarillo, 1989). When operating in foreign markets, companies face heightened transactional costs due to differences in coordination mechanisms between economic actors being compared to those in the home country (Eden and Miller, 2004; North, 1990). The greater the distance between countries, the greater the challenges for companies (Meyer and Peng, 2005).
The literature presents contradictory empirical results regarding the relationship between IID and FDI or M&As (Xie et al., 2017). On the one hand, a positive relationship is evident. For instance, Chakrabarti et al. (2009), analyzing a sample of 800 CBM&As with 43 home countries and 65 host countries (1991–2004), found a positive long-term impact of cultural distance on CBM&As [1]. On the other hand, in multi-country studies, Bertrand et al. (2007) and Malhotra et al. (2011) found a negative effect of cultural distance on CBM&As. In a sample of 104,652 M&As (1985–2008), Ahern et al. (2015) found a negative relationship between cultural distance and the number of M&As per host country. Both Bailey and Li (2015) and Liou et al. (2016) also found a negative effect on the relationship between OFDI and cultural distance. Similarly, Kukreja et al. (2023) and Depperu et al. (2022) found a negative relationship between CBM&As and cultural distance. Considering that most results show a negative relationship, a similar effect between the IID and the CBM&A activity of LATAM companies can be expected. Therefore:
The IID between the home and host countries is negatively related to the value of CBM&As conducted by LATAM firms.
3. Method
3.1 Research design/model
To test the study hypotheses, a dataset of 1,139 completed CBM&As by companies from the six largest LATAM economies (Argentina, Brazil, Chile, Colombia, Mexico and Peru) was compiled and sourced from the Thomson ONE Banker database, a commonly used academic resource (Cortés et al., 2017a; Fan et al., 2008; Gugler et al., 2012). Only completed cross-border transactions for which financial data were available were used. Compared to a hypothetical, all-encompassing sample with comprehensive information, reference can be made to the study by Cortés et al. (2017a, b), who note that Thomson ONE has transactional value information for 54% of all transactions. They also mention that 2,391 announcements they found corresponded to 90% of the combined number of domestic and CBM&As in LATAM. For the purposes of this paper, only CBM&As and completed transactions were used, which can be considered a representative sample of cross-border activity in LATAM.
Transactions with the same home country, host country and year were aggregated into two panels: Panel A does not include any industry variables and consists of 659 rows, while Panel B does account for industry effects, resulting in 858 rows.
To estimate the factors of the two countries involved in the transaction simultaneously, a gravity model was used. Gravity models are commonly used to analyze trade flows, migration and transactions. These models are founded on the assumption that the flow between two entities (for example, cities, countries, states and so on) is related to their features (for example, GDP, population, among others) and the distance between them (for example, geographic distance). The standard functional form of a gravity model is logarithmic; therefore, the following equation was used for Panel A:
For Panel B, the equation is:
3.2 Data and variables
In Panel A, is the accumulated value of the transactions from country to country in year represents the quality of the FI in the home country, operationalized as the value of the Heritage Foundation’s EFI for country (Beugelsdijk et al., 2018a, b; Kostova et al., 2020), in year . is the corresponding value of EFI for the home country , in year . is the value of the Formal Institutional Distance Index calculated for the dyad of countries and , in year The index was calculated from four out of the six available dimensions from the World Bank’s WGI data. Notably, all six variables exhibit a high correlation (cf. Buitrago and Barbosa Camargo, 2020). The following dimensions were selected: (1) government effectiveness, (2) regulatory quality, (3) rule of law and (4) control of corruption. Variables such as voice, accountability, political stability and the absence of violence were omitted, as they are encompassed within the concept of government effectiveness.
is the Euclidean index for II (Gaur and Lu, 2007; Konara and Mohr, 2019), calculated between the home and host countries using the four cultural dimensions extracted from the most recent dataset of Hofstede’s multi-cultural study (Hofstede, 1980). is the natural logarithm of the geographical distance from the capital of the country to the capital of the country , measured in kilometers (Mayer and Zignago, 2011). This measure has been extensively used in international business and economic geography literature (for example, Buckley et al., 2016; Cortés et al., 2017a; Danakol et al., 2017; Di Guardo et al., 2016). is the gross domestic product (US dollars, constant 2015 prices) for country in year , while is the gross domestic product (US dollars, constant 2015 prices) for country in year . is the difference between the home and host countries’ GDPs per capita , serving as a proxy of the differences of both countries population’s wealth (Beugelsdijk et al., 2009). The sign of the variable indicates the direction of the flows, whether it is toward countries with greater or lesser wealth than the home country. is a dummy variable for the target country group . It comprises a four-group dummy built to capture the directionality of the transaction (Latin_America, United_States_and_Canada, Spain_and_Portugal and Rest_of_the_World). This variable is included to account for possible within-region effects and historical ties between colonizers and colonies (cf. Ghemawat, 2001).
In Panel B, the independent variables, as do the control variables, remain unchanged except for one. is a dummy variable for the target firm’s industry group used only in Panel B estimations. The industries are classified into six groups: extraction, construction, manufacturing, transportation, commerce and others.
3.3 Analytical procedures
For FID and IID, the Euclidean distance was used, as recommended in the literature (Beugelsdijk et al., 2018; Konara and Mohr, 2019):
Where is the score of the dimension for the home country, is the score of the dimension for the host country, is the variance of the dimension and is the number of dimensions included in the index (.
The generalized least squares estimator was used to minimize heteroskedasticity issues and ensure a robust estimation (Greene, 2018). This estimator has been widely employed in international economics and international business (Canh et al., 2021; Solano et al., 2020).
4. Results
4.1 Descriptive statistics
Figure 1 depicts the accumulated transaction value by years. Four local maximum values are identified: USD20.61bn (2006), USD27.14bn (2007), USD19.32bn (2012) and USD15.21bn (2013). Post-2007, values decreased for 2003 and 2005. Significant growth occurred between 2008 and 2012, reaching 2006 levels. The 2014–2018 period showed a stable trend at around USD10bn. The total accumulated transaction value is USD204.014bn.
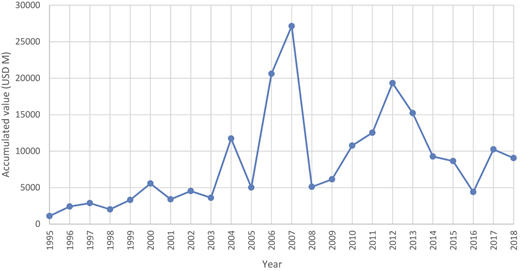
Accumulated value of CBM&As per year. Note: Accumulated value in USD millions. Source: Authors’ own calculations derived from sample data
Accumulated value of CBM&As per year. Note: Accumulated value in USD millions. Source: Authors’ own calculations derived from sample data
Table 1 presents information on the number of transactions by country, value, average ownership percentage as well as maximum and minimum values over the initial sample. Brazil and Mexico have the largest number of transactions, followed by Chile. In terms of accumulated value by country, Brazil is first, followed by Mexico and Colombia. This first inspection shows the heterogeneity that exists in Latin America in terms of the average value of CBM&As.
Sample data per country
| Country | No. of CBMAs | Accum. value | Avg. value | Avg. % of ownership |
|---|---|---|---|---|
| ARGENTINA | 136 | 15.71 | 0.12 | 73.52 |
| BRAZIL | 275 | 83.88 | 0.31 | 76.39 |
| CHILE | 207 | 27.28 | 0.13 | 72.48 |
| COLOMBIA | 142 | 31.50 | 0.22 | 81.09 |
| MEXICO | 302 | 80.09 | 0.27 | 79.74 |
| PERU | 77 | 4.38 | 0.06 | 76.23 |
| Total | 1,139 | 242.84 | 0.21 | 76.79 |
Note(s): The first column represents the number of transactions. Accum. value denotes the accumulated value (USD billions), Avg. value indicates the average value (USD billions) and Avg. % of ownership refers to the average percentage of ownership
Source(s): Authors’ own calculations
Table 2 presents the statistical summaries for Panels A and B. In Tables 3 and 4, the highest correlation scores are −0.6327 (Panel A) and −0.6463 (Panel B), respectively, indicating no multicollinearity issues.
Statistical summary of Panels A and B
| Variable | Panel A | Panel B | ||||||||
|---|---|---|---|---|---|---|---|---|---|---|
| Obs. | Mean | Std. dev. | Min | Max | Obs. | Mean | Std. dev. | Min | Max | |
| lnVMA | 659 | 4.158 | 2.208 | −5.259 | 9.750 | 858 | 3.801 | 2.282 | −6.908 | 9.750 |
| FIQit | 659 | 64.238 | 8.247 | 43.8 | 79 | 858 | 64.483 | 8.234 | 43.8 | 79 |
| FIQjt | 658 | 66.419 | 9.208 | 37.1 | 88.6 | 857 | 66.808 | 9.297 | 37.1 | 88.6 |
| FIDIijt | 659 | 2.304 | 1.434 | 0.154 | 5.471 | 858 | 2.407 | 1.439 | 0.156 | 5.546 |
| IIDIijt | 659 | 2.384 | 1.190 | 0.432 | 8.279 | 858 | 2.383 | 1.007 | 0.436 | 5.989 |
| lnGDistij | 659 | 8.278 | 0.854 | 5.371 | 9.868 | 858 | 8.231 | 0.817 | 5.371 | 9.868 |
| lnGDPit | 659 | 13.124 | 0.911 | 11.167 | 14.357 | 858 | 13.140 | 0.903 | 11.167 | 14.357 |
| lnGDPjt | 659 | 13.043 | 1.737 | 8.725 | 16.708 | 858 | 13.262 | 1.796 | 8.725 | 16.708 |
| DiffGDPpcijt | 659 | −0.389 | 0.930 | −2.627 | 2.366 | 858 | −0.430 | 0.912 | −2.627 | 2.366 |
| US and Canada | 659 | 0.150 | 0.358 | 0 | 1 | 858 | 0.188 | 0.391 | 0 | 1 |
| Spain and Portugal | 659 | 0.065 | 0.247 | 0 | 1 | 858 | 0.069 | 0.253 | 0 | 1 |
| Rest of the world | 659 | 0.161 | 0.368 | 0 | 1 | 858 | 0.124 | 0.329 | 0 | 1 |
| Extraction | 858 | 0.125 | 0.331 | 0 | 1 | |||||
| Construction | 858 | 0.019 | 0.135 | 0 | 1 | |||||
| Manufacturing | 858 | 0.369 | 0.483 | 0 | 1 | |||||
| Transportation | 858 | 0.150 | 0.358 | 0 | 1 | |||||
| Commerce | 858 | 0.096 | 0.294 | 0 | 1 | |||||
Source(s): Authors’ own calculations
Pairwise correlations for Panel A
| 1 | 2 | 3 | 4 | 5 | 6 | 7 | 8 | 9 | 10 | 11 | 12 | ||
|---|---|---|---|---|---|---|---|---|---|---|---|---|---|
| 1 | lnVMA | 1 | |||||||||||
| 2 | FIQit | −0.0568 | 1 | 1 | |||||||||
| 3 | FIQjt | 0.0924* | −0.1361* | 0.4188* | 1 | ||||||||
| 4 | FIDIijt | 0.0182 | 0.0587 | 0.3210* | 0.3303* | ||||||||
| 5 | IIDIijt | 0.034 | 0.062 | 0.1984* | 0.2046* | 1 | |||||||
| 6 | lnGDistij | 0.0191 | −0.1113* | 0.1475* | −0.027 | 0.2526* | 1 | ||||||
| 7 | lnGDPit | 0.1696* | −0.6327* | 0.2446* | 0.3236* | 0.0634 | 0.2868* | 1 | |||||
| 8 | lnGDPjt | 0.1367* | −0.0359 | −0.5740* | −0.5092* | 0.2464* | 0.4588* | 0.1234* | 1 | ||||
| 9 | DiffGDPpcijt | −0.0573 | 0.1441* | 0.5171* | 0.3877* | −0.3451* | −0.3427* | −0.0839* | −0.5630* | 1 | |||
| 10 | US and Canada | 0.1169* | −0.0105 | −0.0094 | 0.0575 | 0.3975* | 0.1462* | 0.0744 | 0.6332* | −0.5694* | 1 | ||
| 11 | Spain and Portugal | 0.0197 | −0.0713 | 0.0889* | 0.1860* | −0.1363* | 0.2442* | 0.1030* | 0.0831* | −0.1913* | −0.1111* | 1 | |
| 12 | Rest of the world | −0.0894* | −0.1193* | 0.0889* | 0.1860* | 0.2913* | 0.5415* | 0.1829* | 0.1083* | −0.2584* | −0.1841* | −0.1157* | 1 |
Note(s): *p < 0.05
Source(s): Authors’ own calculations
Pairwise correlations for Panel B
| 1 | 2 | 3 | 4 | 5 | 6 | 7 | 8 | 9 | 10 | 11 | 12 | 13 | 14 | 15 | 16 | 17 | |
|---|---|---|---|---|---|---|---|---|---|---|---|---|---|---|---|---|---|
| lnVMA | 1 | ||||||||||||||||
| FIQit | −0.0235 | 1 | |||||||||||||||
| FIQjt | 0.0776* | −0.1450* | 1 | ||||||||||||||
| FIDIijt | −0.0075 | 0.1021* | 0.4240* | 1 | |||||||||||||
| IIDIijt | 0.0366 | 0.0717* | 0.4993* | 0.4898* | 1 | ||||||||||||
| lnGDistij | 0.0831* | −0.1179* | 0.1689* | 0.1416* | 0.2627* | 1 | |||||||||||
| lnGDPit | 0.1314* | −0.6463* | 0.1723* | −0.0335 | 0.0858* | 0.2958* | 1 | ||||||||||
| lnGDPjt | 0.1004* | −0.0624 | 0.3027* | 0.3680* | 0.4591* | 0.4126* | 0.1931* | 1 | |||||||||
| DiffGDPpcijt | −0.0504 | 0.1810* | −0.5907* | −0.5022* | −0.5668* | −0.3466* | −0.1615* | −0.6093* | 1 | ||||||||
| US and Canada | 0.0716* | −0.0568 | 0.5682* | 0.4333* | 0.5793* | 0.1367* | 0.1545* | 0.7075* | −0.6347* | 1 | |||||||
| Spain and Portugal | 0.0187 | −0.0528 | −0.0224 | 0.0416 | −0.1115* | 0.2799* | 0.1267* | 0.0463 | −0.1866* | −0.1306* | 1 | ||||||
| Rest of the world | −0.0273 | −0.1229* | 0.0872* | 0.1613* | 0.2604* | 0.5034* | 0.1586* | 0.0581 | −0.2412* | −0.1804* | −0.1020* | 1 | |||||
| Extraction | 0.0071 | −0.0325 | 0.1248* | 0.1084* | 0.1363* | 0.0795* | 0.0016 | 0.1085* | −0.1897* | 0.2252* | −0.0886* | 0.0084 | 1 | ||||
| Construction | 0.0213 | 0.0033 | 0.040 | −0.0164 | −0.0083 | 0.0431 | 0.0215 | −0.0049 | 0.0043 | −0.0221 | 0.0987* | −0.0518 | −0.052 | 1 | |||
| Manufacturing | 0.0908* | −0.1043* | −0.0844* | −0.0567 | −0.0323 | 0.0885* | 0.1485* | 0.0459 | 0.0108 | −0.0339 | 0.0306 | 0.1015* | −0.2889* | −0.1055* | 1 | ||
| Transportation | 0.1030* | 0.0943* | −0.0741* | −0.0518 | −0.0730* | −0.0855* | −0.1249* | −0.0909* | 0.1481* | −0.0769* | −0.037 | −0.0985* | −0.1588* | −0.058 | −0.3220* | 1 | |
| Commerce | −0.018 | 0.0779* | 0.03 | 0.0856* | 0.0202 | −0.0624 | −0.0748* | −0.003 | 0.0025 | −0.0039 | −0.057 | −0.0016 | −0.1227* | −0.0448 | −0.2488* | −0.1367* | 1 |
Note(s): *p < 0.05
Source(s): Authors’ own calculations
Table 5 shows the results of the hypothesis tests on Panel A. The coefficients for the hypotheses of the quality of the FI in the host and home countries, and , are positively significant at the 99% confidence level (columns 2 and 5). These results confirm H1 and H2. is positively significant in the hypothesis estimation (column 3) at the 95% confidence level but nonsignificant in the total estimation (column 5). This result partially supports H3. Regarding H4, is positively significant at the 99% confidence level in both estimates (columns 4 and 5). Those results indicate a quadratic relationship between the dependent variable and IID (see below).
Hypothesis testing for Panel A
| (1) | (2) | (3) | (4) | (5) | |
|---|---|---|---|---|---|
| FIQjt | 0.0282*** | 0.0283*** | |||
| (0.00776) | (0.00790) | ||||
| FIQit | 0.0275*** | 0.0290*** | |||
| (0.00797) | (0.00733) | ||||
| FIDIijt | 0.0948** | 0.0684 | |||
| (0.0391) | (0.0417) | ||||
| IIDIijt | 0.0960*** | 0.103*** | |||
| (0.0354) | (0.0331) | ||||
| lnGDistij | −0.157 | −0.152 | −0.154 | −0.205* | −0.184 |
| (0.124) | (0.124) | (0.123) | (0.124) | (0.121) | |
| lnGDPjt | 0.149*** | 0.180*** | 0.176*** | 0.172*** | 0.230*** |
| (0.0422) | (0.0473) | (0.0428) | (0.0481) | (0.0434) | |
| lnGDPit | 0.406*** | 0.559*** | 0.428*** | 0.403*** | 0.572*** |
| (0.0632) | (0.0748) | (0.0577) | (0.0639) | (0.0676) | |
| DiffGDPpcijt | −0.0422 | 0.0720 | −0.0288 | −0.0183 | 0.0637 |
| (0.0679) | (0.0964) | (0.0666) | (0.0858) | (0.0986) | |
| US and Canada | −0.00523 | −0.281 | −0.295 | −0.193 | −0.809*** |
| (0.263) | (0.292) | (0.287) | (0.316) | (0.296) | |
| Spain and Portugal | −0.130 | −0.156 | −0.289 | −0.0927 | −0.284 |
| (0.325) | (0.322) | (0.329) | (0.333) | (0.317) | |
| Rest of the world | −0.615*** | −0.599*** | −0.780*** | −0.704*** | −0.890*** |
| (0.216) | (0.221) | (0.220) | (0.239) | (0.213) | |
| Constant | −1.975 | −7.747*** | −2.700** | −2.004 | −8.479*** |
| (1.348) | (1.744) | (1.377) | (1.361) | (1.639) | |
| Observations | 659 | 658 | 659 | 659 | 658 |
| Groups | 154 | 153 | 154 | 154 | 153 |
| chi2 | 503.2 | 309.8 | 630.5 | 461.5 | 4,062 |
| Significance | 0 | 0 | 0 | 0 | 0 |
Note(s): Standard error in parentheses. ***p < 0.01, **p < 0.05 and *p < 0.1
Source(s): Authors’ own calculations
Regarding the control variables, although geographical distance maintains a negative sign, it is not statistically significant except for one estimation in Table 4 (column 4). The GDP coefficients of the host and home countries are positively significant at the 99% confidence level in all estimates ( and , respectively). The coefficient of the difference in GDP per capita () fluctuates in sign and remains non-significant in the estimations. The coefficients of the investment destination variables are negative. The most interesting case is that of the rest_of_the_world group, which consistently shows a negative and significant coefficient in all estimates at the 99% confidence level. This could be interpreted as a consistent preference for investing more in either geographically close or culturally related countries but deselecting the rest of the world.
Table 6 contains the estimates from panel B. The coefficients and are positively significant at the 99% confidence level (columns 2 and 5), supporting H1 and H2. Notably, the coefficient of H3 () is negatively significant only in the last estimate at the 99% confidence level (column 5), partially supporting hypothesis 3. In contrast, is positively significant solely at the 99% confidence level in the partial model (column 4) but loses significance in the full model. Despite the inconsistency across models, these findings partially contradict H4, highlighting the need for further investigation (see below).
Hypothesis testing for Panel B
| (1) | (2) | (3) | (4) | (5) | |
|---|---|---|---|---|---|
| FIQj | 0.0300*** | 0.0314*** | |||
| (0.00512) | (0.00481) | ||||
| FIQi | 0.0350*** | 0.0343*** | |||
| (0.00572) | (0.00622) | ||||
| FIDIij | −0.0225 | −0.0825*** | |||
| (0.0295) | (0.0275) | ||||
| IIDIij | 0.112*** | 0.0298 | |||
| (0.0372) | (0.0368) | ||||
| lnGDist | 0.0613 | −0.00618 | 0.0664 | 0.0585 | −0.0170 |
| (0.0717) | (0.0779) | (0.0672) | (0.0714) | (0.0726) | |
| lnGDPj | 0.113*** | 0.163*** | 0.117*** | 0.108*** | 0.163*** |
| (0.0284) | (0.0283) | (0.0275) | (0.0290) | (0.0262) | |
| lnGDPi | 0.284*** | 0.523*** | 0.282*** | 0.331*** | 0.506*** |
| (0.0404) | (0.0550) | (0.0409) | (0.0425) | (0.0545) | |
| DiffGDPpcij | −0.120** | −0.107* | −0.113** | −0.102* | −0.134** |
| (0.0569) | (0.0624) | (0.0576) | (0.0594) | (0.0588) | |
| US and Canada | −0.429** | −1.035*** | −0.359* | −0.542*** | −0.967*** |
| (0.194) | (0.200) | (0.191) | (0.198) | (0.201) | |
| Spain and Portugal | −0.234 | −0.290* | −0.217 | −0.252 | −0.271* |
| (0.217) | (0.171) | (0.213) | (0.217) | (0.161) | |
| Rest of the world | −0.598*** | −0.729*** | −0.569*** | −0.721*** | −0.722*** |
| (0.162) | (0.163) | (0.152) | (0.167) | (0.157) | |
| Extraction | 0.806*** | 0.879*** | 0.814*** | 0.810*** | 0.894*** |
| (0.111) | (0.101) | (0.114) | (0.114) | (0.0977) | |
| Construction | 0.826*** | 0.867*** | 0.789*** | 0.804*** | 0.833*** |
| (0.127) | (0.150) | (0.139) | (0.132) | (0.160) | |
| Manufacturing | 1.074*** | 1.190*** | 1.055*** | 1.040*** | 1.227*** |
| (0.113) | (0.102) | (0.114) | (0.112) | (0.109) | |
| Transportation | 1.442*** | 1.479*** | 1.433*** | 1.406*** | 1.528*** |
| (0.118) | (0.106) | (0.120) | (0.122) | (0.107) | |
| Commerce | 0.849*** | 0.840*** | 0.861*** | 0.880*** | 0.871*** |
| (0.139) | (0.119) | (0.144) | (0.138) | (0.127) | |
| Constant | −2.798*** | −10.08*** | −2.817*** | −3.525*** | −9.788*** |
| (0.740) | (1.207) | (0.679) | (0.750) | (1.185) | |
| Observations | 858 | 857 | 858 | 858 | 857 |
| Groups | 333 | 332 | 333 | 333 | 332 |
| chi2 | 6,611 | 3,280 | 2,677 | 1753 | 1,625 |
| Significance | 0 | 0 | 0 | 0 | 0 |
Note(s): Standard error in parentheses. ***p < 0.01, **p < 0.05 and *p < 0.1
Source(s): Authors’ own calculations
Regarding the control variables, the geographical distance variable is inconsistent across estimates but not statistically significant. Conversely, the coefficients for home and host country GDPs [ and are positively significant in all estimates at the 99% confidence level.
Table 6 shows negative coefficients for all host country groups. United_States_and_Canada and rest_of_the_world are significant at 95–99% confidence levels. Spain and Portugal coefficients are negative but not consistently significant. Conjointly, these country effects imply that Latin_America (the implicit variable) has a consistently positive effect, i.e. there is a marked preference for CBM&As within the region. In general, country effects have higher levels of significance in Panel B, where industry effects are included.
4.2 Robustness tests
Given an observed sign opposite to expectations from literature, the possibility of quadratic behavior for the IID variable was explored. For this purpose, we performed extra runs with the quadratic variables and . In Panel A, we found statistical significance for at the 99% confidence level, while was not statistically significant. In Panel B, both variables are significant at the 95% confidence level, providing strong evidence of an inverse quadratic or inverted U-shaped relationship between CBM&As by LATAM firms and IID.
Furthermore, estimates were performed by removing transactions of less than USD one million and the industrial group of transportation and others. The results show a loss of statistical significance in the variable FIQj. In addition, there is evidence to support the argument of the inverted U-shaped behavior in the FID. However, in the IID, such behavior is not present.
5. Discussion
5.1 Theoretical implications
The study findings indicate that the quality of the home country’s FI supports the CBM&A activities of LATAM firms. This result confirms previous studies, such as Falahat et al. (2020), Reddy et al. (2022), Takyi et al. (2022) and Yan et al. (2020). In other words, these findings support the institutional fostering or leverage hypothesis (Buitrago et al., 2023; Sengupta et al., 2023) while rejecting the opposite hypothesis that low-quality FI drives LATAM firms to seek opportunities abroad.
Robust support was also found for the hypothesis that LATAM acquirers are looking for targets within national contexts with better formal institutions. For the acquiring firms, M&As are a means to overcome the limitations of their home-country institutional environments.
While the above results seem clear enough at the general level, testing the home-host country distance regarding formal institutions provides more nuanced results: When introducing industry variables, consistently significant results are obtained, which point to a negative influence of formal institutional distance. In other words, LATAM acquirers identify targets in countries that are not too dissimilar in their formal institutions, avoiding business environments that are either overregulated or suffer from significant institutional voids.
The study initially hypothesized a negative relationship between IID and CBM&A activity, as suggested by several studies (Bertrand et al., 2007; Malhotra et al., 2011; Ahern et al., 2015). However, for the general model, a significant positive relationship was found, in the sense that LATAM acquirers prefer culturally similar target countries. When introducing industry control variables, IID remains positive, but the coefficient is not significant anymore and only recovers its significance when introducing a quadratic control variable, which proves to be negative and significant. The study researchers’ interpretation of this complex result is that while LATAM firms exhibit a general preference for similar informal institutions, they avoid those countries that are either too similar or too different.
The results of this research are thus like other empirical studies in different contexts, such as Lankhuizen and de Groot’s (2016), who found a quadratic relationship between cultural distance and international trade, while Amal and Tomio (2015) reported a positive relationship between Brazilian OFDI and cultural distance. Li et al. (2020) also identified an inverted U-shaped relationship between CBM&A performance and IID.
5.2 Managerial/policy implications
If strategic decision-makers in LATAM firms aim to take inspiration from the expansion trajectories of their peers, one conclusion would be to direct their international expansion efforts to countries with relatively strong institutions, but not to those countries where regulations are excessively strong. The same general advice applies to cultural similarity: According to the study results, expanding to a very similar country does not make significant strategic sense, while very different foreign environments could present an excessive challenge. An exception to this general rule is a marked preference for targets within Latin America, due to both cultural and geographical proximity. Additionally, this research found that industry effects may play a major role in those decisions. Managers are thus advised to include all of the above factors in their analysis when making strategic foreign investment decisions.
For policymakers in LATAM, these results indicate that strengthening domestic institutions (rule of law, tax law, among others) should be a part of an industrial policy that enables domestic firms to overcome resource and market limitations at home. M&As in foreign countries are one means for LATAM firms to foster their participation in global value chains, which may help their home countries to overcome the middle-income trap.
5.3 Limitations and future research agenda
While this study considers a period of 24 years, there are certain aspects that the data did not cover. The Thompson ONE database is not exhaustive compared to other premium databases such as SDC Platinum; a more complete data source might lead to slightly different results. In the statistics, some industry effects were also detected, but segmenting the sample would have led to nonsignificant results. The sample ends in 2018, missing the impact of the COVID-19 pandemic on FDI. Future studies should investigate the pandemic’s effects on foreign investment.
One aspect of interest would be to follow the expansion paths of specific firms in order to elucidate whether the international experience acquired over time influences the nature of their acquisition targets. Similarly, it would be interesting to investigate M&As from LATAM in the context of firms’ overall internationalization strategies, for example, whether M&As play a role in the establishment of greenfield investments in the same or other target countries.
While Krug and Falaster (2022) and Papageorgiadis et al. (2020) examined formal and informal institutions in FDI, further research could explore how II emerge or are strengthened in EM with weak FI (Khanna and Palepu, 1997).
6. Conclusions
This study highlights key considerations for managers evaluating CBM&As in various countries. Understanding local institutions is crucial, as they influence business strategies. The descriptive analysis reveals that LATAM companies face investment barriers beyond the Americas, likely due to their market-seeking focus. While pursuing higher demand is not inherently negative, it exposes a persistent technological gap in some LATAM industries. Companies must either develop or acquire technology to address this gap. Consequently, it is reasonable to conclude that EMNEs invest more in CBM&As than other companies.
The study findings show that companies starting internationalization processes greatly benefit from the support of their home country institutions. Thus, this research highlights the critical role of these institutions in LATAM for organizational strategy and the importance of relevant public policies for governments.
Funding: This research was made possible by both the Tecnologico de Monterrey’s academic excellence scholarship and the CONACyT grant for postgraduate students.
Notes
In the literature, the operationalization of institutional informal distance has been using Hofstede’s (1980) dimensions, which is equivalent to cultural distance from Scott’s (1985) perspective (cf. Kostova et al., 2020).
