


Epoxy EPON 828 was reinforced with a single layer of carbon fiber fabrics and exhibited significant increase of thermal and mechanical properties. Two fabric types, twill 2/2 and 4-harness satin (4HS), were investigated. Epoxy of diglycidyl ether of bisphenol-A/epichlorohydrin, EPON 828 was cross-linked with 4,4’-diaminodiphenylmethane. The thermal decomposition temperature, Tdec, and the glass transition temperature, Tg, of the composites were increased relative to the neat epoxy, and the 4HS fabric increased Tdec and Tg over 60 K. The twill fabric increased fourfold the tensile Young’s modulus E and twofold the flexural modulus E’. In contrast, when adding a nonwoven glass fiber fabric, the tensile modulus only increased twofold, thus highlighting the unique reinforcement effect of woven carbon fibers. Scanning electron microscopy showed that the epoxy resin was well dispersed within the carbon fiber fabrics and the absence of matrix–fiber debonding indicated an efficient stress transfer between epoxy and carbon fibers. Dynamic mechanical analysis showed a shift to higher temperatures of the α mechanical relaxation, and the intensity of the mechanical damping was attenuated denoting restricted macromolecular motions, and this may explain the enhanced thermal and mechanical properties.
Notation
1. Introduction
Reinforced epoxy thermosets are developed for electronics, medical, automotive, and aerospace applications.1,2 Adding fillers and additives to epoxy resins can induce chemical and corrosion resistance and increase the mechanical properties.3 When adding fibrous materials, the mechanical properties will be anisotropic.4 The fillers also increase the thermal and flame resistance,5,6 enhance adhesion to many substrates,7 reduce the shrinkage upon cure, and enhance the thermal and electromagnetic shielding properties.4,8–10
Adding nanotubes and nanoclays11,12 and steel fibers13 increased the mechanical properties of epoxy resins. On the other hand, rubber nanoparticles increased the strain to fracture and the fracture toughness.14,15 Furthermore, epoxy microcapsules have produced self-healing composites.16,17
Carbon fiber, woven and nonwoven, is an attractive reinforcing material for thermosets due to its low density and thermal conductivity.18 Moreover, carbon fibers induce superior mechanical and electrical properties in epoxy resins.8–10,18 Furthermore, epoxy/carbon fibers produce composites with impact resistance at cryogenic temperatures.19
The use of fibers, in general, as reinforcers to epoxy resins can induce anisotropy in the final physical properties because of the fiber preferred orientation.20 Fibers also influence the moisture diffusion21 and the water absorption in the epoxy composites.22 Moreover, elaborated preparation methods have been reported to increase the epoxy–fiber adhesion to enhance the mechanical properties.23–25
The use of woven fabrics to produce high-performance composites has increased in the recent years due to their convenient features.26–29 These include light weight, high strength, easy and fast lay-up application, and cost effectiveness. There are currently many options such as knit, woven, and nonwoven. Woven fabrics are more favored as reinforcement materials. The physical properties of the composites are determined by the combination of carbon fiber fabric/resin matrix and by the interphase formed between the fibers and the matrix.25–31
Interfacial adhesion can efficiently transfer stress between matrix and fibers, which is key to the final physical properties of the composites.25–31 Thus, a variety of pre- and posttreatment methods are investigated to enhance the mechanical properties and toughness of carbon fiber/epoxy composites. These include adding thermoplastics,28 electrospun polymer fibers,29 polymer microemulsions,30 and graphene/imide layers.31 However, note that pretreating the fibers and epoxy resin (denoted prepregs) and adding additives to enhance the interfacial adhesion is time consuming and increases the cost.25,27–31 Thermal annealing and posttreatment of composite materials also demonstrated increase of mechanical properties and reduction of defects in joints.32–35
Thus, for the sake of cost and time reduction, it is desirable to avoid multiple fiber fabric layering and epoxy pretreatment to develop high-performance epoxy/carbon fiber composites. Therefore, this research reports on the facile fabrication of epoxy/carbon fiber fabric composites where a single layer of fabric was sufficient to enhance the thermal and tensile mechanical properties. As-received woven carbon fiber fabrics, twill 2/2 and 4-harness satin (4HS) were utilized, thus taking advantage of the fiber’s bidirectional orientation. Moreover, no fiber surface treatment was applied. Furthermore, no posttreatment (e.g. thermal annealing) was applied, thus emphasizing our simple and cost-effective processing.
2. Experimental
2.1 Materials
2.1.1 Reagents
The epoxy resin was EPON 828, and it is an undiluted clear difunctional bisphenol A/epichlorohydrin-derived liquid epoxy resin. EPON 828 has a weight per epoxide of 185–192, functionality of 2, molecular weight of 340.41 g/mol, and density ρ = 1.16 g/ml (25°C). The epoxy resin manufactured by Hexion was purchased through Univar de Mexico SA de CV (Mexico). The cross-linker agent was the tetrafunctional aromatic 4,4′-diaminodiphenylmethane (DDM), and it was purchased from Aldrich Chemical Co. (St Louis, MO, USA). The emphasis of this research was on applications; that is why, we chose EPON 828. This epoxy is commercially available and of relatively low cost. DDM is a relatively low-temperature cross-linker agent, favoring curing at relatively lower temperatures (see Table 1). We are currently studying a laboratory-grade epoxy DGEBA and different cross-linker agents (for instance, the higher temperature 4,4-diaminodiphenyl sulfone of Tm = 187°C) to contrast the thermal and mechanical properties and the findings will be reported in a future publication.
Physical and chemical properties of epoxy resin and hardener (curing agent)
| Reactive | Mn: g/mol | Density: g/ml | Tm: °C | Functionality | Equiv: g/eq |
|---|---|---|---|---|---|
| EPON 828 | 377.0 | 1.160 | 40 | 2 | 185–192 |
| DDM | 198.26 | — | 100 | 4 | 49.6 |
The reagents were used as-received without further purification, the physical and chemical properties are summarized in Table 1 and their chemical structures are shown in Figure 1.
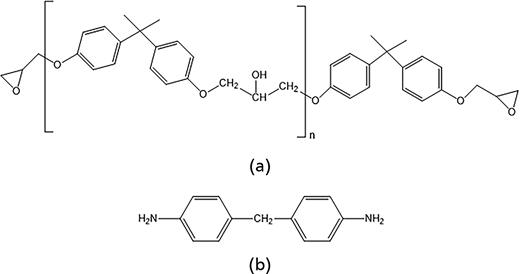
Chemical structure of (a) EPON 828, diglycidyl ether of bisphenol A/epichlorohydrin, and (b) 4,4’-diaminodiphenylmethane (DDM)
Chemical structure of (a) EPON 828, diglycidyl ether of bisphenol A/epichlorohydrin, and (b) 4,4’-diaminodiphenylmethane (DDM)
2.1.2 Carbon fibers
The reinforcing fabrics consisted of a 2/2 twill weave carbon fiber fabric of 220 μm thickness and 0.17 g/m2, and a 4HS weave carbon fiber fabric (also called crowfoot satin) of 220 μm thickness (0.17 g/m2) and marketed as 4HS. The twill carbon fiber is made by passing the weft thread over two warp threads and then under two warp threads and so on with a ‘step’, or offset, between rows to create a characteristic diagonal pattern, as shown in Figure 2(a). The 4HS fabric is made by the fill yarn passing over three warp yarns and under one, as shown in Figure 2(b). The fabrics were purchased from Illstreet Composites LLC (Charleston, SC, USA).
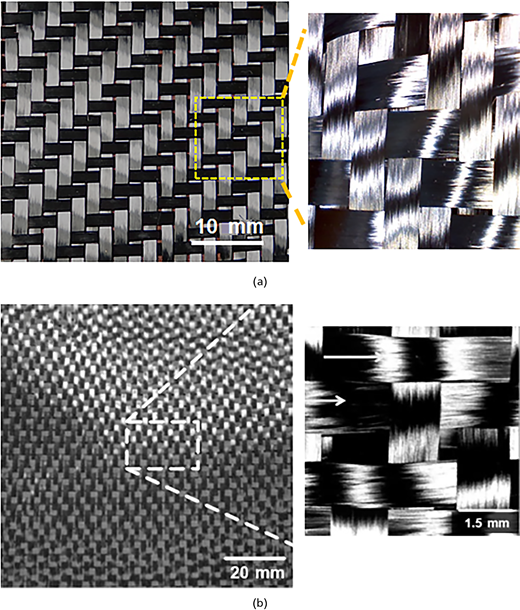
Optical micrographs of woven carbon fiber fabrics: (a) 2 × 2 twill weave carbon fiber, and (b) 4HS weave carbon fiber
Optical micrographs of woven carbon fiber fabrics: (a) 2 × 2 twill weave carbon fiber, and (b) 4HS weave carbon fiber
2.1.3 Glass fibers
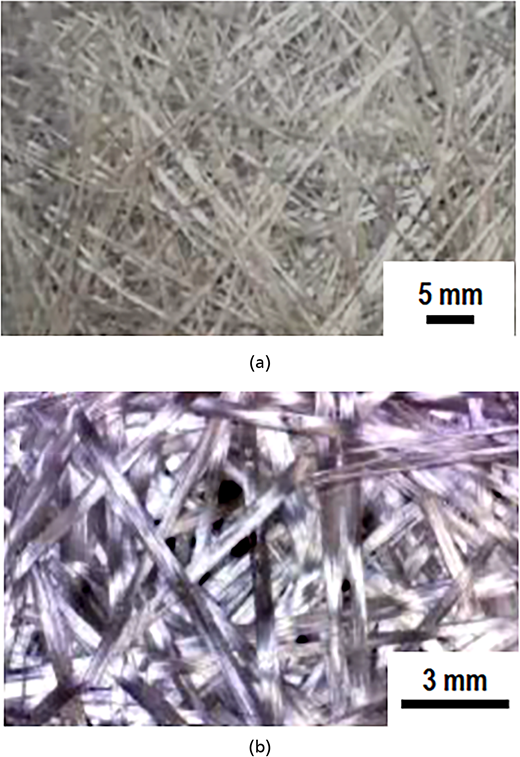
To contrast the results obtained using carbon fiber fabrics, a composite was fabricated using nonwoven glass fiber fabric. This is marketed as FIBVI 14K. The fabric was made with loosely connected glass fibers bonded together, thus creating a resin-rich surface that helps reduce formation of microcracks and increases chemical stability. Optical micrographs of the fabric are shown in Figure 3.
2.2 Preparation of composites
The undiluted EPON 828 resin is a Newtonian viscous liquid36 within the temperature range 20°C–40°C, with shear viscosity of 12 Pa·s at 20°C and reduced to 1.5 Pa·s at 40°C. The viscosity was measured with a CVO rheometer (Malvern, UK) using parallel plates of 20 mm dia., 1 mm gap and Peltier heating system. The results are shown in Figure S1 of Supporting Information (SI). These results determine the temperature dependence of the viscosity and establish the best processing conditions. Thus, to enable handling and proper mixing with the cross-linking agent (DDM) and an efficient impregnation of the carbon fiber fabrics, the mixing was carried out at 40°C.
The epoxy resin was vigorously stirred at 40°C; then, 25 g of the cross-linker DDM was added per 100 g of epoxy, as indicated by the manufacturer’s Technical Data Bulletin.37 Stirring of the mixture continued for 180 s. The mixture was poured onto a preheated stainless-steel mold until half the thickness was filled. Then, the respective fabric was laid up onto the liquid mixture. Finally, the gap of the mold was filled with the remaining liquid mixture up to a thickness of ca. 1.5 mm. The mold was then placed in a preheated electric oven and the cross-link reaction was carried out at 80°C for 180 min. The composite fabrication procedure is shown in Figure 4.
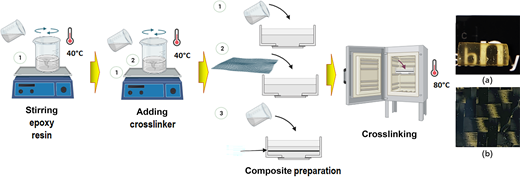
Photographs of the fabricated composites are shown in Figure 5.
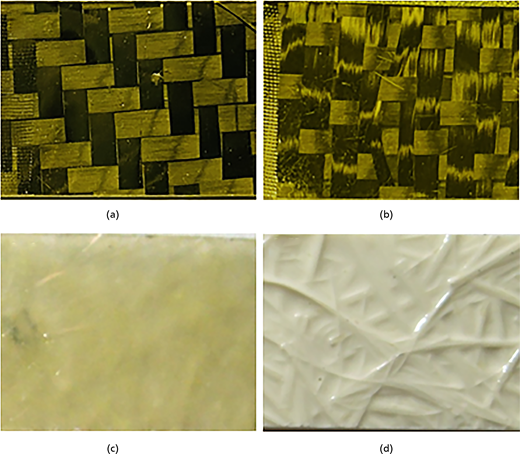
Photographs of (a) epoxy/twill carbon fiber composite, (b) epoxy/4HS carbon fiber composite, and (c) epoxy/glass fiber composite. (d) Photograph of epoxy/glass fiber composite using white dye to enhance the fiber morphology. Composites cured at 80°C for 180 min
Photographs of (a) epoxy/twill carbon fiber composite, (b) epoxy/4HS carbon fiber composite, and (c) epoxy/glass fiber composite. (d) Photograph of epoxy/glass fiber composite using white dye to enhance the fiber morphology. Composites cured at 80°C for 180 min
2.3 Thermal analysis
The thermal transitions and kinetics of cross-linking reaction were characterized by differential scanning calorimetry (DSC) using the DSC6000 calorimeter (Perkin Elmer, CT, USA). Temperature and enthalpy calibration were carried out using analytical grade indium (Tm = 156.6°C). A heating rate of 10°C/min was used and dry nitrogen atmosphere was used. The thermal degradation temperature, Tdec, was determined by thermogravimetric analysis (TGA), with the TGA Q500 (TA Instruments, New Castle, DE, USA) under dry nitrogen atmosphere. Samples of about 20 mg were loaded in platinum pans and heated from room temperature at 10°C/min.
2.4 Fourier transform infrared spectroscopy
The chemical structure of the reagents was confirmed by Fourier transformed infrared spectroscopy using the Nicolet iS10 spectrometer (Thermo Scientific, USA). Scans were carried out at 1 cm−1 resolution, averaging 32 scans, in attenuated total reflection mode. The spectra were analyzed using OMNIC software (Thermo Scientific Inc). The infrared spectra of the reagents EPON 828 and DDM and that of the cured epoxy are shown in Figures S2 and S3 of SI and the detailed bands identification are summarized in Table S1 of the SI.38
2.5 Mechanical properties
The elastic modulus and stress at fracture were determined in tension mode at room temperature using the universal testing machine Instron model 4206 (Instron USA) and according to the ASTM D638 standard.39 The specimen dimensions were 50 mm × 13 mm × 1.3 mm. The average value was recorded by testing at least two specimens, straining at a cross-head speed of 5 mm/min. The data were analyzed with the software OriginPro 2020.
2.6 Morphology
The morphology of fractured surfaces was studied by scanning electron microscopy (SEM) and optical microscopy. The SEM was a model JEOL 6400 (JEOL USA Inc., Peabody MA, USA), and the fractured materials’ surfaces were first metal coated with Au/Pd by a sputtering procedure. Optical micrographs were acquired with an Eclipse LV100N (Nikon) microscope in bright field mode. The micrographs were recorded with the digital camera Quicam, model Fast 1394, manufactured by Qimaging. The micrographs were analyzed with the software ImageJ.40
2.7 Dynamic mechanical analysis (DMA)
The dynamic mechanical moduli E′ and E′′ were measured using dual cantilever mode with the DMA Q800 (TA Instruments, USA) oscillating at 1 Hz and within the linear viscoelastic regime. The linear viscoelastic response of the materials was verified at room temperature by varying the amplitude of oscillation, ε, from 0.001% to 0.1%. Then, the elastic, E′, and viscous, E′′, moduli were measured as a function of temperature and frequency. A heating rate of 2°C/min and frequency range 1–100 Hz were used, with amplitude of oscillation of 0.01%.
3. Results and discussion
3.1 Kinetics of cross-linking
Firstly, the influence of temperature on the curing kinetics of the epoxy EPON 828 cross-linked with DDM was studied by DSC,41 and the results are shown in Figure 6. At a given curing temperature, the specimen was held isothermally for a given time and then tested by DSC. The three-dimensional (3D) plots of heat flow as a function of temperature and as a function of time curing at 80°C and at 100°C are shown in Figures 6(a) and 6(b), respectively.
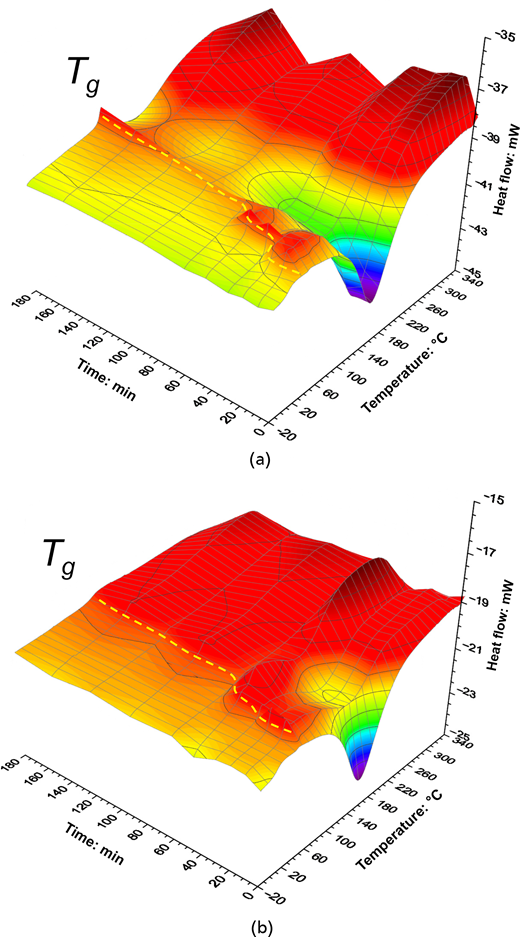
3D plots of heat flow as a function of temperature and time, scanning at 10°C/min. EPON 828 resin cross-linked with DDM at (a) 80°C and (b) 100°C
3D plots of heat flow as a function of temperature and time, scanning at 10°C/min. EPON 828 resin cross-linked with DDM at (a) 80°C and (b) 100°C
These results showed that, soon after mixing, the specimen exhibited a Tg of 10°C. This transition was followed by a pronounced exothermic peak at ca. 140°C due to the cross-linking reaction. The DSC map of Figure 6(a) shows that Tg gradually increased as the reaction time increased (as indicated by the dotted line on the 3D plot). At the same time, the magnitude of the exothermic peak decreased, that is, the heat of reaction diminished due to the increase of conversion. At longer times, the Tg tended to plateau, and the exothermic peak tended to vanish indicating the end of cross-linking reaction.
Increasing the cross-linking temperature to 100°C increased the rate of reaction, as shown in Figure 6(b). The DSC map still shows the pronounced exothermic peak at ca. 140°C and the gradual increase of Tg (indicated by the dotted line).
The temporal evolution of the glass transition temperature Tg of EPON 828 as a function of curing temperature is shown in Figure 7(a). Note that the increase of Tg is correlated with the increase of reaction conversion.41 The plot shows that curing at 80°C and 100°C the Tg first increased slowly but in a short time range, from ca. 50 to 60 min, Tg exhibited a steep increase. Then, Tg gradually continued increasing with cross-linking time until reaching 103°C after 180 min cross-linking time.
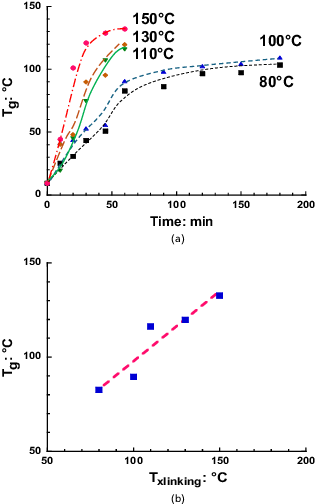
(a) Glass transition temperature Tg as a function of reaction time t and cross-linking temperature Txlinking, where the temperatures are indicated in the plot. (b) Tg after cross-linking for 60 min at Txlinking. EPON 828 cross-linked with DDM
(a) Glass transition temperature Tg as a function of reaction time t and cross-linking temperature Txlinking, where the temperatures are indicated in the plot. (b) Tg after cross-linking for 60 min at Txlinking. EPON 828 cross-linked with DDM
Strikingly, curing at 110°C induced a rapid increase of Tg, and after 60 min reaction Tg reached ca. 116°C. Increasing the cross-linking temperature produced faster increase of Tg, as shown in Figure 7, where cross-linking at 150°C induced a Tg of 132°C after only 60 min reaction. The DSC traces as a function of cross-linking time at 110°C, 130°C, and 150°C are shown in Figure S4 of SI.
The evolution of Tg as a function of cross-linking temperature Txlinking after 60 min reaction is shown in Figure 7(b). These results show that Tg is a linear function of Txlinking, where the best fit to the experimental data using OriginPro 2020 gives
that is, Tg increased at a rate of 0.74 (± 0.14). These results showed that the final Tg of the cured epoxy resin is modulated by the curing temperature. Hence, the intended application will define the chosen curing temperature. In this research, we focused on curing temperature of 80°C and results at different curing temperatures will be reported elsewhere.
The significant increase of Tg with cross-linking temperature shown in Figure 7 may be associated to the higher conversion achieved at higher temperatures. That is, the higher conversion achieved in the composite means that there are less reactive chain ends, or dangling chains, and the more perfect molecular network would highly restrict cooperative (long range) molecular motions and therefore increase Tg.42,43
3.2 Tensile mechanical properties of neat epoxy
We studied the influence of cross-linking temperature Txlinking on the mechanical properties of the neat epoxy. Uniaxial tensile deformation, at room temperature, was utilized and the results are shown in Figure 8. The cross-linking temperature was varied from 80°C up to 150°C keeping constant the cross-linking time at 180 min. The stress–strain traces at the different cross-linking temperatures Txlinking are shown in Figure S5 of SI. Note that the stress–strain traces correspond to two or three tests on each specimen, using a fresh specimen each time, and the results are quite reproducible. Figure S5 shows that the neat epoxy exhibits a linear, elastic regime, up to about 1% strain. Increasing the strain, there is plastic deformation and then fracture at about 3% to 4% strain. Note that the strain-to-fracture is a weak function of Txlinking.
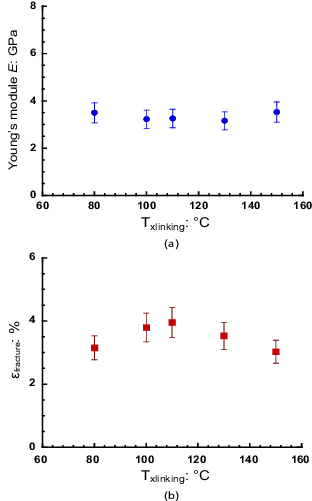
(a) Young’s modulus E and (b) strain-to-fracture εfracture of EPON 828 resin cross-linked with DDM for 180 min at the indicated temperatures. Uniaxial tensile testing was carried out at room temperature
(a) Young’s modulus E and (b) strain-to-fracture εfracture of EPON 828 resin cross-linked with DDM for 180 min at the indicated temperatures. Uniaxial tensile testing was carried out at room temperature
The Young’s modulus was determined from the initial slope in the elastic regime of the stress–strain curves (ε ranging from 0% to 0.3%),42,43 and these values along with the strain-to-fracture (εfracture) are summarized in Figure 8. Strikingly, the results showed that there is no influence of the cross-linking temperature on the mechanical properties of EPON 828 cross-linked with DDM. Figure 8(a) shows that the Young’s modulus was independent of Txlinking and remained at ca. 3.3 GPa (± 0.15 GPa). On the other hand, Figure 8(b) shows that the strain-to-fracture varied from 3% to 4%, starting at 3% at Txlinking = 80°C, reaching its maximum of 4% at Txlinking = 110°C, and then gradually reducing to 3% at Txlinking = 150°C. Therefore, the cross-linking temperature of 80°C was chosen to prepare all the composites. This is the lowest processing temperature aiming for a low-energy and cost-effective composite production without compromising the mechanical properties. The results are discussed in the following sections.
3.3 Thermal properties
The thermal degradation behavior of the epoxy and composites cross-linked at 80°C for 180 min was investigated by TGA and the results are shown in Figure 9(a). Strikingly, the results showed that the onset of thermal degradation of the composites, Tdec, significantly increased relative to the neat epoxy. Note that the composite prepared with 4HS carbon fiber fabric exhibited the largest increment of Tdec, some 60°C. That is, the single layer carbon fiber fabrics significantly increased the thermal stability of the epoxy composites. The TGA traces of Figure 9(a) also show that above the onset of thermal degradation, there is a rapid decay of mass as most of the epoxy phase was burnt off. The thermal degradation of the epoxy phase enabled to determine the weight content of carbon fiber of 15.7 wt.%, which corresponds to fiber volume fraction of 22%.
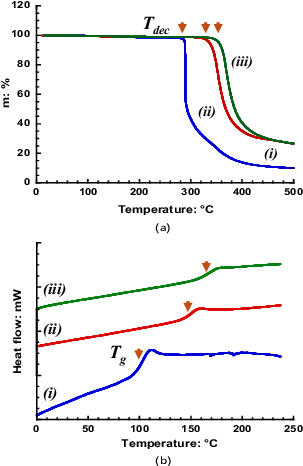
(a) TGA heating scans, and (b) DSC heating scans of cross-linked (i) EPON 828, (ii) EPON 828/twill carbon fiber composite, and (iii) EPON 828/4HS carbon fiber composite. Specimens were cross-linked at 80°C for 180 min
(a) TGA heating scans, and (b) DSC heating scans of cross-linked (i) EPON 828, (ii) EPON 828/twill carbon fiber composite, and (iii) EPON 828/4HS carbon fiber composite. Specimens were cross-linked at 80°C for 180 min
The enhancement of thermal behavior was also observed in the glass transition of the composites, as shown in Figure 9(b). These results show a pronounced increase of glass transition temperature. The 4HS fabric induced the largest increase of Tg (166°C), which is an increment of ca. 62°C relative to the neat epoxy. The glass transition of polymeric materials is associated to the activation of long-range cooperative molecular motions. These results therefore suggest that there may be a more perfect molecular network in the composites. This network then requires more energy to active the long-range molecular motions, thus increasing the Tg.42,43 These results may also explain the higher thermal stability of the composites determined by TGA. A more perfect molecular network in the composites would better withstand thermal energy and consequently increase Tdec. The thermal properties are summarized in Table 2.
3.4 Mechanical properties of composites
The stress–strain traces of the EPON 828/carbon fiber composites are shown in Figure 10(a). These traces are the average of two and three repeats. The trace i shows that the stress of Epon 828 initially increased linearly followed by slight plastic deformation before fracturing at ca. 3.3%. On the other hand, the twill fabric (trace ii) induced considerable increase of stress at low deformation, where only the linear (elastic) regime is observed. This means an increase of tensile modulus. The stress increased nearly linearly until the composite fractured at εfracture ≈ 1.2%. This is a twofold reduction of εfracture relative to the neat epoxy. Strikingly, trace iii shows that the epoxy reinforced with 4HS fabric did not enhance the mechanical properties but only reduced εfracture.
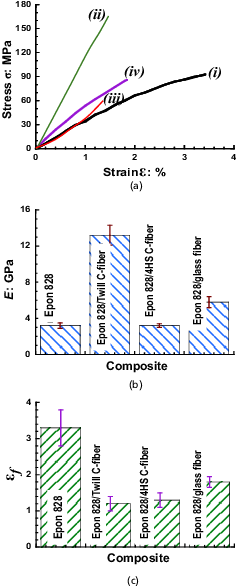
(a) Tensile stress–strain traces of neat EPON 828 (i), EPON 828/twill carbon fiber composite (ii), EPON 828/4HS carbon fiber composite (iii), and EPON 828/glass fiber composite (iv), (b) Young’s modulus, and (c) strain-to-fracture. Uniaxial tensile tests were carried out at room temperature
(a) Tensile stress–strain traces of neat EPON 828 (i), EPON 828/twill carbon fiber composite (ii), EPON 828/4HS carbon fiber composite (iii), and EPON 828/glass fiber composite (iv), (b) Young’s modulus, and (c) strain-to-fracture. Uniaxial tensile tests were carried out at room temperature
For comparison purposes, Figure 10(a) also shows the stress–strain trace of Epon 828/glass fiber composite (trace iv), which was also processed at 80°C for 180 min. There is an increase of stress at constant strain denoting a reinforcing effect of the nonwoven glass fiber fabric. The stress shows an initial linear regime followed by plastic deformation.
The mechanical properties are summarized in Table 3 and Figures 10(b) and 10(c). The results denote considerable mechanical reinforcement induced by the twill carbon fiber fabric, where the elastic Young’s modulus increased nearly 400% whereas the tensile strength increased by 100% relative to the neat epoxy Epon 828. This mechanical reinforcement is comparable or superior to multilayer carbon fiber/epoxy composites for aerospace applications.28–31 Note also that the increase of mechanical modulus was penalized by a decrease of εfracture, which is commonly observed in polymer composites.44,45
Mechanical properties of EPON 828/twill carbon fiber fabric composite cross-linked at 80°C for 180 min
| Sample | E: GPa | σf: MPa | εf: % |
|---|---|---|---|
| EPON 828 | 3.3 ± 0.3 | 85 ± 6 | 3.3 ± 0.5 |
| EPON 828/twill carbon fiber | 13.2 ± 1.2 | 160 ± 7 | 1.2 ± 0.2 |
| EPON 828/4HS carbon fiber | 3.2 ± 0.2 | 55 ± 4 | 1.3 ± 0.2 |
| EPON 828/glass fiber | 5.8 ± 0.3 | 83 ± 2 | 1.8 ± 0.1 |
E, Young’s modulus; σf, stress to fracture; εf, strain to fracture
The results also showed that the composite Epon 828/4HS carbon fiber exhibited no change of Young’s modulus and reduction of tensile strength and εfracture, relative to the neat epoxy. Interestingly, the glass fiber fabric increased the Young’s modulus nearly 100% but did not change tensile strength and reduced the εfracture.
To get more insight into the reinforcing effect of the carbon fiber fabrics and assess the degree of anisotropy induced by the carbon fibers, the mechanical properties of the composites were also investigated in flexural mode.
Figure 11(a) shows the dynamic elastic modulus E′ as a function of strain obtained in dual cantilever mode at room temperature and 1 Hz. The results, summarized in Figure 11(b), showed that Epon 828 has a flexural modulus of 2.8 (± 0.2) GPa. This is quite close to the tensile modulus (see Table 3) and denotes isotropic mechanicals in the neat epoxy.
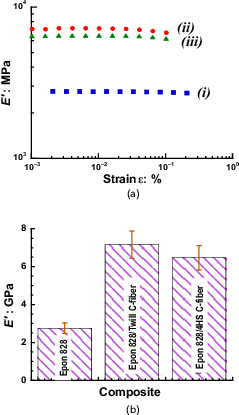
(a) Flexural elastic modulus E’ as a function of strain ε of neat EPON 828 (i), EPON 828/twill carbon fiber composite (ii), and EPON 828/4HS carbon fiber composite (iii). (b) Elastic modulus E’ of each composite
(a) Flexural elastic modulus E’ as a function of strain ε of neat EPON 828 (i), EPON 828/twill carbon fiber composite (ii), and EPON 828/4HS carbon fiber composite (iii). (b) Elastic modulus E’ of each composite
The composites, however, exhibited pronounced anisotropy of mechanical modulus. The composite Epon 828/twill has a flexural modulus E′ of 7.0 (± 0.9) GPa, that is nearly 50% reduction relative to the tensile modulus. Hence, the results suggest that the twill 2/2 carbon fiber fabric efficiently transfers tensile stress, but it is less efficient in flexural mode.
On the other hand, the composite Epon 828/4HS exhibited flexural modulus of 6.2 (± 0.8) GPa, and this is a 100% increase relative to its tensile modulus. That is, the 4HS fabric did not reinforce under tensile stress but it was quite efficient to support flexural stresses. The microstructure in the composites may provide insights into their mechanical performance45 and this is discussed in Section 3.5.
Therefore, these results have shown that the thermal and mechanical properties of the composites are tuned by the type of reinforcing fibers, carbon versus glass, and by the sort of knitting.
3.5 Morphology
The morphology of the composites was investigated by SEM. Figures 12(a) and 12(b) show the SEM micrographs of fractured surfaces under tensile stress of the neat epoxy EPON 828. The micrographs show flat surfaces and sharp edges at the fracture region with sharp edges and fan morphology typical of fracture of brittle materials.45
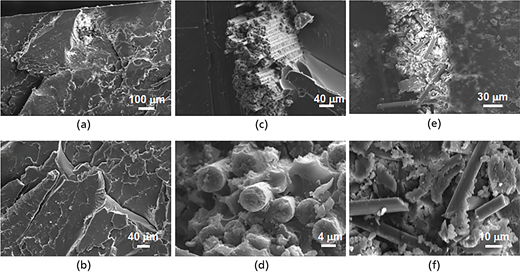
SEM micrographs of fractured specimens under tensile stress of (a, b) neat EPON 828; (c, d) EPON 828/twill carbon fiber composite; (e, f) EPON 828/4HS carbon fiber composite
SEM micrographs of fractured specimens under tensile stress of (a, b) neat EPON 828; (c, d) EPON 828/twill carbon fiber composite; (e, f) EPON 828/4HS carbon fiber composite
Figures 12(c) and 12(d) show the SEM micrographs of the fractured surface of the EPON 828/twill carbon fiber composite. The micrographs exhibit sharp edges and flat surfaces of the epoxy phase at the fractured region. Moreover, there is no evidence of fiber pulling. The micrograph of Figure 12(c) shows that the epoxy resin was well dispersed between the carbon fibers. Furthermore, the higher magnification micrograph of Figure 12(d) shows that the fibers were fractured during the tensile stress. Therefore, the SEM micrographs suggest that there is efficient stress transfer from the epoxy matrix into the carbon fibers. This would be responsible for the fourfold increase of tensile modulus (see Table 3 and Figure 10).
The SEM micrographs of the fractured surface of the EPON 828/4HS carbon fiber composite is shown in Figures 12(e) and 12(f). The micrographs exhibit fragmented and randomly oriented carbon fibers in the epoxy phase. Figure 12(e) suggests fiber pulling and fragmentation upon tensile stress. This feature is clearly appreciated in the higher magnification micrograph of Figure 12(f). These results suggest that the stress was only carried out by the epoxy phase. This may explain the lower tensile mechanical properties summarized in Table 3 and Figure 10.
Optical micrographs of Epon 828/glass fiber composite fractured during tensile deformation are shown in Figure 13. The micrographs show brittle fracture of the epoxy phase and fiber pulling. This suggests little adhesion between the epoxy matrix and the glass fibers. These results then may explain the limited mechanical reinforcement afforded by the glass fiber fabric in tensile mode. The tensile mechanicals were superior to the Epon 828/4HS composite but rather modest when compared with the Epon 828/twill composite.
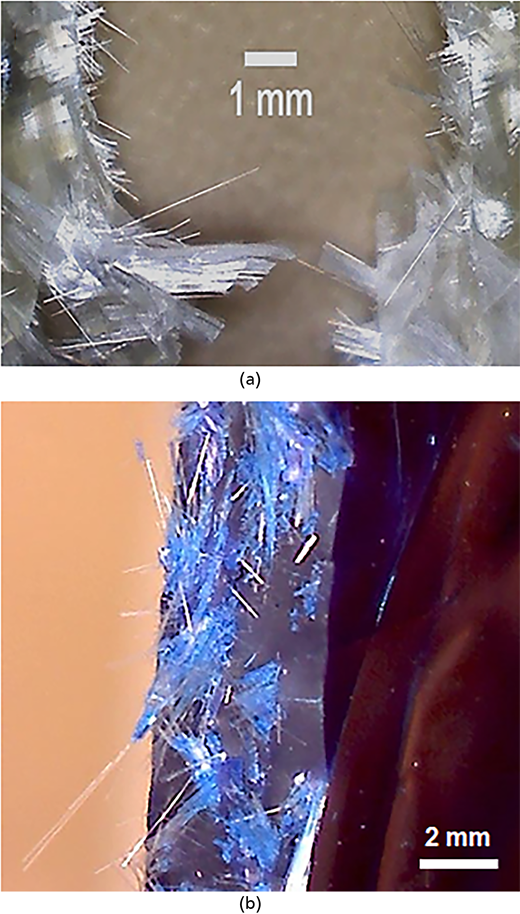
(a) Optical micrographs of fractured surface of EPON 828/glass fiber composite. In (b) a blue dye was added to the epoxy resin to enhance the image
(a) Optical micrographs of fractured surface of EPON 828/glass fiber composite. In (b) a blue dye was added to the epoxy resin to enhance the image
3.6 Mechanical relaxations
To gain more insight into the influence of carbon fiber fabrics on the mechanical reinforcement of the epoxy resin, dynamic temperature ramps were carried out, and the results are shown in Figure 14. Figure 14(a) shows that the neat epoxy exhibits a gradual decrease of elastic modulus E′ as the temperature increased. There is a step decay of E′ at ca. 60°C and a rapid decrease of E′ above 105°C denoting two mechanical relaxations. The higher temperature relaxation is denoted α and it is associated to long range cooperative molecular motions characteristic of the glass transition.42,43 The lower temperature relaxation is denoted β and it is associated to molecular motions of the glyceryl or diphenlypropane groups.46–48 The mechanical relaxations are frequency dependent, as shown in the plot of mechanical damping tan δ =[E′′/E′], Figure 15(a).
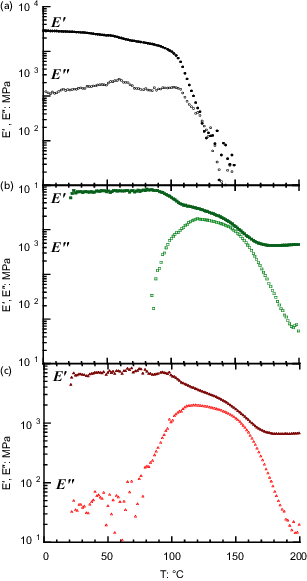
Flexural moduli E’, E” as a function of temperature of (a) neat EPON 828, (b) EPON 828/twill carbon fabric composite, and (c) EPON 828/4HS carbon fabric composite
Flexural moduli E’, E” as a function of temperature of (a) neat EPON 828, (b) EPON 828/twill carbon fabric composite, and (c) EPON 828/4HS carbon fabric composite
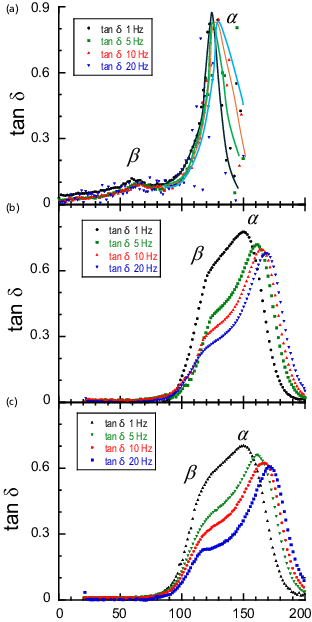
Mechanical damping tan δ as a function of temperature of (a) neat EPON 828, (b) EPON 828/twill carbon fiber composite, and (c) EPON 828/4HS carbon fiber composite
Mechanical damping tan δ as a function of temperature of (a) neat EPON 828, (b) EPON 828/twill carbon fiber composite, and (c) EPON 828/4HS carbon fiber composite
The temperature dependence of the mechanical moduli of the Epon/twill composite is shown in Figure 14(b). The elastic modulus E′ remained nearly constant up to ca. 90°C. That is, the β relaxation at ca. 60°C of the neat epoxy was shifted upward some 30°C. This result is consistent with the DSC results discussed in section 3.3. The pronounced stiffness of the composite means that the viscous modulus E′′ was negligible in this temperature range. Above 90°C, the modulus E′ exhibits two decays associated to molecular relaxations. The relaxations are shown by the maxima in the plot tan δ against temperature (Figure 15(b)). The elastic modulus of the composite finally reached a rubber plateau above 170°C. This is the rubber-like regime42 and this composite exhibited a rubber modulus of 450 MPa.
Figure 14(c) shows that the epoxy/4HS composite also exhibited an initial constant elastic modulus. However, upon increasing the temperature, the onset of the β relaxation occurred at ca. 100°C. Increasing the temperature E′ started to decrease and E′ eventually reached the rubber-like regime, with modulus of 650 MPa. The rubber modulus remained constant up to 200°C. The corresponding plot of tan δ against temperature of Figure 15(c) shows two maxima associated to the α and β mechanical relaxations.
The increase of rubber modulus indicates a decrease of average molecular weight between cross-link points Me (or increase of cross-link density).42,43 That is, Me for the Epon/twill composite is 400 g/mol, and this is reduced to 280 g/mol for the Epon/4HS composite, indicating a tighter molecular network in the latter.
It is also noted from Figure 15 the decrease of magnitude of the damping tan δ in the composites. The Epon/4HS composite exhibits the smaller damping (at each frequency), denoting limited molecular mobility (higher stiffness) in this temperature range.42 Furthermore, from the peak temperature of tan δ, at each frequency, the corresponding Arrhenius plots were built. Then, the activation energy Ea of each relaxation, α and β, was determined and the results are shown in Figure 16. The apparent activation energy of the relaxations is determined by the slope in the Arrhenius plot; hence, the error in activation energy was determined by the statistics of the linear relationship. The slope error was determined using OriginPro2020.
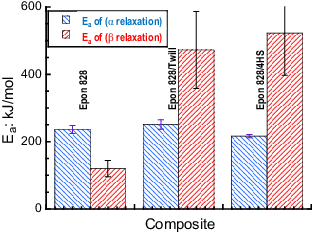
Activation energy of α and β relaxations of neat EPON 828, EPON 828/twill carbon fabric composite, and EPON 828/4HS carbon fabric composite
Activation energy of α and β relaxations of neat EPON 828, EPON 828/twill carbon fabric composite, and EPON 828/4HS carbon fabric composite
These results showed no statistical change of activation energy Ea of the α relaxation for the composites. That is, the energy to activate the cooperative long range molecular motions in the composites did not change relative to the neat epoxy. Interestingly, the Ea of the β relaxation had a significant increase for both composites. Furthermore, the Ea of the composites was statistically the same. These results suggest that the carbon fiber limited the local molecular mobility of the molecular networks,42,43 regardless of the sort of knitting. Hence, the reduced viscous dissipation and increased Ea of the β relaxation may explain the increased mechanical and thermal properties induced by the carbon fiber fabrics.
Finally, the long-term stability of the composites, particularly under cyclic loading or environmental stress, and how these factors might affect the thermal and mechanical properties over time are currently being studied and the results will be reported in a future publication.
4. Conclusions
High-performance composites were fabricated by embedding a single layer of twill 2/2 or 4HS carbon fiber fabrics, respectively, in EPON 828 epoxy resin and cross-linking with DDM. Relative to the neat epoxy, the carbon fiber fabrics (a) increased up to 60 K the glass transition temperature, Tg, and (b) increased the thermal decomposition temperature Tdec up to 67 K. The 4HS fabric induced the largest increment of thermal properties. Furthermore, the as-prepared epoxy/carbon fiber composites exhibited enhanced and anisotropic mechanical properties. The twill fabric induced a fourfold increase of tensile modulus and twofold increase of flexural modulus. The 4HS fabric increased the flexural modulus by twofold but had little influence on the tensile modulus. That is, no multilayering of fabrics nor prolonged thermal treatment of the fibers was required to achieve enhanced mechanical properties, in contrast with other reports.28–31 Furthermore, DMA showed increased cross-link density and reduced viscous dissipation in the composites. The β relaxation was shifted to higher temperatures and its activation energy was increased. These suggest that the carbon fiber limited the mobility of internal and side chain groups of the epoxy network. Finally, the facile, easily scalable, and low-cost fabrication process make these composites attractive alternatives for structurally demanding applications.

