
As is known to all, full-transverse ventilation is a good choice in the underground traffic link tunnel (UTLT). However, there is little basic research on it. When the length of the UTLT tunnel is greater than 5.2 m, the length of the smoke layer no longer follows an exponential law along with the characteristic parameter of the ratio of the cubic root of a dimensionless fire source to the dimensionless exhaust volume but still follows an exponential law with the characteristic parameter of Ri. The supplementary air is studied to determine whether the supplementary air has an impact on the spread length of the smoke layer and explores whether it can favour the distribution of the smoke layer spread. The correlation is determined between the smoke spread length and air supply, which is removed from the common divisor of air exhaust quantity through dimensional analysis. And its feasibility was verified using simulated data. This provides a preliminary impression basis for tunnel ventilation.
Notation
air specific heat capacity (kJ/(kg⋅K))
ratio of the sum of squares of one factor to the sum of square of errors
value determined from an F-table for a
gravitational acceleration (m/s2)
tunnel height (m)
equivalent diameter (m)
total thermal-smoke spread length (m)
dynamic pressure at the end of the air supply duct (Pa)
air exhaust rate (m3/s)
heat release rate (kW)
dimensionless fire heat release rate
temperature (K)
time (s)
dimensionless air supply rate
velocity (m/s)
ventilation thermal efficiency
ambient air density (kg/m3)
generic variable
1. Introduction
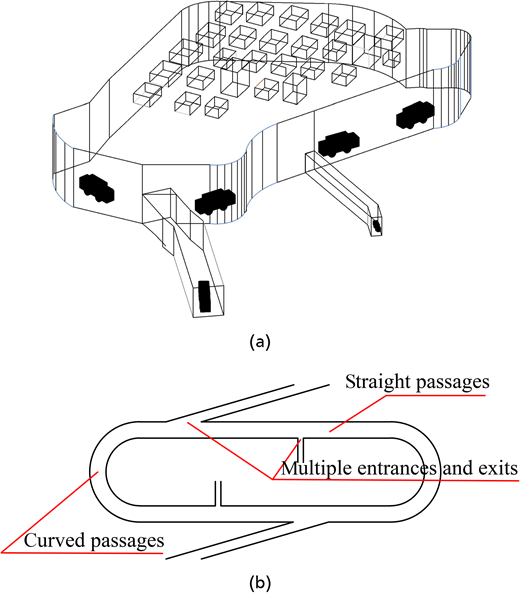
An underground traffic link tunnel (UTLT for short) is a new transit form of underground transportation, which consists of straight passages, curved passages, and multiple entrances and exits, generally built in the core areas of cities (e.g. Central business districts (CBDs)). It can effectively alleviate urban surface traffic congestion, fully utilise parking resources, and achieve the separation of people, vehicles, and dynamic and static traffic by an underground connecting passage. The schematic diagram of the UTLT for a certain city and the ideal type of simplification are shown in Figure 1, which is constituted by straight passages, curved passages, and multiple entrances and exits. More information can be found from Yan et al. (2023). However, the high volume of in and out traffic, the impact of traffic patterns, and the complexity of traffic organisation in CBD areas pose challenges to ensure the efficient operation of underground loops (Sun et al., 2024). This will inevitably pose higher requirements and greater challenges for smoke control in the event of a fire for trying not to interrupt its connection function as much as possible. The full-transverse ventilation will be a good chance because it is not easily affected by surrounding environmental factors, which have priority over natural ventilation and longitudinal ventilation. And the air supply volumetric flow rate may be a key anti-interference parameter for smoke control of transverse ventilation.
Before we begin to introduce full-transverse ventilation, some studies are introduced about combined ventilation or semi-transverse ventilation. In 2017, Tang et al. (2017) studied the buoyancy flow stratification behaviour in tunnel fires with a combination of longitudinal and semi-transverse ventilation. Research has found that the buoyant stratification pattern was divided into three types: stable (), basically stable (), and unstable (). In 2017, the spread of gases and smoke and the distribution of temperature, combined with longitudinal ventilation and pressurised air supply in the tunnels, were investigated by Xu et al. (2017). In 2019, Chaabat investigated the effects of solid barriers and blocks on the propagation of smoke within longitudinally ventilated tunnels. In 2020, Chaabat et al. (2020) investigated the influence of the shape and position of exhaust vents (relative to the tunnel axis) and solid barriers on the performance of two-point ceiling extraction systems. In 2023, Liu et al. (2023) defined the air leakage coefficient of the exhaust vent and further established a simple calculation method for the applicable limit length of a ceiling centralised smoke exhaust system through theoretical analysis and a curve fitting method.
There are a few studies on full-transverse ventilation. In 2005, Choi et al. (2005) proposed that smoke travel distance and/or smoke filling could be good criteria for determining the exhaust volumetric rate. When the location of the fire was off-centre, the propagation distance was much greater than that of a central fire of the same size. In 2006, Choi et al. (2006) proposed that with the increased volumetric rate of supply air, the mixing and falling of smoke would increase the ability to produce dangerous conditions. In 2016, Bart Merci recalled that the overpressure and underpressure caused by wind are proportional to the square of the wind speed in the book SFPE Handbook of Fire Protection Engineering. Obviously, the flow would not be completely stagnant over the entire surface, so the pressure coefficient was introduced. In 2016, Du et al. (2016) conducted experiments in a small-scale model to study the effectiveness of longitudinal and transverse ventilation on the annular UTLT. And it is the forced air supply that may not require a casual mention, due to the abundance of natural replenishment routes. In 2021, Wang et al. (2021) carried out a transverse smoke exhaust strategy experiment and simulation study about the influence of fire location and heat release rate (HRR) on smoke exhaust volume and air supply. Han et al. (2021) conducted 14 full-scale combustion tests in a UTLT. In 2022, a new type of push–pull air curtain was designed by Ji et al. (2022), and the smoke control effect was verified by carrying out a small-scale smoke control experiment in a model tunnel. The smoke control efficiency E increases with the increase of momentum ratio R between the push airflow of the curtain and incoming smoke flow. In 2022, a novel division method for the maximum lengths of smoke bays, which depends on thermal-smoke front spread length (TFSL) established from the dimensionless characteristic number Ri of mixed convection, was provided by Yan et al. (2023). In 2023, Peng et al. (2024) investigated the efficacy of the full transverse exhaust method for smoke extraction in tunnel fires. It examined factors such as the number and layout of air supply and exhaust outlets. And opening an equal number of exhaust outlets on one side of the fire source was proposed for reducing tunnel ceiling temperatures and minimising risks to personnel and structures. In 2023, the plug-holing phenomenon in the coupling effect between air curtains and ceiling centralised smoke exhaust systems was investigated by changing the parameters of the HRR, the smoke exhaust rate, and the jet velocity of the air curtains by Chen et al. (2023).
Due to few references, the writers wanted to find inspiration from natural ventilation with the gas flow of windows, doorways, or roof openings. In 1976, generalisations of Kawagoe’s expressions for the window airflow and height of the neutral plane were developed by Rockett in natural ventilation in an enclosure. In 2006, the exchange mass flow rate across the two layers was studied by Chow et al. (2006) based on earlier experimental data on atrium hot smoke tests, and a reference value of 30% for most of the tests was found for the smoke exhaust system entrainment from airflow. In 2009, a general formula for the air mass flow rate for wall doors and window vents was developed by Quintiere and Wang (2009) in natural ventilation. In addition, some hydrodynamic transportation was referred to. Bagheri et al. (2022) reported that combining both enhancing the roughness coefficient and the drop implementation effect could reduce the separation zone dimensions up to 63%. In 2021, a two-dimensional flexible mesh, depth-averaged model was set up to simulate the sand mining pit modelling in the different scenarios by Zolghadr et al. (2021). The hydrodynamic flow field was updated continuously according to the changes in bed bathymetry. In 2020, the trap efficiency of detention dams was investigated using a laboratory study by Parsaie et al. (2020). To express the mathematical relationship between dependent and independent parameters, non-linear regression and soft computing techniques, including multivariate adaptive regression splines, gene expression programming, and group method of data handling, were utilised. In 2013, the numerical modelling of three-dimensional flow on porous broad-crested weirs was simulated by Mohammadpour et al. (2013). The structured mesh was used for all domains with a high-density mesh near the solid region. In 2011, Hasan et al. (2011) located the area of pollutants by flow simulation for Lake Harapan so that the funds required for rehabilitation could be reduced. Moreover, some intelligent technology was referred to. In 2023, the feasibility of proportional integral derivative (PID)-controlled air curtains is explored, and the calculation method of PID control parameters is clarified by Yu et al. (2023).
To sum up, scholars have studied the buoyancy stratification of combined longitudinal with semi-transverse ventilation; the influence of the shape and position of the vents and the smoke barriers on the two-point smoke exhaust system; the relationship between smoke exhaust efficiency and momentum ratio of air curtains to smoke’s; thermal conversion capacity; smoke exhaust efficiency; and so on. In Liu’s study, the maximum length of the exhaust duct was determined based on fluid dynamics. In Yan’s study, the spread range of smoke was determined based on thermodynamics. The exhaust volumetric rate is needed to know to be better implement in practice by Liu’s research. Yan’s research focuses on the relationship between the spread length of smoke and Ri number within the range of the vent opening region in Liu’s research. However, as mentioned above, the air supply volumetric flow rate may be a key anti-interference parameter for smoke control of full-transverse ventilation. The forced air supply is not required due to having multiple exits of UTLTs. Smoke descends when the forced supply air spreads along the wall side, and it is easier to disturb the smoke layer from the ceiling. So, this paper first selects the tunnel height of , as the research target, which does not conform to the logarithmic law of smoke spread length found by Yan and He (2025). Whether forced air supplements will promote the smoke spread distribution law to conform to the logarithmic law or conform to a certain rule, which lays the foundation for the subsequent research on UTLT smoke control strategy for exhaust and supply, is explored.
The remainder of this paper is organised as follows. In Section 2, dimensionless theoretical analysis based on TFSL and orthogonal experimental design (OED) is presented under a transverse ventilation system. In Section 3, a full-scale experiment in UTLT is performed to validate the reliability of the proposed modelling. Section 4 discusses the smoke propagation characteristics under the full-transverse ventilated UTLT. Conclusive remarks are presented in Section 5.
2. Theoretical considerations and method
2.1 Calculation of dimensionless equations
In the early twentieth century, Buckingham proposed that every physical law can be expressed by several zero-dimensional quantities, which formed the principles for the flow of model tests and numerical simulations commonly used today. It is called the π theorem that if there are N variables in the problem and the number of basic quantities is k, then dimensionless variables of must be formed. A derivative process can refer to Yan et al. (2023). Similar to Section 2.2.2 of Yan et al., air supplement volume controlling TFSL beneath the ceiling by semi-transverse ventilation and/or transversal ventilation mode can be expressed as:
The dimensionless Equation 1 can be replaced by:
where
2.2 Orthogonal experimental design
The OED method is a multi-factor experimental method that is based on people’s production practice experience, relevant professional knowledge, probability theory, and mathematical statistics (Birnbaum, 1970; Edwards, 1969; Fisher, 1956; Fisher and Yates, 1990; I, 1936; Seidenfeld, 1992). It uses the principles of balanced distribution and uniform comparability with compiled standardised tables (i.e. orthogonal tables) (Taguchi et al., 2004) to scientifically arrange experimental plans, to calculate and analyse experimental results, and quickly find optimised plans. That is to say, the OED is a design method making use of an orthogonal table to arrange trials for different levels of multi-factor, and so as to analyse the results of the trials for making a decision. The orthogonality of orthogonal tables is the actual mathematical embodiment of equilibrium distribution. Its expression is as follows: in any column, each selected level of every variable makes an appearance, and the number of occurrences is equal; any combination of different levels between any two columns occurs with equal frequency. It first began in agricultural experiments and is currently widely used in various fields of industry, agriculture, and science and technology.
An orthogonal table is composed of n characters of matrix, denoted as , which represents n rows and m columns, with only r different characters in each column. When the total number of different characters in each column is different, a more general orthogonal table symbol is . Common orthogonal tables include two-level tables , three-level tables , four-level tables , five-level tables (e.g. , seven-level tables (e.g. , eight-level tables , mixed-level table , and so on. The orthogonal table is used in this article presented in the appendix table. The orthogonal table based on the number of factors, level of factors, and whether there is interaction in the experiment can be searched for correspondingly. Then, relying on the orthogonality of the orthogonal table, representative points can be selected from the comprehensive experiment for experimentation. This can achieve equivalent results to a large number of comprehensive experiments with the least number of experiments. It is because all selected levels of any column make an appearance so that the representative part of tests contains all levels of all factors. All combinations of selected levels between any two columns are out so that it is fully tested between any levels of two factors. The application of orthogonal table design in experiments is an efficient, fast, and economical multi-factor experimental design method. Because in these trials, all levels of all factors and all combinations between the two factors are not missing. The steps of experimental design include (a) identify and propose problems; (b) clarify the experimental indicators; (c) the selection of factors and levels; (d) choose an orthogonal table; (e) top design; (f) list the experimental plan; (g) conduct experiments; (h) data analysis; and (i) conclusion and recommendations.
3. Numerical frameworks
3.1 Fire dynamics simulator
Fire dynamics simulator, a CFD tool specifically designed with a large-eddy-simulation framework for low-speed and thermal-driven flows, has been commonly used in the investigation of fire. The software is based on the basic control equations of fluid dynamics, which are the three laws of fluid mechanics: the continuity equation (or component mass conservation equation), the momentum equation, and the energy equation. When using the Euler method or the Lagrangian method for mathematical description, it is not difficult to find that the equations have a formal similarity due to the existence of generalised conservation principles. The motion equation of Newtonian fluid in fire smoke can be expressed as the following general formula (Mcgrattan et al., 2013; Fang et al., 2021; Tu et al., 2024):
where is a generic variable; is the source term; ΓΦ is the generalised diffusion coefficient; and are the airflow density and velocity, respectively. The software is based on the basic control equations of fluid dynamics, which are the three laws of fluid mechanics: the continuity equation (or component mass conservation equation), the momentum equation, and the energy equation. When using the Euler method or the Lagrangian method for mathematical description, it is not difficult to find that the equations have a formal similarity due to the existence of generalised conservation principles. More information about numerical simulation can also refer Bagheri et al. (2022) and Chabokpour et al. (2024).
3.2 Fire scenario analysis
3.2.1 OED for semi-transverse ventilation systems
From Yan et al. (2023) simulation results, the TFSL above 5 m may not follow the exponential rule classically. Further study is conducted. Through the analysis of variance, the factors of engineering significance are the HRR, smoke exhaust rate, tunnel height, and smoke exhaust outlet spacing (Yan and He, 2025). To save calculation time, short tunnels of 720 m acrossing to the results of Yan and He with combined grids and vents at intervals of 44 m are modelled by uniform ventilation for an exploratory experiment of developing changing regular of mechanical air makeup. The orthogonal table (Montgomery, 1998) with four factors and three levels were selected. Three levels, that is, 5.2, 5.6, and 6 m, of tunnel heights are selected, with an attempt to find the design and reference values of the required air volume rates that vary with the height of the UTLTs. Here only taking the HRR, the exhaust rate, and the tunnel height into account. The orthogonal experimental plan is shown in Table 1. A tunnel width of 10 m and a square vent side of 1.2 m were constructed. Three levels of the HRR and exhaust rate (i.e. 3, 11.5, and 20 MW for fire and 3.6, 6.8, and 10 for the ventilation system) were chosen. Temperature measurement points at 1 m intervals along the longitudinal central axis beneath the tunnel ceiling of 0.2 m and the 20 m spaced flow measurement slices of the tunnel cross-section along the longitudinal central axis were set up.
Orthogonal experimental design and exploration of TFSL and air-makeup volumetric rate with the variable tunnel height
| No. | A | B | C | E | Index | |
|---|---|---|---|---|---|---|
| Exhaust rate: | HRR | Vent longitudinal separation: | TFSL: | Thermal efficiency | ||
| 1 | 5.2 | 3.6 | 3 | 44 | 359 | — |
| 2 | 5.2 | 6.8 | 11.5 | 44 | 464 | — |
| 3 | 5.2 | 10 | 20 | 44 | 445 | — |
| 4 | 5.6 | 3.6 | 11.5 | 44 | 628 | — |
| 5 | 5.6 | 6.8 | 20 | 44 | 575 | — |
| 6 | 5.6 | 10 | 3 | 44 | 255 | — |
| 7 | 6 | 3.6 | 20 | 44 | 787 | — |
| 8 | 6 | 6.8 | 3 | 44 | 294 | — |
| 9 | 6 | 10 | 11.5 | 44 | 432 | — |
3.2.2 OED for full-transverse ventilation systems
The parameter configuration of the tunnels and ventilation for modelling is the same as in Section 3.2.1, except two tuyeres of 6 m (length) × 0.8 m (height) are symmetrically added aside, and the centre points of the two rectangular air vents are separately 30 m away from one nearest tunnel exit. The specific information and the air volumetric supplementary are shown in Table 2.
Orthogonal experimental design and law exploration of air-makeup volumetric rate with the variable UTLT height
| No. | Tunnel height: m | HRR: MW | Exhaust rate (: | Supply rate (: | TFSL: m |
|---|---|---|---|---|---|
| S1 | 5.2 | 3 | 3.6 | 20.66 | 360 |
| S2 | 5.2 | 11.5 | 6.8 | 31.5 | 456 |
| S3 | 5.2 | 20 | 10 | 44.4 | 440 |
| S4 | 5.6 | 11.5 | 3.6 | 22.3 | 614 |
| S5 | 5.6 | 20 | 6.8 | 34.5 | 578 |
| S6 | 5.6 | 3 | 10 | 32.383 | 250 |
| S7 | 6 | 20 | 3.6 | 26.43 | 761 |
| S8 | 6 | 3 | 6.8 | 28.614 | 291 |
| S9 | 6 | 11.5 | 10 | 44.7051 | 434 |
3.2.3 Sensitivity study on the grid system
3.2.3.1 Sensitivity analysis with air supplement
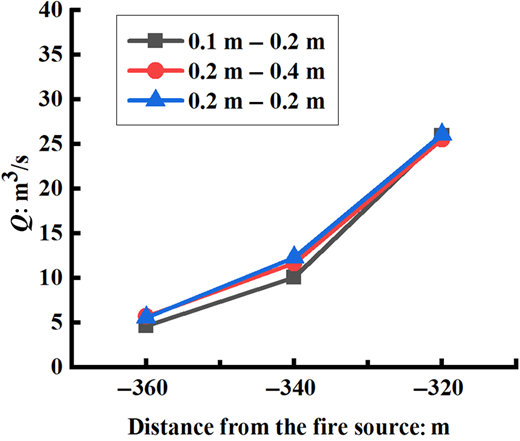
In this study, three combined mesh systems (mesh size was 0.1 m combined 0.2 m, 0.2 m combined 0.2 m, and 0.2 m combined 0.4 m) were adopted in the mesh independent analysis (as shown in Figure 1). It can be seen from Figure 2 that the volumetric inflow profiles under the tunnel ceiling at (a) the vicinity of the fire source and (b) the smoke exhaust outlet near the tunnel entrance and air intake exhibit insignificant discrepancy between the 0.1 m combined 0.2 m and 0.2 m combined 0.4 m grid system. The time-consuming simulation is calculated by a workstation with 2 CPUs of 2.6 GHz, 24 total CPU threads under hyper-threading technology, and 48 GB RAM. Through the mesh independent test, the mesh system consisting of 0.2 m × 0.2 m × 0.2 m elements combined 0.4 m, 0.4 m was applied to discretise the computational domain to balance the numerical accuracy and computational cost.
3.2.4 Validation of modelling
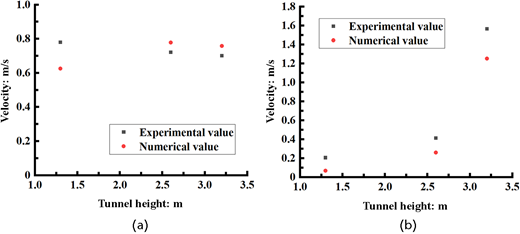
To validate the ability of numerical models, the predicted air supplement volumetric inflow rate from the entrance was first compared with the experimental measurement carried out by Han et al. (2021) in a long UTLT. In Han et al.’s experiment, four speed-detection trees were applied in the passageway to measure smoke velocity, and sets of velocity probes were positioned at −65 m and −45 m on the left side from the fire source and +67 m and +103 m on the right side from the fire source. Because velocity would fluctuate rigorously in the transient fire simulation, the predicted velocity profile, including the majority of quasi-steady smoke movement time, was time-averaged in the validation analysis. One test section was 480 m in the curved section, with each smoke zone 120 m, and a total of 600 m in its vicinity. The slope is an average of 3.6%. It has two curved passages. One is about 166 m with a rough rotation angle of 105° relative to the horizontal X-axis, and the other is roughly 42 m with an approximate rotation angle of 55° deviated from the original direction. The remaining passageways are simplified as straight ones. The HRR was about 4 MW, and smoke zone A and smoke zone D had the air supplement at 50% of the smoke exhaust volume. Smoke zone B and smoke zone C were equipped with an extraction rate of 18.4 and 24.93 m3/s, respectively (Yan et al., 2023). As shown in Figure 3, the predicted velocity far from the fire source and smoke reasonably agreed with the experimental measurement (e.g. velocity tree in the −65 m from the fire source). Meanwhile, the speed in the region covered with smoke was overpredicted or underestimated by around 12.5%. The following reasons could contribute to this deviation. First, the smoke speed distribution in the near-field region was dominated by smoke convection and radiation. The smoke propagation vortex is also affected at a fixed point for speed as well as speed measurement. The radiation in the nearfield is overpredicted, and the temperature is higher, resulting in the predicted smoke speed being higher. Moreover, under the assumption of a simple one-step irreversible process for simplified combustion, the smoke generation rate could be overpredicted when the HRR is large in full-scale fire simulation. Consequently, the far-field region could be heated up by over-generated smoke, and the velocity could be overpredicted. So, in the near field, the temperature of the cross-section is overpredicted because of the radiation, and in the far field, due to mass conservation, the velocity of the lower level of tunnel height is underpredicted in the smoke intrusion area.
Comparison between the temperature distribution data in Han’s experiments and that measured in the simulation modelling method in this paper
Comparison between the temperature distribution data in Han’s experiments and that measured in the simulation modelling method in this paper
4. Results and discussion
4.1 Phenomenon analysis
4.1.1 Phenomenon analysis of air inflow induced by semi-transverse ventilation system
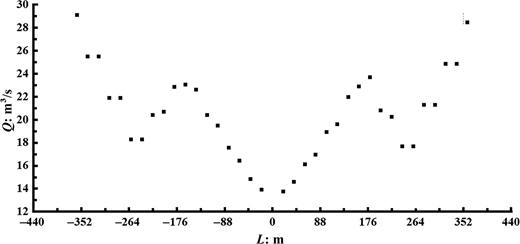
Figure 4 shows the air-makeup volumetric rate towards the fire source in lengthwise different x-coordinates. The scale division (marked visible scale value) of the x-axis displays the position of the exhaust outlet in the tunnel ceiling. The coordinates of the triangle legend show the natural supplementary air volumetric rate from measurement slices located at −360, −340, −320, −300, −280, −260, −240, −220, −200, −180, −160, −140, −120, −100, −80, −60, −40, −20 m, and so on along the positive x-axis. Moreover, it is determined that the single-sided SFSL is 178 m based on the analysis of simulation results in working condition 1, shown in Figure 5. From Figure 4, it can be seen that between −360 and −240 m (), the airflow entering the tunnel from the tunnel opening tracked by the slice monitor decreases at a volumetric flow rate of 3.6 m3/s after passing through each of the exhaust outlets. Within the following range of 60 m (i.e. ), the airflow directed to the fire source does not decrease at an exhaust rate of 3.6 m3/s over each exhaust port but instead increases. There is no heat convection of smoke flowing through this zone, indicating that there is a backflow of diffused smoke along the smoke layer inference. With the lower density of smoke for higher temperatures compared with air, the volumetric flow rate increases. Please note that air makeup is already required here for logical reason of generating greater pressure to prevent the disorder of the smoke layer. In addition, in a zone for the near field of the fire source, the large amount of generated smoke occupies the adjacent space and upper volume and then causes the upper air to compress and flow towards the tunnel entrance quickly. In summary, within the range of −240 to 0 m and 0 to 240 m of the tunnel, smoke forms two relatively closed-cycle systems. The supplementary air volumetric rate is within m3/s, and the data show 20.66 m3/s. And yet between −360 and −240 m, a small open balance system has also been established between the tunnel entrance, exhaust outlet, and the cross-section at a contact point between the smoke diffusion front and the air layer. As shown in Figure 4, the situation of the positive half L-axis is symmetrical and can be analysed analogically.
Distribution of supplementary air volumetric rate towards the fire source at intervals of 20 m under the plateau of smoke spread by semi-transverse ventilation in working condition 1
Distribution of supplementary air volumetric rate towards the fire source at intervals of 20 m under the plateau of smoke spread by semi-transverse ventilation in working condition 1
Extracting velocity vectors to verify the correctness of the flow field qualitative analysis. Limited by image pixels, a part of the open balance zone of is chosen in the opening and near the vent, shown in Figure 6. Fresh airflow in the cross-section is all pointed to the fire source direction except for the vent suction. On the contrary, there is a backflow of diffused smoke in 215 m observed in Figure 7. These velocity vector fields verify the correctness of the analysis of Figure 4 in the preceding paragraph. From Figure 8, a velocity of 0 m/s is observed in u-velocity in the thermal-smoke front; the result is the same as Yan et al. (2023). The same analysis logic can be applied to cases 2–9. Figure 9 shows the plateau distribution of supplementary air volumetric rate towards the fire source at intervals of 20 m by semi-transverse ventilation in all working conditions.
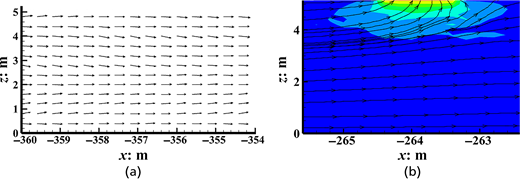
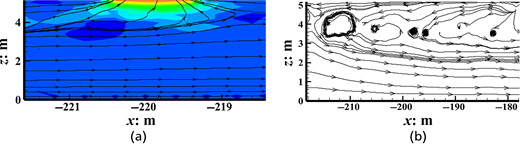
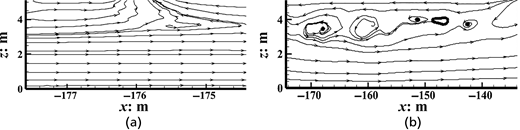
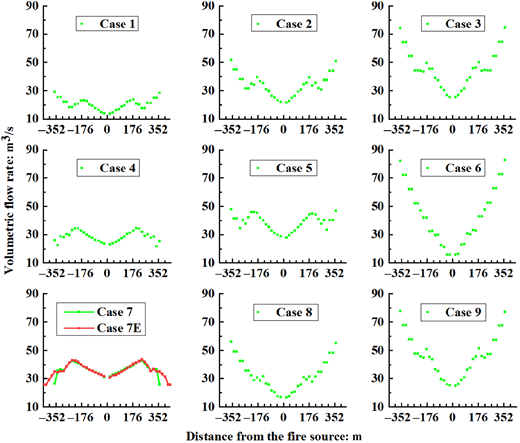
Volumetric flow rate of gas from opening to fire source measured at intervals of 20 m in different working conditions of semi-transverse ventilation
Volumetric flow rate of gas from opening to fire source measured at intervals of 20 m in different working conditions of semi-transverse ventilation
4.1.2 Phenomenon analysis of smoke layer height by semi-transverse and full-transverse ventilation systems
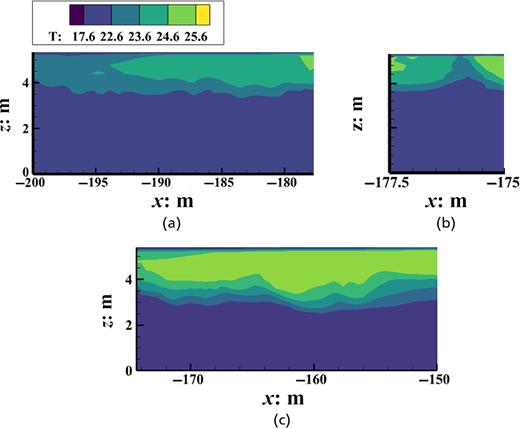
Figure 10 describes the smoke layer height, respectively, in nine typical working conditions of semi-transverse ventilation and of full-transverse ventilation, which supplies air away from the vehicle exits 30 m. From Figure 10, it is concluded that the air supply can maintain or lower the smoke layer height in the far field. In areas with high buoyancy near the fire source, supplementary air has little effect on the height of the smoke layer. Comparing the first and second rows of Figure 10, it can be seen that supplementing air further away from the smoke front is beneficial for maintaining or increasing the minimum height of the smoke layer. According to working condition 7 in Figure 10, when the smoke is controlled inside the tunnel, natural ventilation is more conducive to maintaining a higher smoke layer throughout the tunnel. Mechanical ventilation can make the lowest point far from the fire source location, but it cannot significantly increase the minimum height of the smoke layer. The front of the hot flue gas becomes shorter due to the decrease in height of the supplementary air flue gas layer. Even if the tunnel height of nine working conditions (case 9) is higher (), there are still smoke layers that are lower than the tunnel height of 2 m. At this time, it is necessary to add measures such as smoke-blocking vertical walls to lift the height of the smoke layer, which can prevent the global smoke layer height from decreasing.
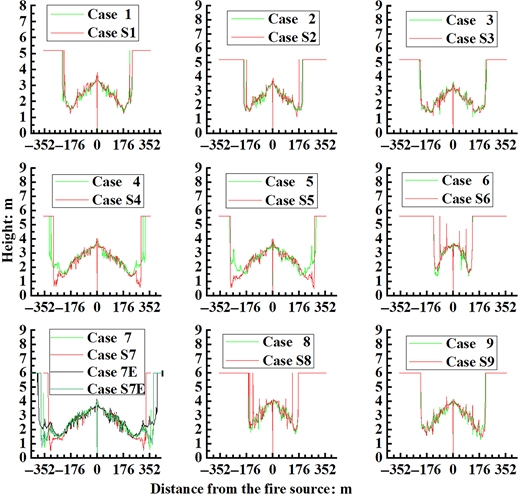
Minimum smoke layer height in different working conditions of semi-transverse and full-transverse ventilation
Minimum smoke layer height in different working conditions of semi-transverse and full-transverse ventilation
4.2 Thermal-smoke front spread length beneath the ceiling
The TFSL is identified by , according to the Yan et al. (2023) results and the above validation analysis. Figure 11 describes the correlation between the impact factors of HRR and exhaust rate and TFSL in semi-transverse ventilation between tunnel heights from 5.2 to 6 m.
![Correlation between (Q˙fuel*)1/3/V* [and Ri =Q˙fuel*/(V*)1/2] and dimensional thermal-smoke front spread length L/H¯ Refer to the image caption for details.](https://emer.silverchair-cdn.com/emer/content_public/journal/jencm/178/3/10.1680_jencm.24.00073/1/m_jencm.24.00073-f11.png?Expires=1782066011&Signature=vG1lmTyF2cgUCEX5lqF-s-1zHMtW~Nt6BMv~xSI-tVw5ikxIEzkZxo57Fx2MjX1~IvLJ8AzyE6NFbQOH5eFYYgsDvz30V3hiDZp43Oc4LyWJdUl1QV1u3gNbhf4ArHTPt-POPk4qCRAJD-VIjgVtX2Mmokkx9ZDmUqDvqa6jGhyvEM7oayLhRSsblZGZIM6T8640CzRSv-MMY0kzRQHJgEqfOvW2ABGgG81nxPY6TMZr4JR94Zy09JKlnKOHCKEy~gObNsoCCw94sW5QtZOVHFUjzePmN1b7UplMZy39zc9dyuFwz6J7ItxKQteWYtRmLMcrAl6ztjM1~xb88xSwsA__&Key-Pair-Id=APKAIE5G5CRDK6RD3PGA)
Figure 12 describes the correlation between the impact factors of HRR and exhaust rate and TFSL in full-transverse ventilation between tunnel heights 5.2 m and 6 m. The dimensionless TFSL (L/H) varies logarithmically with the ratio of dimensionless HRRs (Q*) and dimensionless supply volumetric flow (U*). Moreover, the tunnel height is influential on the air supply rate, for the squared R of all nine data is 0.8 and less than 0.85, which is not shown in Figure 11. Comparing Figures 10 and 11, it can be seen that the smoke spread distance increases or decreases by less than 30 m. It indicates that air supplements can adjust the flow law of smoke invasion by interfering with the height of the smoke layer. It can be seen from the data that the spread length of the smoke layer after air supplement conforms to a certain law, and the exhaust and air supplement scheme can be comprehensively given according to the demand by calculation. The limitation of this paper is that there is no smoke exhaust volumetric rate, and the influencing factors of the smoke layer are not included. But as a preliminary exploration, it has laid a clear foundation for more detailed research later.
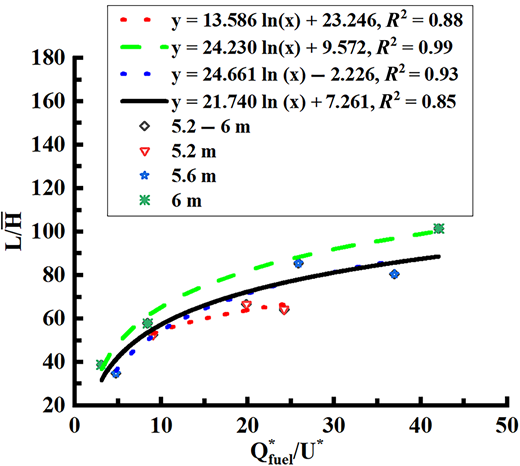
Correlation between the dimensionless ratio of HRR to the rate of supplementary air and dimensional thermal-smoke front spread length
Correlation between the dimensionless ratio of HRR to the rate of supplementary air and dimensional thermal-smoke front spread length
4.3 Analysis of the ventilation thermal efficiency
In a smoke exhaust system, if the maximum temperature is decreased, we judge that the system is effective. From Table 3, we find that most cases are efficacious. It is an inference that when the exhaust rate is lower than the smoke generation rate (e.g. working conditions 4, 7, S7), it may result in a large temperature rise as well as result from air makeup. Therefore, the smoke exhaust volumetric rate should be greater than the smoke production volumetric rate, as the most basic smoke exhaust strategy to control the smoke flow.
Exploration of thermal removal efficiency under different boundary conditions with semi-transverse and full-transverse ventilation systems
| No. | Tunnelheight: m | HRR:MW | Exhaustrate | Natural supplyrate: | Cyclicspace: m | SFTL: m | Forced supply rate equal to minimum semi-transverse natural:air-makeup rate | ||
|---|---|---|---|---|---|---|---|---|---|
| 1 | 5.2 | 3 | 3.6 | 18–24 | 359 | 0 | 0.825 | 0.175 | |
| 2 | 5.2 | 11.5 | 6.8 | 31.5 | 464 | 0 | 0.955 | 0.045 | |
| 3 | 5.2 | 20 | 10 | 44.4 | 445 | 0 | 0.944 | 0.056 | |
| 4 | 5.6 | 11.5 | 3.6 | 22.3 | 628 | 0 | 1.006 | −0.006 | |
| 5 | 5.6 | 20 | 6.8 | 34.5 | 575 | 0 | 0.974 | 0.026 | |
| 6 | 5.6 | 3 | 10 | 32.383 | 255 | 0 | 0.656 | 0.344 | |
| 7 | 6 | 20 | 3.6 | 26.43 | NULL | 787 | 0 | 1.012 | −0.012 |
| 8 | 6 | 3 | 6.8 | 25–35 | 294 | 0 | 0.773 | 0.227 | |
| 9 | 6 | 11.5 | 10 | 44–51 | 432 | 0 | 0.880 | 0.12 | |
| S1 | 5.2 | 3 | 3.6 | — | — | 360 | 20.66 | 0.8274 | 0.1726 |
| S2 | 5.2 | 11.5 | 6.8 | — | — | 456 | 31.5 | 0.9622 | 0.0378 |
| S3 | 5.2 | 20 | 10 | — | — | 440 | 44.4 | 0.9437 | 0.0563 |
| S4 | 5.6 | 11.5 | 3.6 | — | — | 614 | 22.3 | 0.9979 | 0.0021 |
| S5 | 5.6 | 20 | 6.8 | — | — | 578 | 34.5 | 0.951 | 0.049 |
| S6 | 5.6 | 3 | 10 | — | — | 250 | 32.383 | 0.663 | 0.337 |
| S7 | 6 | 20 | 3.6 | — | — | 761 | 26.43 | 1.014 | −0.014 |
| S8 | 6 | 3 | 6.8 | — | — | 291 | 28.614 | 0.769 | 0.231 |
| S9 | 6 | 11.5 | 10 | — | — | 434 | 44.7051 | 0.867 | 0.133 |
Table 4 presents the analysis of variance for the transverse ventilation used UTLTs by OED ANOVA. Calculate the sum of squares of their average deviations and compare them with the F-standard value (Ramsay and Silverman, 2006) (i.e. the value determined from an F-table for a given statistical level of significance based on the significance level and the degree of freedom (df )) to identify the factors that have a decisive impact on the experimental data (i.e. significant or highly significant factors) as the basis for quantitative analysis and judgement. The results reveal that the makeup air, which is determined by the method in this paper, has no obvious effect on heat removal efficiency. More calculations can refer to Yan and He (2025).
5. Conclusions
In this study, a series of full-scale tunnel fire simulations and dimensional analyses were conducted to investigate the smoke front spread length and thermal efficiency of the full-transverse system. The HRR, air supply volumetric flow rate, and tunnel height were considered in the simulation. The major innovation and findings are summarised as follows:
Assuming that the smoke layer is not penetrated by the induced wind of smoke exhaust outlets and the smoke layer remains stable, a theoretical model of the air supply volumetric flow rate for the length of smoke spread suitable for UTLTs has been developed. The existence of identification points of smoke spread length in UTLTs is verified in the ceiling extraction tunnels with a uniform exhaust flow rate.
The logarithmic correlation for the smoke spread length of fixed vent spacing (e.g. 44 m) upstream with the characteristic number of is obtained. The smoke-front spread length shows an increasing tendency as increases in the multi-point transverse ventilation of UTLTs. When the tunnel height is increased, the smoke-front spread length shows an increasing tendency as the tunnel height increases under transverse ventilation.
When the HRR is large and the exhaust volumetric flow rate is small, TFSL can be controlled but with ventilation thermal efficiency η is slightly 1.
The supply air, which is determined through the method of this paper, has little effect on the thermal efficiency.
The correlations and conclusions enhance the basic understanding of smoke control by full-transverse ventilation systems in tunnels. These are applicable in passive fire protection design in tunnels during operation and are helpful in the preliminary design for an architect. This study has practical applications and guidelines for designing safer UTLTs and clear recommendations for future studies that could build upon the findings. However, more work is still needed to provide a comprehensive design strategy; the same as the layout of air inlets still needs to be further explored.
CRediT authorship contribution statement
Xiaojun Yan: conceptualisation, methodology, software, validation, formal analysis, investigation, software, data curation, visualisation, resources, writing—original draft, writing—review and editing. Xu Li: writing—review and editing. Qingwen He, methodology. Xiang Fang: data curation, writing—review and editing.
