

The purpose of this research work was to evaluate the Benzene, toluene, ethylbenzene and xylene (BTEX) emissions from a Bamroli sewage-treatment plant (STP) in Surat City, India. Tiger handheld gas detector was utilised to measure emissions of BTEX during three periods of monitoring, and sewage samples were collected to determine the characteristics of sewage. The spatial variation of BTEX was determined at various treatment units of the STP during the months of November and April and represented as interpolation maps using ArcGIS. Box charts were plotted to represent the temporal variation of BTEX, which categorise the resultant data on the basis of their frequency. It has been noticed from the interpolation maps that the concentration of BTEX decreases as sewage travels from the inlet to subsequent units. Approximately 50% of all readings obtained of BTEX concentration fall within 0.5 parts per million, which exceeds the limits stipulated by the National Ambient Air Quality Standards, 5 μg/m3 for benzene. It can be concluded that more vent pipes have to be provided for the dispersion of these compounds in transmission lines. Also, some safety aids such as face masks have to be utilised by labourers who are continuously subjected to these compounds.
Introduction
The study of gaseous emission, climate change and air pollution involves physico-chemical identification, inventories, measurement and assessment methods and the quantitative study of actual anthropogenic sources and their direct contributions. Anthropogenic activities that cause gaseous emissions include emissions from waste water discharges, sewage collection and transportation, waste-water-treatment plants (WWTPs) and associated activities.
Volatile organic compounds (VOCs) are organic chemicals that have a low boiling point due to their high vapour pressure at normal room temperature. This results in the formation of a large number of molecules evaporating from the liquid or solid form of the compound and escaping into the atmosphere.
Domestic waste water contains traces of various household products such as personal hygiene compounds, cleaning compounds, solvents, disinfectants, mothballs, automotive supplies, lawn and garden products, waste paint, laundry products, photographic chemicals, and medicines. Reactions of biochemical type take place under microaerobic and anaerobic conditions during the sewage transportation process. This causes the formation and subsequent release of a wide variety of VOCs from sewer networks, which are consequently a potential source of VOC emissions. The formation of VOCs in sewer gas environments, even at trace concentrations, can be toxic and cause corrosion and result in odour annoyance due to the low odour threshold values for many of these compounds. WWTPs have become an increasingly important source due to their health impacts on local workers and residents living in the vicinity of the sites. While waste water undergoes up to three levels of treatment before it is discharged, VOCs in the waste water are emitted to the atmosphere by volatilisation during the treatment process.
Several studies have investigated air contaminants associated with sewage treatment. For instance, Widiana et al. (2017) identified the presence of VOCs and other prominent gaseous pollutants such as carbon monoxide (CO), carbon dioxide (CO2), ammonia (NH3), hydrogen sulfide (H2S), PM1, PM2.5, PM7, PM10 and total suspended particles in a municipal WWTP in North Taiwan. Lourens et al. (2011) investigated the spatial and temporal distributions of benzene, toluene, ethylbenzene and xylene (BTEX) in South Africa for a year and observed higher concentrations of nitrogen dioxide (NO2), sulfur dioxide (SO2) and BTEX. No distinct trend was observed by them for BTEX. The obtained annual average concentrations for benzene were below the South African annual standards at the defined study locations. Chen et al. (2010) experimented to investigate the factors influencing the volatilisation of BTEX. Ntlatleng (2009) carried out an assessment to estimate the volatilisation rate of VOCs (specifically BTEX) from a sewage-treatment plant in South Africa. This study showed that toluene and ethylbenzene have the highest volatilisation rate compared with benzene and o-xylene. Oskouie et al. (2008) exerted efforts to predict the total VOC emissions from WWTPs. They assessed that the specific VOCs emission rate could be predicted by having information on ambient temperature, mixed liquor suspended solids and VOC concentration in the liquid phase at the influent to the specific plant.
Wu et al. (2006) monitored VOCs from the various units of a WWTP in the vicinity of an industrial park in Taiwan. Based on 24 h semi-continuous monitoring data, the total VOC concentration was an average of 93 parts per billion (ppb) by volume (acetone contributed 78%), with a dramatic variation during the day and night; an online monitoring and alerting system can be built for obtaining long-term information.
Cheng et al. (2008) evaluated VOC emission characteristics from WWTPs in five Taiwanese industrial districts. They found that acetone, chloroform and toluene were the main aqueous VOCs and were solely related to the manufacturing processes of industrial plants. Based on this research work, the authors recommended unit covers with a venting, incinerating and heat-recovery system.
Efforts were made to evaluate the BTEX emissions from a Bamroli sewage-treatment plant (STP) in Surat City, India. Research shows that trace concentration of BTEX was obtained from vent pipes of sewers and from sewage pumping stations (Samnani, 2016). Hence, it was expected to obtain BTEX concentrations from various units of the STP. This study reveals the health hazards to employees or workers exposed to various units of STP.
Methodology
Study location
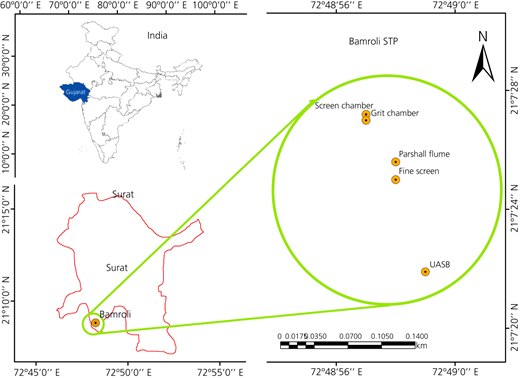
Surat is a vast city with a total area of 326.515 km2. The population of the city is 44 66 826 people as per the 2011 census. The master plan of sewerage systems (sewers and sewage-treatment works) has been prepared by Surat Municipal Corporation, in which attention is given not only to domestic and commercial industries but also to industrial development by 2021. Among nine available STPs in Surat City, a Bamroli STP has been selected as the study location (Figure 1). A Bamroli STP of 100 million litres per day (MLD) capacity was commissioned in 2002. This STP is mainly designed to treat domestic waste water, and variation is observed in the characteristics of sewage due to illegal connections of industries. The plant receives sewage from sewage pumping stations through sewer lines, and the flow is distributed to various primary treatment units through the inlet and distribution channels. The treatment process starts with the screening of large and floatable objects and removal of sand, silt and grease in the grit chamber. The flow of sewage is measured by a Parshall flume before it enters the fine-screen chamber. Very fine particles are removed through the fine-screen chamber, and the flow of sewage is maintained in equalisation tanks and then fed to secondary treatment. Anaerobic treatment is given to sewage through up flow anaerobic sludge blanket or sewage is treated anaerobically through the upflow anaerobic sludge blanket (UASB) followed by extended aeration. A tertiary treatment process was added to the plant recently, in 2014, in order to provide water to the Pandesara industrial complex.
Parameters
Hazardous air pollutants (HAPs) are those known to cause cancer and other serious health impacts. Several aromatic compounds, including BTEX, are included in a list of 189 HAPs.
Sampling and analysis
Sewage samples were collected as grab samples with a bucket (500 ml). The collected sample was preserved at 4°C and analysed within 1 week after collection. Less variation was observed in the characteristics of sewage during three times of sampling and analysis.
Sewage samples were also collected to determine the concentration of BTEX in aqueous form. With the help of an organic solvent (dichloromethane), these aromatic hydrocarbons (BTEX) were extracted and concentrated to allow quantitative analysis. The extract was then analysed by gas chromatography coupled with mass spectroscopy.
Monitoring of BTEX at various treatment units of the Bamroli STP was carried out by using handy VOC gas detectors to check the possibility of VOC emissions in the month of November 2017. The VOCs under consideration were BTEX. In the first monitoring of BTEX at two STPs, it was observed that a significant concentration of BTEX was emitted from primary treatment units. Therefore, fluctuation of these BTEX was monitored in the month of January 2018. The temporal variation of BTEX concentration was monitored in the month of April 2018. It was expected that with increasing atmospheric temperature (up to 40°C), higher diffusive emissions of BTEX would be observed, but almost the same trend was detected.
Instrument used
A Tiger handheld VOC gas detector (ION Science, UK) was utilised to measure concentration of BTEX. The instrument was calibrated as per standards (103 parts per million (ppm) isobutylene was applied, and the instrument detected it as 102.8 ppm). The instrument has a photoionisation detection sensor technology and is handy to operate. The probe of the instrument was kept towards the treatment unit, and the response time of the instrument was set to 5 s. It measures many VOCs, such as acetone, chloroform, dichloromethane, styrene and vinyl acetate.
Results and discussion
Temporal variation refers to changes occurred/happened with elapsing time, and spatial variation includes geographical variations, and these are also denoted as vertical and horizontal variations, respectively.
Spatial variation of VOCs at the STP
For better representation of the measured concentrations of BTEX, interpolation maps were plotted using the ArcGIS software program. Existing units of STP are shown/indicated maps, including screen chamber, grit chamber, Parshall flume, fine screen and UASB, where significant concentrations of BTEX were measured. Subsequent units of secondary and tertiary treatment were not introduced in the spatial variation due to their trace concentrations. The spatial variation in the measured concentrations of BTEX at the STP for two seasons is shown in Figures 2 and 3. In the month of November, the average temperature observed was 32°C. Being a tropical region, Surat has a high temperature of around 40°C observed during the month of April. Two seasons were considered for temperature variation and its influence on BTEX emissions from STP units. In an attempt to evaluate the influence of temperature, BTEX emissions were monitored in the month of November (winter) and April (summer). Figure 2 shows that the highest concentrations of BTEX (except xylene) were observed at the screen chamber of the STP. Emissions of BTEX depend on the volatilisation rate of individual compounds. Various factors influence the volatilisation of BTEX, including liquid temperature, surface temperature, surface turbulence, depth of waste water in the unit, velocity of liquid, surface area, molecular weight, solubility, boiling point and vapour pressure of individual compounds. The turbulence of the atmosphere above the liquid surface, ambient temperature, wind speed and direction and relative humidity also play a vital role in the emission of BTEX compounds and their dispersion. There are four types of emissions expected from the surface of units of an STP – namely, diffusive, convective and evaporative emissions and cumulation of all these.
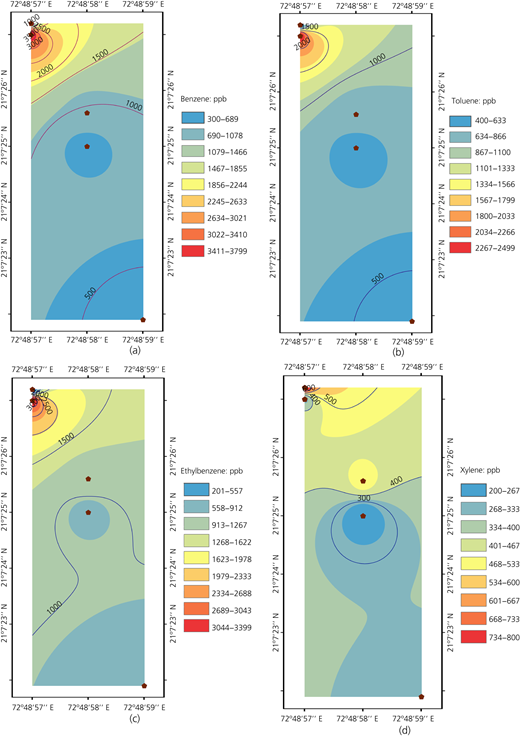
Spatial variations of (a) benzene, (b) toluene, (c) ethylbenzene and (d) xylene (ppb) in November
Spatial variations of (a) benzene, (b) toluene, (c) ethylbenzene and (d) xylene (ppb) in November
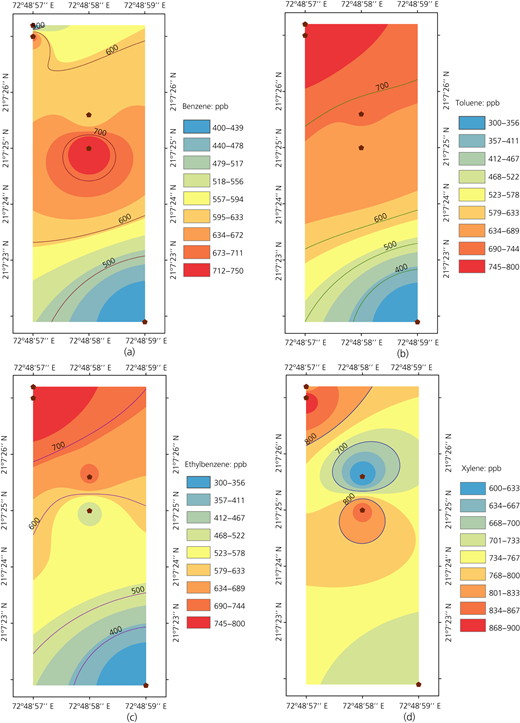
Spatial variations of (a) benzene, (b) toluene, (c) ethylbenzene and (d) xylene (ppb) in April
Spatial variations of (a) benzene, (b) toluene, (c) ethylbenzene and (d) xylene (ppb) in April
Benzene concentrations at the screen chamber were observed to be in the range 3400–3799 ppb in November, which is higher than those of other BTEX compounds emitted from the screen chamber. Comparatively, low emissions for xylene were noticed at the screen chamber, the grit chamber and subsequent units of primary treatment even during both seasons. It is also revealed that a significant concentration was observed from the sewer line of sewage during its conveyance and also from sewage pumping stations (Samnani, 2016). As the screen chamber is the first unit in the sequence of the STP, generated BTEX compounds escape into the atmosphere from the screen chamber, and this results in the highest concentration at the beginning unit of the STP. Looking into the pattern of BTEX emission and duration of monitoring, it is observed that diffusive emission dominates in November in the various units of the STP. Stable wind speed (5 km/h) and moderate temperature (21°C for liquid and 32°C for the atmosphere) contributed to the prevailing diffusive emission in November. Depending on the chemical properties of BTEX compounds, variability in their emissions is reflected in Figure 2.
It is interesting to note that diffusive emission transformed to cumulative emission due to prevailing meteorological conditions in April. The screen chamber showed a similar emission pattern as that observed in the month of November, but the remaining units have an altered emission scenario resulting from the combined effect of diffusive and convective emissions. A liquid temperature of 27°C and an ambient temperature of 40°C were noted during the month of April with an 8 km/h wind speed from south-west to north-east. According to Bunyakan et al. (2006), the presence of organic matter in sewage (April: biochemical oxygen demand (BOD) = 250 mg/l and chemical oxygen demand (COD) = 625 mg/l) provides a barrier for mass transfer and reduces the rate of volatilisation by reducing the degree of turbulence and consequently increasing the viscosity of sewage. The surface wind speed swipes off the organic vapour present above the surface of sewage. This led to prominent concentration around the units of the STP.
It is revealed from Figure 3 that BTEX emitted from the STP in April 2018 contains higher concentrations of xylene in the range 868–900 ppb. The fine-screen chamber contributed a higher benzene concentration compared with those of compounds. After the fine screen, the concentration of BTEX (except xylene) gradually decreased and further reduced to minimum at the UASB. It was interesting to note that the units of primary treatment, such as the screen chamber, grit chamber, fine screen and UASB, contributed to significant/prominent concentrations of BTEX, but only trace concentration of the same was observed for the biological and tertiary treatment units. Observation of concentration below the detection limit of instruments was quite frequent for the aforementioned secondary treatment units. The direct influence of ambient temperature (40°C in April 2018) on the cumulative emission of BTEX could not be justified, as many other parameters also affect the concentrations of BTEX escaping from the surfaces of treatment units.
Temporal variation of BTEX at the STP
BTEX concentrations were measured in primary units in the months of January and April 2018. The Bamroli STP has a capacity of 100 MLD; moreover, the sewage undergoes anaerobic treatment. Characteristics of the sewage reveal that relatively high BOD and COD were obtained in the inlet of this STP. Values of liquid temperature and turbidity and the presence of organic matter confirmed the possibility of volatilisation from sewage. Two units of STP – namely, the screen chamber and grit chamber – were monitored in the months of January and April 2018. Table 1 shows the concentration of BTEX for the period of investigation and its variability for different units.
Concentration of BTEX for the period of investigation and its variability for different units
| Compound | Screen chamber | Grit chamber | ||||||
|---|---|---|---|---|---|---|---|---|
| January | April | January | April | |||||
| Mean | SD | Mean | SD | Mean | SD | Mean | SD | |
| Benzene: ppm | 0.60 | 0.40 | 0.40 | 0.30 | 0.60 | 0.43 | 0.40 | 0.30 |
| Toluene: ppm | 0.50 | 0.30 | 0.50 | 0.30 | 0.60 | 0.47 | 0.50 | 0.30 |
| Ethylbenzene: ppm | 0.50 | 0.31 | 0.50 | 0.30 | 0.60 | 0.43 | 0.60 | 0.70 |
| Xylene: ppm | 0.40 | 0.21 | 0.50 | 0.30 | 0.50 | 0.30 | 1.00 | 1.60 |
SD, standard deviation
The screen chamber is the first treatment unit that removes floatable and large items from sewage. Accumulated VOCs are exposed to the atmosphere soon after being received from sewer lines, and hence, higher concentrations are expected from the surface of the screen chamber. The effect of wind speed (8 km/h in April) and its direction (south-west to north-east) is not significantly observed in cumulative BTEX emission from the screen chamber, as the liquid surface level was observed to be well below the top level of the unit. Screens were continuously separating large objects from sewage, and biodegradation of organic matter was not expected to be more due to the shorter retention time in the unit. Fluctuations in the concentration of each BTEX compound measured for 30 min at each treatment unit are shown in Figures 4(a)–4(d). The variation of BTEX for different units of the screen chamber and grit chamber and the period of monitoring for January and April is plotted using box plots with outliers. During 30 min monitoring of BTEX, almost 1800 readings were obtained. The variation of those concentrations is represented as box plots. Looking into the pattern of variability, it is claimed that a similar scattered concentration was obtained for all BTEX compounds for their interquartile range. The presence of outliers for the grit the chamber justified the noticeable fluctuation in BTEX for both seasons. The interquartile range for all BTEX compounds remained similar for the two units and seasons due to predominant diffusive emission, but the influence of various factors resulted in peak concentrations (shown as outliers in box plots) due to cumulative emission in the month of January for both units of the STP studied.
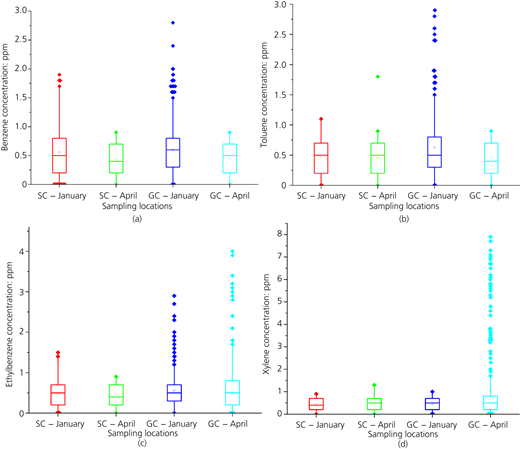
Temporal variations of (a) benzene, (b) toluene, (c) ethylbenzene and (d) xylene in January and April. GC, grit chamber; SC, screen chamber
Temporal variations of (a) benzene, (b) toluene, (c) ethylbenzene and (d) xylene in January and April. GC, grit chamber; SC, screen chamber
Figure 4(a) shows the concentration variation of benzene. The influence of the ambient temperature on cumulative emissions for benzene could not be clearly justified. Highest peak concentrations of 1.9 and 2.8 ppm were observed for the month of January from the screen chamber and grit chamber, respectively. During the monitoring in April, diffusive emissions were observed to be predominant for benzene.
The variability in toluene concentration is plotted in Figure 4(b). The highest peak concentration of 2.9 ppm for toluene was observed from the grit chamber in January. During the monitoring in April, similar diffusive emissions were observed to be predominant for toluene as obtained for benzene. The mean concentration of toluene remained almost similar for the screen chamber and grit chamber during both seasons – that is, 0.5 ppm.
The variation for ethylbenzene is shown in box plots with outliers in Figure 4(c). Highest peak concentrations of 2.9 and 4.0 ppm were observed from the grit chamber for the months of January and April, respectively. Cumulative emissions were observed to be predominant for ethylbenzene volatilised from the grit chamber for January and April as well. The upper quartile shows a higher concentration of 0.75 ppm for ethylbenzene from the screen chamber and 0.25 ppm for the lower quartile. The measured concentration exceeds the permissible limits stipulated by National Ambient Air Quality Standards (Naaqs), India.
Figure 4(d) shows the concentration variation of xylene. The highest peak concentration of 7.9 ppm was observed for the month of April from the grit chamber, which is due to prominent convective emission only. During monitoring in January, diffusive emissions were observed to be predominant for xylene. The upper quartile shows a higher concentration of 0.75 ppm for xylene from the screen chamber and 0.25 ppm for the lower quartile. The mean concentration of xylene remained almost similar for the screen chamber and grit chamber during both seasons – that is, 0.5 ppm. The measured concentration exceeds the permissible limits stipulated by Naaqs, India.
It can be claimed that diffusive emissions of BTEX are not solely due to biodegradation of organic matter in the unit. These may also be due to the release of accumulated BTEX that could not find a path to be volatilised in the transmission line during their conveyance. The effect of boiling points for BTEX can also be seen in the preceding graphs; a relatively high emission rate is obtained for benzene, as the boiling point of benzene is 80.1°C. Comparatively lower emissions were obtained for toluene (boiling point 110.6°C), ethylbenzene (boiling point 136°C) and xylene (boiling point 144.45°C). A higher concentration for BTEX was acquired because of forced-air flow, which swept the organic vapour from the surface of sewage. The fluctuation in BTEX concentrations in April follows almost a similar trend in the month of January, as the increase in temperature (from 30°C in January to 40°C in April) does not have a significant effect on cumulative emissions of BTEX.
Categorisation of all data obtained during 30 min of monitoring time (for each BTEX compound) is shown in box plots. From Figure 4, it can be clearly seen that 25% of the measured concentrations of BTEX fall around 0.25 ppm. A similar trend of BTEX emissions was obtained in the month of April. Fifty per cent of the obtained concentrations of BTEX fall around 0.5 ppm. The upper quartile shows that 75% of all acquired concentrations fall around 0.7 ppm (except those of benzene, which has a concentration of >0.7 ppm). Although a higher concentration is obtained during 30 min monitoring, most of the measured concentrations fall around 1 ppm. It can be concluded from Figure 4 that the emission of VOCs from the screen chamber exceeds the limit (5 μg/m3, 0.0015 ppm for benzene) stipulated by Naaqs.
The effect of retention time in this unit is significant, as it increases the rate of volatilisation of BTEX compounds. Comparatively higher diffusive emissions were expected in the grit chamber due to the low depth of sewage (1.5 m), which allows penetration of solar radiation.
Higher BTEX emissions were observed during wind blowing, as it swept the organic vapour present on the surface of sewage. In order to find temperature variation's effect on temporal variation of BTEX, concentration of those compounds was found in the month of April. (40°C) BTEX (except xylene) showed a similar trend of emissions as previously monitored, but a prominent difference was observed between emissions of xylene in January and April. The effect of temperature increase and wind flow on the surface of sewage is reflected in the graphs for xylene.
Conclusions
This research study was carried out to quantify the BTEX emissions from an STP in the city of Surat. Two seasons (April and November/January) were monitored for BTEX compounds. From the measured concentration, spatial variations as well as temporal variations were studied. The main findings of the research study are summarised as follows.
In the attempt to investigate the presence of BTEX from the STP, a significant concentration of BTEX was confirmed from the units of primary treatment.
Spatial variation of BTEX revealed that only trace concentration was measured from the units of secondary treatment.
Accumulated BTEX that could not find a path to volatilisation in the transmission line during their conveyance eventually escaped from units of the STP.
Spatial variation of BTEX showed that the highest concentrations of BTEX (except xylene) were present at the screen chamber of the STP in the month of November.
The screen chamber showed a similar emission pattern in April as that observed in the month of November, but the remaining units altered the emission scenario resulting from the combined effect of diffusive and convective emissions.
As a result of temporal variation, the highest peak benzene concentrations of 1.9 and 2.8 ppm were observed for the month of January from the screen chamber and grit chamber, respectively.
During the monitoring in April, diffusive emissions were observed to be predominant for both benzene and toluene. However, the highest peak concentration of 7.9 ppm was observed for the month of April from the grit chamber, which is due to prominent cumulative emission only.
The mean concentration of toluene and xylene remained almost similar for the screen chamber and grit chamber during both seasons – that is, 0.5 ppm.
The measured concentration of BTEX exceeds the permissible limits stipulated by Naaqs (5 μg/m3, 0.0015 ppm for benzene), India.
This research study proved the existence of significant concentrations of BTEX in an STP of Surat City. The results obtained can also contribute to awareness among treatment plant operators, downwind receptors and plant designers. This research study can be further expanded to other treatment plants, and efforts can be made to develop emission factors. BTEX emissions can be a key point for designers of sewage conveyance and treatment systems. More vent pipes have to be provided for the dispersion of these compounds in transmission lines. Selection of unit operations, their geometrical configurations and hydraulic parameters can be aiding tools for combating BTEX emissions from STPs. Appropriate safety aids such as face masks should be utilised by labourers who are continuously exposed to these compounds.
Acknowledgement
The authors extend their sincere thanks to the drainage department of Surat Municipal Corporation, Surat, for co-operating with them for sampling and monitoring of BTEX compounds.

