Gas generation is an inevitable consequence of radioactive waste storage and disposal. The rate at which gas diffuses through host rocks and overlying strata is an important consideration in safety assessment. To examine the impact of material variability, British Geological Survey developed a methodology to manufacture ‘synthetic rock’ samples from mixtures of clay, sand, and silt. Diffusion experiments were conducted on these, and natural samples of Boom Clay and Eigenbilzen Sands. Samples were tested under an isotropic stress equivalent to 400 m burial, assessing anisotropy by measuring intrinsic permeability and diffusion normal and perpendicular to bedding. Boom Clay exhibited permeability and gas diffusion anisotropy ratios of 4.5 and 1.5, respectively. A semi-log relationship between permeability and diffusivity was observed. No significant correlation to mineralogy changes was found, indicating fabric and pore morphology are more important. This was supported by a correlation between porosity and diffusivity. X-ray computed tomography analysis suggested diffusivity was inversely proportional to bioturbation features and that stress promoted micro-crack closure which may also help to explain previous data dispersion. The study confirmed the usefulness of synthetic samples in exploring complex processes, generated data relevant to natural clay systems and showed diffusivity was not highly sensitive to large changes in permeability.
Notation
- A
cross-sectional area of sample (m2)
- BC
Boom Clay
- COx
Callovo Oxfordian Claystone
concentration of the diffusing substance (mol.m−3)
difference in concentration across the sample (mol.m−3)
- D
diffusion coefficient (m2.s−1)
- ES
Eigenbilzen Sands
- EGME
ethylene glycol monomethyl ether
- F
rate of gas transfer per unit area (mol.s−1.m−2)
rate of gas transfer (mol.s−1)
- g
acceleration due to gravity (9.81 m.s−2)
- k
permeability (m2)
- K
hydraulic conductivity (m.s−1)
- L
length (m)
experimental pressure (Pa)
standard pressure (=105 Pa)
- Q
steady-state flow (m3.s−1)
- SM
synthetic material
- XRD
X-ray diffraction
- x
space coordinate measured normal to the sample section (m)
- ΔP
pressure drop along the sample (Pa)
- µw
viscosity of water (1.002 × 10⁻³ Pa.s)
volumetric flow rate measured at pressure (m3.s−1)
- ρw
density of water (kg.m−3)
Introduction
The generation of repository gases is an inevitable consequence of radioactive waste storage and disposal (Agg et al., 1994; Bonin et al., 2000; Croisé et al., 2011; Shaw, 2015; Norris, 2015). Gas will be generated by aerobic and anaerobic degradation of the waste and repository infrastructure (Sharland, 1986; Rodríguez, 2014; King, 2017; Necib et al., 2017; Shrestha et al., 2021). Generated gas will move by the combined processes of molecular diffusion (Epstein, 1989; Jacops et al., 2013, 2021; Amann‐Hildenbrand et al., 2015) and bulk advection (Horseman et al., 1999; Harrington and Horseman, 1999; Harrington et al., 2012a, 2012b, 2017, 2019; Carbonell et al., 2019; Villar et al., 2021; Graham and Harrington, 2024). Gaseous diffusion, as an omnipresent process, will control the development and therefore timing at which a discrete gas may accumulate within repository voids. The rate of gas generation coupled with the diffusive capacity of the host rock will control gas pressure build-up and its impact within the repository (Bonin et al., 2000). The fate of repository gases and the possible uncontrolled build-up of gas pressure, therefore, emerge as key considerations in all repository safety assessments (Ortiz et al., 2002; Sellin and Leupin, 2013; Norris, 2015; Jacops et al., 2023).
Previous work by Jacops et al. (2013; 2015; 2016; 2017; 2020; 2021), Jacops (2018), Krooss and Schaefer (1987) on natural clay samples and compact bentonite subject to a constant boundary volume, and Rebour et al. (1997) on natural clay samples subject to an isotropic confining stress, have provided key data on the diffusional properties of possible candidate repository materials. These values exhibit noise and show little sensitivity to bedding anisotropy, or a strong correlation to other key parameters such as intrinsic permeability. To understand why, this study was initiated through EURAD (European Partnership on Radioactive Waste Management) to better understand the processes impacting gas diffusion. As such, a series of bespoke experiments, performed on natural materials (Boom Clay, BC, Vandenberghe et al., 2014, and a sample of Eigenbilzen Sands, ES, Anon, 2020), were undertaken. Samples were tested parallel and perpendicular to bedding to assess the impact of anisotropy on the diffusive capacity of BC. In consultation with ONDRAF-NIRAS (Belgian nuclear waste management agency) and COVRA (nuclear waste management agency of the Netherlands), the natural samples used in this study were subject to an isotropic boundary stress, generally equivalent to a reference compaction state circa 400 m. As this represented the first-time gas diffusion coefficients on BC, subject to isotropic confinement, had been measured, it also allowed the potential importance of stress to be examined (McKinley and Chapman, 2009; Corkum et al., 2018; Burchartz et al., 2025).
Alongside gas diffusion experiments through BC and the ES, a complementary suite of experiments was undertaken on synthetic ‘analogue’ samples which were manufactured for this study by the British Geological Survey (BGS). In these tests, the ratio of clay, silt, and sand was varied to assess its impact on the diffusion coefficient to gas. The use of synthetic analogues was used as a tool to highlight possible controls on the diffusive behaviour of materials, removing the complexity of natural heterogeneity. A small matrix of tests with differing mineralogy, broadly representative of the compositions of the natural host rocks under consideration within Europe, were performed and the methodology of such an approach, validated.
Experimental setup, sample characterisation, and testing protocol
All aspects of the BGS test system were designed to minimise the possibility of gas (and water) leakage to try and accurately define the hydraulic and gas diffusion properties of the test material more accurately.
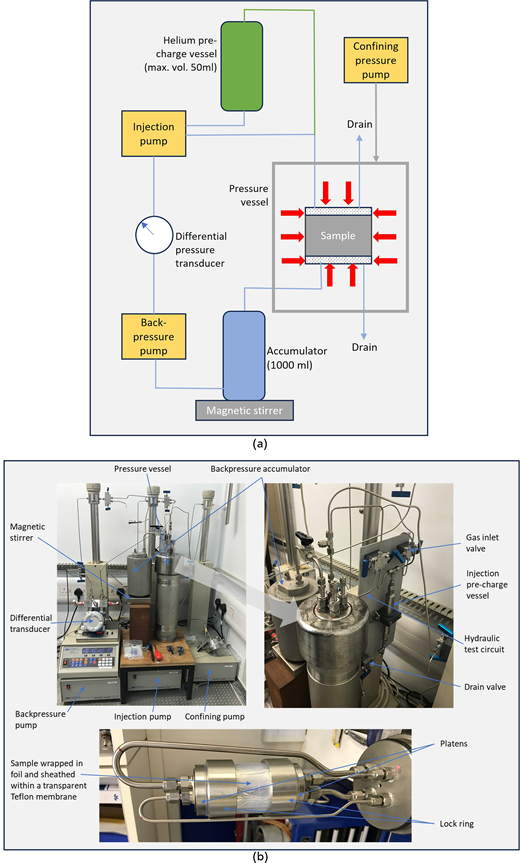
The basic permeameter was similar to that used by Harrington et al. (2012a, 2012b) (Figure 1) and consisted of six main components: (1) a specimen assembly, (2) a 16 MPa rated pressure vessel and associated confining pressure system, (3) a fluid injection system, (4) a backpressure system, (5) a high-resolution Endress & Hauser Type PMD55 differential transducer1 and (6) a PC-based data acquisition system. Filters were placed on either end of the cylindrical sample which was then sandwiched between two stainless steel end-caps, wrapped in aluminium foil2 and jacketed in heat-shrink Teflon to exclude confining fluid. A unique lock-ring system built into each end-cap compressed the Teflon against a Viton ‘O’-ring to provide a leak-tight seal. The inlet and outlet zones for water or gas flow through the specimen were provided by porous filter discs 50 mm in diameter. These acted as either source or sink for the injection of test permeants. During hydraulic measurements, all the filters were saturated with an aqueous pore water solution.
The injection system was comprised of two sub-systems, one dedicated to the measurement of hydraulic properties and the other, configured specifically for gas diffusion testing using helium as the gas permeant. The latter circuit was configured around a single pre-charge vessel (with welded tubing connections) with only metal to metal connections linking it to the test sample, thereby minimising the chance of molecular leakage. The development of this system was implemented after the initial test on Boom Clay, FPR-19-006, which experienced excessive gas loss during diffusion testing. The addition of foil wrapping also came into effect after this test as a preventative measure to limit gas loss through the heat shrink Teflon jacket into the confining fluid.
Volumetric flow rates were accurately controlled or monitored using a pair of ISCO-260, Series D, syringe pumps operated from a single digital control unit. The position of each pump piston was determined by an optically encoded disc graduated in segments equivalent to a change in volume of 16.6 nL.3 Movement of the pump piston was controlled by a micro-processor which was continuously monitored and the rate of rotation of the encoded disc was adjusted using a DC-motor connected to the piston assembly via a geared worm drive. This allowed each pump to operate in either constant pressure or constant flow modes. A programme written in LabVIEWTM elicited data from the pump at pre-set time intervals. During testing, the software could use the output signal from the differential transducer to control the ISCO syringe pumps to accurately record either differential pressure during permeability testing, or, to maintain the same pressure between pumps to prevent advective gas flow during diffusion testing. When these units were not available the output signal from the backpressure pump was used in the same way to control the injection pump.
Tests were performed in an air-conditioned laboratory at a nominal temperature of 20°C. A typical test history comprised a sequence of test stages, each designed to examine a particular system response, as outlined in Section 2.5.
Calibration
Calibration of the injection, backpressure, and confining pump pressure responses was done against a known laboratory standard, itself calibrated to a nationally recognised accreditation. Pressure increments, then decrements were applied to each pump and least squares regression of the data undertaken. Corrections were then applied to each pump pressure response to minimise the chance of inadvertently creating a pressure differential across the sample. Given the highly sensitive nature of the differential pressure transducer (i.e. an operating range of 100 kPa) used during diffusion measurements, it was not possible to recalibrate this using standard laboratory techniques. Instead, the unit was returned annually to the manufacturer for recalibration.
Test fluids
Rehydration of the BC samples, and subsequent permeability measurements, were undertaken using a synthetic pore water solution, matched to that of the ground water at Mol (Table 1). Due to its low salinity, manufacture of the synthetic samples was done using a synthetic pore water matched to that of the COx according to a recipe supplied by ANDRA (Agence nationale pour la gestion des déchets radioactifs) (Table 1). This was selected as a generic pore water fluid chemistry reflecting average conditions which might be experienced across multiple clay-rich host rocks currently under consideration as sites for a national repository.
Material properties
Natural samples of Boom Clay were prepared by machine lathing of drilled samples from the Mol Underground Research Laboratory from a depth of ∼220 m (Harrington et al., 2017) to produce high-quality cylindrical specimens whose dimension and bulk densities are presented in Table 2. Synthetic samples were manufactured by BGS. The clay component of each sample was made from an 80%:20% mixture of MX80 bentonite and kaolinite. The bentonite was milled to a grain size of no larger than 30 microns. The silt fraction was pure muscovite mica, and the sand fraction was derived from high-purity quartz sand supplied by Lochaline Quartz Sand Ltd, which was sieved to obtain particles in the range 63–125 microns. Sample compositions are presented in Table 5. While the proportions of clay, quartz, and other minerals varies with depth (Frederickx et al., 2024), composition 7, with a clay content of 60%, silt 20%, and quartz 20%, was manufactured to be a good analogue for BC. When mixed with an appropriate amount of synthetic fluid, the clay, sand and silt fractions were placed in a hydraulic press and a fixed axial load applied to create composition 7 samples (Table 5)4, close to saturation with a similar dry density to BC. Once complete, samples were extruded from the press and machine lathes to size. Pre- and post-test geotechnical properties were calculated for each sample (Table 2). Upon completion of testing, most samples were partitioned, with allotted segments sent for X-ray diffraction (XRD), surface area, grain density, and geotechnical analyses (Tables 2–4). XRD analyses were carried out broadly following the methodologies outlined in Kemp et al. (2016a, 2016b). Ethylene glycol monomethyl ether (EGME) total surface area determinations followed the methodology of Carter et al. (1965). To assess natural variability, BC5 and ES1 were sub-sampled twice (Table 5). Compositional differences were observed which complicate the identification of correlators between the diffusion coefficient and other, easier to measure, material properties/characteristics in natural materials. This was one of the motivating factors for moving to synthetic samples to explore fundamental couplings between parameters.
Computed tomography
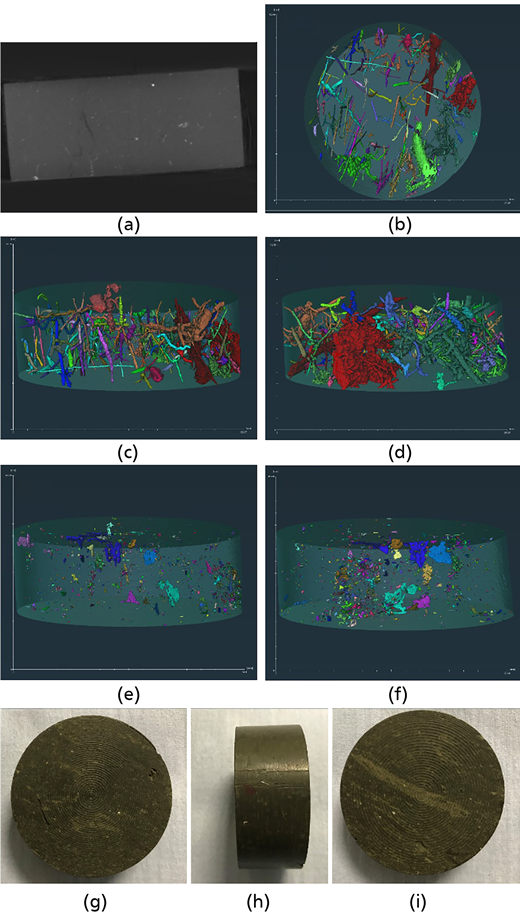
Natural core samples were preserved in cling-film and vacuumed foil packing at the time of drilling to minimise moisture loss. Where possible, prior to sub-sampling, the entire length of core was then imaged in both 2D and sometimes 3D in the BGS Core Scanning Facility (CSF), while still in the original packing material. These images (Figure 2) were then analysed to assess the quality of the core and its suitability for the testing to mirror the intact behaviour of the rock. Details of the XCT and the procedure used to scan the cores can be found in Supplementary material.
Once the core barrel had been scanned, it was sub-sampled then re-preserved to prevent moisture loss and returned to the CSF for detailed XCT imaging. At this size sample, it was possible to achieve resolutions down to ≈50 microns.
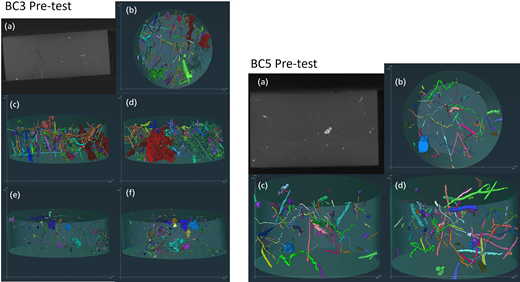
An example showing the types of images derived from this type of analysis is illustrated in Figure 2. Probable bioturbation features can be seen in the images and their orientation and connectivity was assessed to provide quantitative information on the characteristics of each core, part of which has been summarised in Table 6.
The connected volume of features divided by the total volume of features defines the overall interconnectivity of features throughout the sample, where a feature is considered part of the connected volume if there is an unbroken segmented pathway along the Z-axis that is top to bottom of the core. If a connectivity of 0 is presented, then no features span the Z-axis. Connectivity between segmented features is only present in BC3 and BC4 with 15.73% and 13.25% of total feature volume connected, respectively.
The >0.5 mm3 feature volume divided by the total feature volume gives a coarse single value understanding of the feature size distribution. Segmentations with high values (80%–100%) are comprised mostly of larger features and vice versa.
The feature surface area refers to the total surface area of all features. The sample volume (after beam-hardening artefacts have been removed) refers to the total volume of the sample scanned including voids. The P32 value, or feature intensity, is a metric which measures the surface area of features as a function of the overall sample volume to understand the interactivity of features with each other (Morelli, 2024). Unlike volume measurements which may be skewed towards singular large features, the P32 gives an understanding of the density of features within a sample. P32 is greatest in BC3 at 0.30, despite it not having the greatest overall feature volume.
Test protocol
The test protocol used in this study was developed in consultation with SCK CEN and the Catholic University of Leuven (both of whom had separate projects) to try and better characterise the test material. It was hoped this information would help identify correlators between the diffusion coefficient (which is difficult to accurately measure), and simpler geotechnical/mineralogical parameters which can be easily measured. It was also hoped that this high level of pre- and post-test characterisation would help to contextualise data, so the impact of heterogeneity on material properties might be better understood.
The test protocol was comprised of a series of steps. In Step 1, core taken from Mol was imaged using XCT to understand the internal structure and identify sections for testing that is no obvious fractures. In Step 2, selected sections of clay were machine lathed to create high-quality samples for testing. These were then reimaged in Step 3 with analysed data presented in Table 6 which was later used to look for specific correlators. In Step 4, confining and backpressures were applied to the samples to restress the sample to the target conditions and facilitate rehydration of the material. Thereafter, one or more constant head tests that is measuring the advective movement of water, Section 2.6, were undertaken to define the intrinsic permeability of each sample, Step 5. Following a period of equilibration, sufficient to allow pore water pressures from permeability testing to dissipate, the leakage rate of gas from the pre-charge vessel (Figure 1) was measured. Once complete, helium gas was then very flushed through the upper filter to remove the hydration fluid and allow diffusion testing to begin, Step 6. If necessary, further leaking testing of the gas system was undertaken and a correction applied to the data. Following the measurement of the diffusion coefficient, synthetic pore water was flushed back through the injection lines to replace the helium gas. Intrinsic permeability was then remeasured, Step 7, and the sample removed from the apparatus, re-imaged using XCT, before being sub-sampled to define mineralogical and geotechnical data, Step 8. Information from all the tests was then analysed to try and identify key correlations, Step 9.
Data reduction
The advective movement of water through porous media is described by Darcy’s Law which is defined as:
where Q is the steady-state flow (m3.s−1), ρw is the density of water (kg.m−3), g is the acceleration due to gravity (9.81 m.s−2), A is the cross-sectional area of the test sample normal to flow (m2), L is the sample length (m), and ΔP is the pressure drop along the sample (Pa). Parameter K is then a conductivity. The equivalent permeability term (k) is given by
where µw is the viscosity of water (1.002 × 10⁻³ Pa.s). Permeability, k (m2), was calculated from hydraulic conductivity using the relationship:
The mathematical theory of diffusion in isotropic substances is based on the hypothesis that the rate of transfer of a diffusing substance through a unit area of a section is proportional to the concentration gradient measured normal to the section that is first law of Fick, given by
where is the rate of transfer per unit area of section (mol.s−1.m−2), is the concentration of the diffusing substance (mol.m−3), x is the space coordinate measured normal to the section (m), and is the diffusion coefficient (m2.s−1). The negative sign in Equation 4 indicates that diffusion occurs in the direction opposite to that of increasing concentration. Assuming that L is the sample length (m), then Equation 4 may be written as:
with (mol.m−3) the difference in gas concentration across the sample. Therefore, the diffusion coefficient reads as
where is the rate of transfer (mol.s−1) and (m2) is the sample area as above.
Given a volumetric flow rate (measured at pressure in Pa), this is first corrected to the standard pressure (= 105 Pa) using
which can then be divided by the volume of 1 mol of gas at STP (22.4 l). Hence,
and
Sources of error
Systematic errors occur in all measurement devices and when multiple devices are combined, such as in an experimental system, errors can be both cumulative or cancelling depending on the direction and magnitude of the error. In this study the primary source of systematic error relates to the measurement of flow, pressure, and the potential uncertainty in the selection of data trends to derive the gradients used to calculate flow (both water and gas). However, errors in flow are extremely small. As stated at the start of Section 2, footnote 5, the volumetric resolution of the pumps was orders of magnitude greater than the cumulative measurement required in this study. By acquiring volumetric flow data for inflow and outflow over extended time frames, issues relating to mass balance (i.e. difference between flow in and flow out) could be identified. In addition, sufficient cumulative flow data >0.1 cm3 was collected during diffusion and hydraulic testing that is equivalent to 100,000 nl. Even if an unlikely error of 600% was applied to the resolution of the pump (i.e. 16.6 nl) in its response to water/gas flow, it would equate to an error <0.1%.
Similarly, the selection of a high-resolution differential transducer helped to minimise errors in pressure measurement and pressure control. Each of these transducers was calibrated to a national standard by the manufacturer, giving a measurement error (as a percentage of the measurement range i.e. 0–100 kPa), of <0.03%. This is so small as to be negligible. Even when ISCO pumps were run using their own transducers, for example, for control of the confining and hydraulic systems, they were calibrated to the same laboratory standard. This method yielded excellent pressure control and repeatability. Even an unlikely error of ±50 kPa caused by transducer drift would result in only a 2.6% error in backpressure. Again, small enough as to be negligible for the purposes of this study. It should also be noted that such errors in pressure between injection and backpressure pump, due to the relatively high hydraulic permeability of the sand-bentonite, would result in substantial cross-flow between the pumps. This would have been obvious during equilibration stages and during hydraulic testing. If cross-flow was observed, the pumps were isolated and their pressure datums checked. This corrected any such problems.
Errors in permeability and diffusion coefficient stemming from the author’s selection of time series data (e.g. cumulative flow response) were minimised by both acquiring data over multiple days. Leakage rates were also measured before and sometimes after diffusion testing to further reduce uncertainty in the measured cumulative flow values. That said, it is not possible to guarantee that the leakage value measured in a neighbouring stage unequivocally applies to the one before or after. For that reason, values for diffusion quoted in this study should be treated with appropriate caution and results/trends in behaviour considered as indicative until more testing is undertaken.
Results
Five laboratory-scale samples of BC and one sample of the ES were tested. In addition, six laboratory-scale tests were also performed on synthetic samples with varying mineralogical compositions. Following discussion with Ondraf-Niras and COVRA, it was agreed that samples should be tested at an elevated stress condition, equivalent to ≈400 m. As such, unless otherwise stated, tests were performed at a confining stress of 8.0 MPa and a pore water pressure of 3.9 MPa, giving an effective stress of 4.1 MPa (Table 2). Note, in test BC1 leakage of gas was detected so changes to the sample assembly (Figure 1) were made to include a flexible foil barrier between the sample and Teflon sheath. The diffusion properties of this arrangement of sheathing materials were tested separately, yielding a coefficient of 4.9 × 10⁻¹¹ m2.s−1, that is, around one order of magnitude smaller than those measured on the clay samples tested in this study5.
Intrinsic permeability of natural clay samples
Three tests were performed with flow perpendicular to bedding, BC1, BC2, and BC4. Test BC1 was performed on BC which had not been previously pre-consolidated to the target stress conditions. Instead, the sample was initially stressed to Mol conditions (i.e. confining and backpressure 4.4 and 2.2 MPa, respectively). Once equilibrated, confining stress was then increased to 6.3 MPa imposing the correct effective stress for the test of 4.1 MPa. This resulted in consolidation of the sample, the transient from which was amenable to numerical analysis (details of which are in the Supplementary material section), yielding an intrinsic permeability value of 5.1 × 10⁻¹⁹ m2.
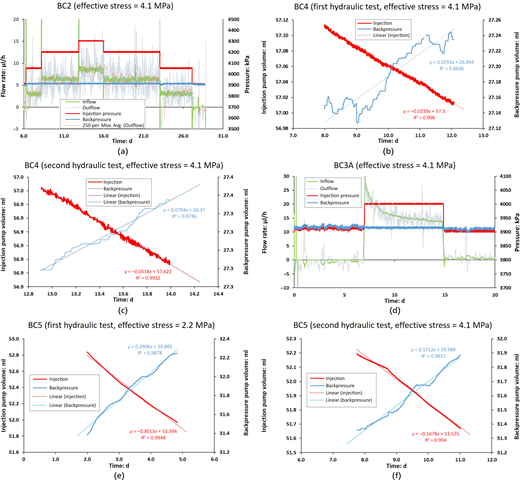
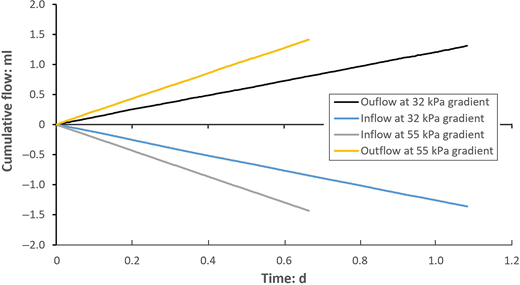
The second, test BC2, was performed on a section of BC which had previously been consolidated to the target effective stress (i.e. 4.1 MPa). In this test, intrinsic permeability was measured using three ascending, followed by two descending, constant head tests, with pressure differentials of 140, 288, 388, 288, and 140 kPa, respectively (Figure 3). Measured permeability values were very consistent, resulting in an average value of 1.15 × 10⁻¹⁹ m2 with a standard deviation of 3.97 × 10⁻²¹ m2, indicating permeability was not sensitive to the magnitude of the differential pressures (i.e. head gradient) applied during this test. However, the value of 1.15 × 10⁻¹⁹ m2 is significantly lower than that obtained for BC1, though the latter was based on analysis of the consolidation stage from an initial effective stress of 2.2 MPa to the target value of 4.1 MPa, in which all porosity is likely to play a role. Based on XCT analysis of major features within each sample (Table 6), BC1 also has the highest volume percentage of features above 0.5 mm3. It is also possible that these features influenced the permeability value and thus may contribute to the higher value observed for sample BC1.
A third test (BC4) was performed perpendicular to bedding (again on BC which had already been pre-compacted to the target effective stress) and based on the average value from two constant head steps (Figures 3(c) and (d)), yielded a permeability value of 1.13 × 10⁻¹⁹ m2. This number is very similar to that from sample BC2, even though there was around 4.4 m separation between the samples when taken from within the same borehole. As with test BC3, intrinsic permeability was remeasured following protracted measurement of the diffusion coefficient. Unlike test BC3, intrinsic permeability of BC4 increased slightly following measurement of the diffusion coefficient, rising from 1.13 × 10⁻¹⁹ to 1.70 × 10⁻¹⁹ m2. While this small change is within the resolution of the apparatus, though the cause for the change is unclear.
Two tests performed with flow parallel to bedding were also undertaken, that is, tests BC3 and BC5. In test BC3, also performed on material which had previously been consolidated to the target effective stress (i.e. 4.1 MPa), intrinsic permeability was measured before and after the first diffusivity measurement (suffixed A and B, respectively). Interestingly, a significant reduction in permeability value was observed dropping from 5.11 × 10⁻¹⁹ to 3.68 × 10⁻¹⁹ m2 after the first diffusion measurement (Table 7). However, the reason for this change is not clear, as the stress regime remained unchanged during the entire experiment. That said, in Figure 3(d) the flow data showed an uncharacteristic response which may relate to this observation. Whatever the cause, the change appears to be real given the subsequent reduction in diffusion coefficient when remeasured after the second intrinsic permeability test [suffixed B]. Post-test examination of the sample yielded no obvious cause for the reduction in permeability observed during the test. Indeed, the sample increased very slightly in volume resulting in the apparent drop in bulk density observed in Table 2.
Similar to test BC1, sample BC5 was also performed on BC which was not pre-conditioned to the target effective stress prior to testing. As such, the sample was initially stressed to Mol conditions (i.e. confining and backpressure 4.4 and 2.2 MPa, respectively) and the hydraulic conductivity measured (Figure 3(e)). This yielded a value of 8.17 × 10⁻¹⁹ m2. The sample was then stressed to the target effective stress (i.e. confining and backpressure 8.0 and 3.9 MPa, respectively) and permeability remeasured (Figure 3(f)). Upon retesting, permeability had dropped to 6.69 × 10⁻¹⁹ m2. This is a relatively small decrease and is consistent with minor volumetric deformation as the sample moved along a rebound-reconsolidation line with a relatively small gradient. Following diffusion testing, permeability was measured for a third time, yielding a value of 4.06 × 10⁻¹⁹ m2 (Table 7).
Intrinsic permeability of Eigenbilzen sands
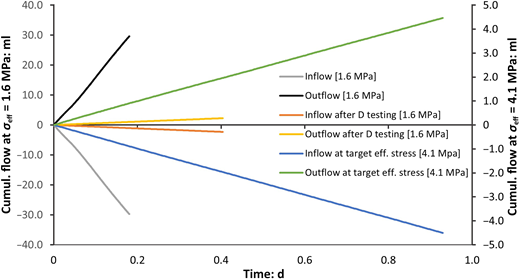
As a part of the collaboration between SCK CEN, IRSN, and BGS in the EURAD-GAS project, a sample of Eigenbilzen Sands, ES1, was tested. As in test BC5, the permeability was initially measured under its original in situ conditions (i.e. with confining and backpressure values of 3.05 and 1.45 MPa, respectively) based on data provided by SCK CEN. This yielded a permeability value of 9.70 × 10⁻¹⁶ m2, ES1A (Table 7). Following measurement of the diffusion coefficient the permeability was remeasured, this time yielding a value of 2.22 × 10⁻¹⁷ m2 (Table 7). This represents nearly an order of magnitude decrease in permeability. Confining and backpressure values were then increased to 8.0 and 3.9 MPa, respectively, and the permeability remeasured (Figure 4), ES1B in Table 7. This gave a similar value of 1.79 × 10⁻¹⁷ m2, indicating collapse of the pore structure occurred sometime between the first and second hydraulic tests (Figure 4).
Intrinsic permeability of synthetic samples
The hydraulic properties of five synthetic samples were also measured as part of this study (Table 7). Each sample had a different mineralogical composition (Table 5), so that the coupling between permeability, diffusion, and mineralogy could be explored. Differences between target and actual composition can be explained by the presence of detrital material in each of the start mineral fractions. Intrinsic permeability was measured in a similar manner to that of previous natural samples, that is, by constant head steady-state testing, with the results presented in Table 7.
In test SM1, the permeability was measured twice prior to gas testing, yielding an average value of 9.00 × 10⁻¹⁸ m2 (Figure 5). Following diffusion testing, the permeability of the sample was remeasured. During this latter stage data processing was complicated by a small leak but yielded an estimated value of 3.36 × 10⁻¹⁸ m2. This represents a large drop in permeability and is similar to the behaviour observed for samples BC5 and ES1.
In all synthetic sample tests, apart from SM5 where it was only measured once, intrinsic permeability was measured before and after diffusion testing. Inspection of the data shows that permeability values vary between test samples. In SM1, the permeability value measured after diffusion testing is significantly lower than the value prior to testing. However, in all other tests performed on synthetic samples permeability after diffusion testing was either similar to the pretest values or fractionally higher. It is also worth noting that SM4 had a higher permeability than the other SM samples and was closer in value to ES1B. While SM4 had the highest silt fraction (50%) of any SM sample, the highest sand fraction was in SM5 (i.e. 50%). However, the higher sand fraction of SM5 does not translate to higher permeability or diffusion coefficient, indicating fabric and pore morphology is more important than just mineralogy alone.
Diffusion properties of natural and synthetic materials
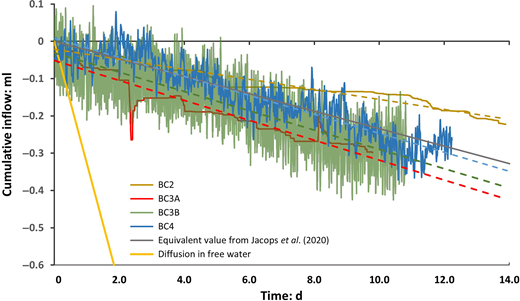
The diffusion coefficient to helium was measured in all tests except that of BC1 and the data has been tabulated in Table 7. In tests BC3, intrinsic permeability and the diffusion coefficient were measured on two separate occasions, both yielding slightly different values (Table 7), suggesting time-dependent evolution of the sample. In test ES1, the intrinsic permeability and diffusion coefficient were measured at two confining and backpressures. Figure 6 shows the change in the injection pump volume for two tests as gas slowly diffused through each sample. The difference in the apparent noise in the data between tests BC2 and BC3B (Figure 6) is caused by the introduction of a high-accuracy differential pressure transducer. Unfortunately, this unit was not available at the start of the test programme which had to rely on the less sensitive ISCO pump transducers. The high-accuracy device, accurate to ±0.1 kPa was used to control the injection pump to minimise the chance of developing an excess gas pressure, and thus unwanted gas advection. This level of accuracy meant that the injection pump constantly adjusted its position to compensate for the loss of gas by diffusion and expansion/contraction of gas caused by any minor changes in laboratory temperature. However, sampling across multiple days allowed trends in data to be identified and thus the diffusion coefficient to be calculated. In some tests it was necessary to apply a leak correction which was determined either before testing, when the system was checked to see if it was leak tight, or after testing, to check the system remained leak tight.
Six tests were then performed on synthetic samples made with varying mineralogical compositions (Table 5). The data shows that the value of the diffusion coefficient varies between samples and is highest in test SM4 with a value of 6.48 × 10⁻¹⁰ m2.s−1 which has the highest silt fraction. The lowest diffusion coefficient was measured in sample SM3, which yielded a value of 1.12 × 10⁻¹⁰ m2.s−1. The composition of this sample (Table 5) was predominantly quartz rich (63.9%) with some clay (31.0%), a small amount of silt (5.6%) plus a minor amount of other material. The fact that this sample had the highest quartz content, but the lowest diffusivity, may seem somewhat counterintuitive. However, it should be remembered that quartz has a molecular diffusion coefficient of zero, which means much of the sample would be inaccessible to the diffusing gas.
The data presented in Table 7 indicates the BC and the synthetic samples have lower diffusivities than those of the ES. This is not surprising given the highly porous nature of the latter sample. Values for BC are broadly similar to those published by Jacops et al. (2020), with the lowest diffusion coefficient measured on a BC sample cut perpendicular to bedding (BC4). While there is a paucity of data, based on the information presented in Table 7, gas appears to preferentially diffuse parallel to bedding, with nearly 60% of the diffusional capacity of the BC moving within the bedding planes, yielding an anisotropy ratio of around 1.5.
Discussion
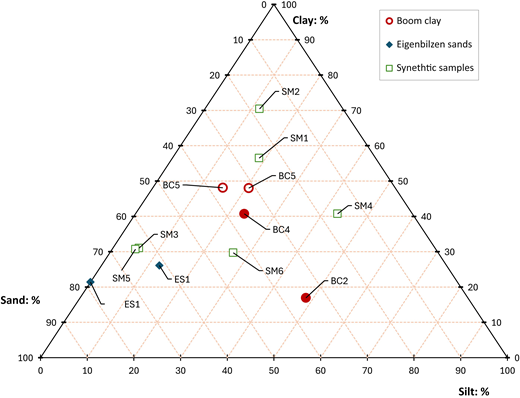
While there is a paucity of data, based on the limited values presented in Table 7 (excluding the value for BC1 as this was derived from analysis of the consolidation transient rather than by direct constant head testing), the BC has a hydraulic anisotropy ratio of around 4.5. This value is fractionally higher than some previous reported values, for example, 2.5 (Yu et al., 2013), but is in line with data from Volckaert et al. (1995) who quote 3–5. The difference in values may also reflect the higher degree of compaction of the test material used in this study, that is, compacted to 400 m equivalent depth of burial. However, it could also reflect the natural heterogeneity of the BC (Aertsens et al., 2004) and differences in accessible porosity. This variability is evident in Tables 3 and 4 and the ternary plot (Figure 7), where sample BC2 plots to the lower right that is more silty, of the main cluster of BC points.
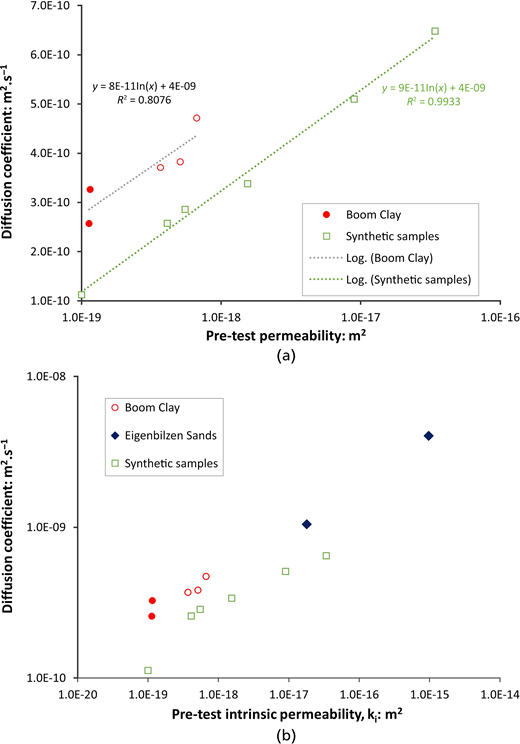
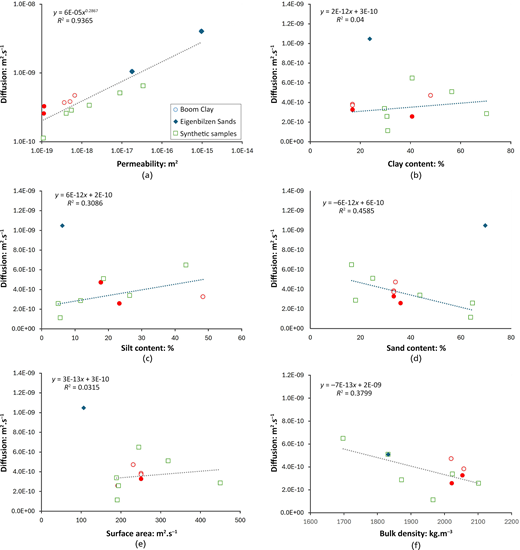
Examination of the data suggests gas preferentially diffuses parallel rather than perpendicular to bedding which supports previous research by Jacops (2018). Possibly of greater relevance is the correlation between diffusion coefficient and intrinsic permeability (Figure 8(A)). While there is some noise in the data, as would be expected with natural materials, the BC data, when plotted in log-linear space, represented by the red dots on the graph, indicates a linkage between diffusion and pre-test intrinsic permeability likely exists. Jacops (2018) also examined this and other correlations, but no clear relationship was evident at that time. While diffusion is an omnidirectional process, the bias towards higher permeability zones within the clay seems intuitively correct as gas, like water, will find it easiest to move within larger pores. Similar log-normal relationships were also reported for BC linking changes in permeability to changes in effective stress caused by the application of the test hydraulic gradient (Horseman and Harrington, 1994).
The coupling between diffusion coefficient and permeability is also demonstrated in the synthetic sample data which enables the relationship to be extended across three orders of magnitude. The synthetic sample data shows that mineralogy, diffusion coefficient, and permeability appear to be fundamentally linked, and by changing the mineralogy the transport coefficients of the material are altered. As mineralogy and composition are controlled in the synthetic samples, the dispersion in the data around the trend line shown in Figure 8(a) is reduced. The fact that the two trend lines have similar gradients suggests the same processes governing flow are occurring in each sample and that the synthetic sample approach is a legitimate way of exploring fundamental couplings.
The offset between the two trend lines in Figure 8 suggests the compaction pressure may have been a little high when preparing the synthetic samples. While this speaks to the possible importance of compaction/burial history and its influence on permeability and diffusion coefficient, this was beyond the scope of this study. Indeed, as the gradients between the two datasets are so similar and the synthetic sample data extends beyond the likely range of permeabilities that might be encountered in the BC formation, then it seems reasonable that the trendline derived for BC could be partially extended (representing the distribution of permeability values for the BC) to predict likely values of the diffusion coefficient for a given permeability. That said, such extrapolation would need confirmation through reference testing of formation outliers to verify if the coupling between diffusion coefficient and permeability remained consistent with the existing data.
However, if one was able to define the distribution in permeability values for hydraulic flow (in any direction) within an unlithified material, then the synthetic sample approach could be used to quickly and accurately define the likely coupling between diffusion and permeability across the likely range of compaction states and mineralogical compositions. Obviously, such relationships would only hold true over certain ranges of mineralogical composition and compaction states, but it could provide a route to bound diffusion coefficients and reduce uncertainty. This is demonstrated in Figure 8(b) where data from the test performed on the Eigenbilzen Sands has been added and the graph replotted, this time plotted with logarithmic scales. The in situ value plots in the top right of the graph, well beyond the ranges of the BC and synthetic samples and is anomalous to previous values for ES(Jacops et al., 2020), suggesting something may have been wrong with the material tested. However, when the sample was compacted to the target depth of 400 m, the permeability and diffusivity drop considerably and are more in line with the BC and synthetic sample datasets. When viewed in this way across multiple orders of magnitude, the noise in the experimental data is compressed somewhat, and the ES and BC data can be represented by a single power law function. However, while this suggests some commonality between the two datasets and the processes occurring therein, great care must be exercised in the application of such broad extrapolations, which require additional experimental verification before they can be used. But, such an approach suggests commonalities exist in the factors controlling diffusivity for these two lithologies and could provide a possible framework to predict diffusivity across a sequence with only a prior knowledge of permeability.
While the coupling between intrinsic permeability and diffusivity is clear (Figure 9), the diffusion coefficient is not strongly sensitive to large changes in permeability. Indeed, the data in Figure 9 clearly shows that intrinsic permeability can vary by multiple orders of magnitude, while diffusivity varies by only one. This is important as it demonstrates diffusion is not highly sensitive to any of the measured parameter from this study and while correlations with intrinsic permeability exist, the former is not highly dependent on the latter.
In Figure 9, a selection of parameters are plotted against measured diffusion coefficients to see if substantive correlations exist. Except for (a), the residual values from linear regression of each dataset suggest, at best, parameters are only weakly related. Inverse correlations possibly exist between diffusivity, sand content and bulk density, though this may reflect the limited range of material compositions examined in this study. It should also be noted that pre-test bulk density values will be influenced by the degree of saturation of the start material. As bulk density within a specific facies will also be linked to compact state, it seems likely that diffusion values may also vary with burial history. This is potentially seen in Figure 8(a) and may account for the offset observed between the natural and synthetic sample lines. The strong coupling seen in Figure 8(b) also alludes to the likely coupling between bulk density (which would increase with depth) and the diffusion coefficient.
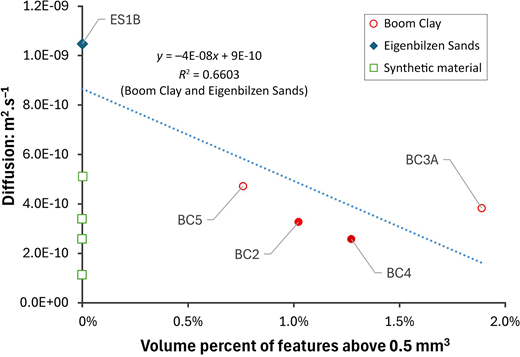
The presence of open micro fractures had little impact on the measured value of diffusivity. It therefore seems likely that these features closed on restressing of the sample at the start of testing. In such circumstances, the data point for BC3 in Figure 10 would move to the left, towards BC5, potentially improving the correlation. However, it is questionable if this degree of crack closure would occur without the application of the boundary stress. If correct, then this observation might help explain some of the noise and weak correlation to intrinsic permeability reported by previous authors. That said, for this to impact measured values of diffusivity, a network of crack(s) which bypass a significant portion of the matrix porosity would be necessary. More work is therefore necessary to improve correlations and better understand the connection between diffusion and material structure.
The fact that intrinsic permeability and diffusivity are clearly linked, while other mineralogically based characterisations yield, at best, weak correlations, indicates diffusion and permeability are not solely governed by mineralogy. Fabric, pore morphology, and tortuosity therefore emerge as likely key factors in controlling the amount of gas (and water) which can move through a sample. While mineralogy will play a key role, the data indicates fabric, rather than composition, is more important.
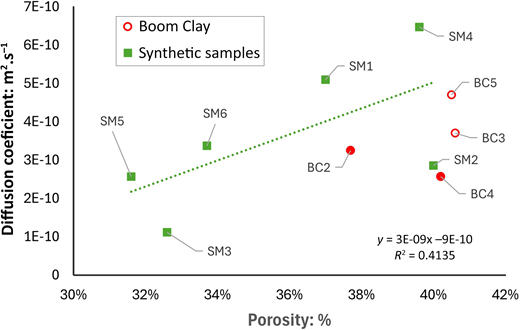
This is alluded to in Figure 11. Here estimated values of porosity are plotted against diffusion coefficients for both BC and synthetic samples. While the coupling of diffusion to porosity for BC appears quite poor, the synthetic samples show a much stronger correlation. Indeed, if SM2 and SM3 were removed, then a near-perfect correlation emerges, with an R2 value of 0.997. As it is, it seems likely that the data presented in Figure 11 reflects a broader, less well defined, coupling between porosity and diffusivity, where changes in pore geometry and interconnectivity within individual samples likely account for part of the dispersion in data. Again, this demonstrates the usefulness of synthetic samples in identifying fundamental relationships and highlights the difficulty of identifying single correlators for diffusion in natural materials.
While the importance of fabric feels intuitively correct (Hommel, et al., 2018; Bernabé et al., 1982; Bernabé et al., 2003; Bernabé et al., 2010; Hommel, et al., 2018), corroborating data from this study is limited. Analysis of XCT data for natural samples of BC also hints at a weak correlation between diffusivity and the volume fraction6 expressed as a percentage of features greater than 0.5 mm3. While this quantity is arbitrary, it provides an indication of the possible influence of bioturbation and pore fabric (Figure 12). The inverse correlation between the diffusion and the volume of features greater than 0.5 mm3 indicates these features, clearly visible in the XCT images (see Supplementary Section), are less conductive than the surrounding matrix. Examination of such features by Jacops et al. (2020) found them to be filled with pyrite explaining the reduction in the apparent diffusion coefficient observed in this study. However, it is worth noting that the same study also looked at such features in the ES and found them to be quartz filled which may enhance diffusion.
Pre-test XCT images of sample BC3 indicate differences between this sample, and other samples analysed in this study. In Figure 12, images of BC3 and BC5 (both cut parallel to bedding) are compared. Sample BC3 contains an overall feature content of 2.8% compared to 0.9% in BC5 (Table 6). Features within BC3 also show significant preferential orientation best shown in Figures 12(B) and (C). In contrast, such features are poorly defined within sample BC5 (B)–(D). BC3 was also the only sample prior to testing to contain open fractures, noted in Figure 12 FPR-21-028 (A), (E) and (F). As BC1, BC3 and BC5 all have similar permeability values, but dissimilar feature ratios, the impact of the number and density of burrow features on permeability is inconclusive.
In previous studies such as those by Jacops et al. (2020), the diffusion coefficient was measured using a through-diffusion approach, that is, measuring changes in dissolved gas concentrations either side of a sample, rather than the in-diffusion approach used in this study. Understanding the impact of both methodologies on the measured diffusion coefficient and whether changes in methodology can account for the weaker correlation to intrinsic permeability noted by Jacops is therefore important. Future work is therefore required to assess the role of methodology on the measured diffusion coefficient to allow accurate comparison of data.
Summary
For the first time, the diffusion coefficient of helium has been measured on samples of BC stressed under isotropic conditions to an equivalent depth of burial of 400 m. A robust methodology has been developed to determine the intrinsic permeability and gas diffusion behaviour of both natural and synthetic samples under representative repository (stress) conditions. A new procedure to manufacture synthetic samples was also developed which can be used to explore fundamental couplings between material properties without the added complications of natural heterogeneity.
Synthetic and natural Boom samples exhibited commonalities in behaviour with both showing a pronounced coupling between intrinsic permeability and diffusivity. Diffusion of helium was shown to occur preferentially with ≈60% of the diffusional capacity of BC moving parallel to the bedding planes. BC and synthetic samples exhibited semi-log relationships between diffusivity and intrinsic permeability, suggesting commonality in the factors controlling advective water flow and gas diffusion. Replotting BC data on a logarithmic scale to include values for the ES showed both fell on a common projection. However, the importance of such a correlation, spanning several orders of magnitude changes in permeability is uncertain, and more data is required to validate the trend. However, it demonstrates that with a knowledge of intrinsic permeability it is possible to estimate diffusivity which is far harder and more complicated to accurately measure.
Detailed pre- and post-test characterisation of test material highlights the difficulty of identifying single correlators for diffusion in natural materials as well as the difficulty of contextualising parameters to better understand heterogeneity.
The potential of synthetic samples as a tool for the identification and quantification of parameters and processes has been demonstrated and the data is of use in repository scenarios. While diffusivity is coupled to intrinsic permeability, the diffusion coefficient is not strongly sensitive to large changes in permeability, varying only by one order of magnitude in this study.
Acknowledgements
Firstly, the authors would like to thank Dr Séverine Levasseur for her patience with the submission of this manuscript. The authors would also like to thank Humphrey Wallis, Wayne Leman, and the members of the BGS Research and Development workshops for design and manufacture of the apparatus, the Core Scanning Facility (CSF) at the British Geological Survey (BGS) for providing access to the XCT core scanner and their technical support and expertise, and Monty Pearson for help with the mineralogical characterisation of the samples. Funding for the study was provided by the European Union’s Horizon 2020 research and innovation programme under grant agreement no. 847593, with co-funding from BGS, RWM (now-NWS), Ondraf-Niras, and COVRA. This paper is published with the permission of the Director of the BGS.
This unit had a measurement span of 100 kPa, giving a pressure accuracy of <0.1 kPa.
This was implemented after the initial test following detailed characterisation of the Teflon sheath.
Cumulative flows measured during intrinsic permeability and gas diffusion measurements ranged from >35,000,000 to 110,000 nl. This means the error in the cumulative flow data was extremely small.
‘Impurities’ in the bentonite and kaolinite source materials combined with errors associated with XRD apportioning of each phase explain the differences between the target and measured mineralogical values quoted.
Note, SCK-CEN independently measured the same combination of materials using their in-diffusion setup and obtained a value of 4.0 × 10⁻¹¹ m2.s−1, Pers. Comm. Jacops (2025), very close to the values measured by BGS.
Note, plotting percentage values removes any variability which would be introduced as sample volume varies between tests.