

This paper presents the Canadian Nuclear Safety Commission’s modelling of coupled thermal, hydraulic and mechanical (THM) processes and their influence on the performance of the engineered barrier system (EBS) and the host rock. The coupled THM processes were monitored during a heater experiment called HE-E, performed in an Opalinus Clay formation at the Mont Terri Rock Laboratory in Switzerland. The HE-E experimental set-up consisted of two EBS sections emplaced in an existing tunnel of the Underground Rock Laboratory. This paper focuses on the model development, parametric analysis, model calibration and verification with the field test data. The influence of THM processes on the EBS and host rock performance and the implications on the design and safety assessment of geological disposal repository systems are discussed.
Notation
stiffness tensor for the porous media
- C
specific heat capacity of the porous medium (J/(kg K))
- Cm
specific moisture capacity given by the slope of moisture variation with suction (Pa−1)
- Datm
free diffusion coefficient of water vapour in the atmosphere (m2/s)
- Dpv
diffusivity of water vapour under pressure gradient (m2/(s Pa))
- DTv
diffusivity of water vapour under thermal gradient (m2/(s K))
- Dv
vapour diffusion coefficient (m2/s)
- dT
temperature change (K)
- E
Young’s modulus (Pa)
acceleration of gravity (m/s2)
- I
{1/3,1/3,1/3,0,0,0}
permeability tensor (m2)
- ks
intrinsic permeability at full saturation (m2)
- l
another constant of the van Genuchten model for water retention characteristics
- M
molecular weight of water
- n
porosity
- p
pore pressure (Pa)
- pc
matric suction (Pa)
- Q
heat source term (W/m3)
- qv
rate of vapour diffusion (kg/s/m2)
- R
ideal gas constant
- RH
relative humidity
- Rv
gas constant for vapour
- S
storage term defined by (Pa−1)
- Se
effective liquid water saturation
- T
temperature (K)
- Tx
thermal expansion coefficient (K−1)
- t
time (s)
- v
Poisson ratio
- α
Biot’s coefficient
- αw
constant of the van Genuchten model for water retention characteristics (m−1)
- β
coefficient of volumetric thermal expansion for the solid skeleton (K−1)
- βs
coefficient of thermal expansion of the grains (K−1)
- βw
coefficient of thermal expansion of the pore fluid (K−1)
strain tensor
- ϵv
volumetric strain
- κT
heat conductivity of the porous medium (W/(m K))
- μ
dynamic viscosity of the pore fluid (kg/(m s))
- ρa
water vapour density (kg/m3)
- ρb
bulk density of the porous medium (kg/m3)
- ρl
liquid water density (kg/m3)
- ρv
vapour density
- ρvs
saturated vapour density
- σ
total stress (Pa)
- σ′
effective stress (Pa)
- τ
tortuosity factor
- χa
water vapour compressibility defined by (Pa−1)
- χf
fluid compressibility (Pa−1)
- χs
solid compressibility (Pa−1)
Introduction
Many countries that use nuclear power for the production of electricity, including Canada, are currently considering the disposal of radioactive wastes in deep geological formations. Geological disposal relies on multiple barriers – for example, engineered clay barriers and thick layers of natural sedimentary rocks – to contain and isolate the radioactive wastes for very long periods of time. The long-term performance of those barriers is crucial to the safety of the geological disposal system and is therefore investigated collaboratively by interdisciplinary researchers.
Experiments on thermal–hydraulic–mechanical (THM)-coupled processes have been reported since the 1990s, including small-scale laboratory column tests (Chijimatsu et al., 2000; Nguyen and Selvadurai, 1997; Pintado et al., 2011; Schanz et al., 2013; Selvadurai, 1996) and large-scale in situ mock-up tests (Gens et al., 2009; Villar and Lloret, 2004). The heating within the clay barrier is always coupled with the infiltration of water to mimic the inflow of groundwater from the surrounding host rock, resulting in a non-linear evolution of the mechanical response of both the clay barrier and the host rock (Holton et al., 2012; Thomas et al., 2014). Multiphase flow in compacted bentonite has been the focus of intensive experimental investigations focusing on the water retention characteristics, the intrinsic permeability and the relative permeability (Chijimatsu et al., 2000; Cho et al., 2009; Pintado et al., 2011; Schanz et al., 2013; Selvadurai, 1996, 2002). The primary parameters that are monitored generally include temperature, relative humidity/suction, water content, pore pressure and stress. Differences among these experimental studies mainly involve the heater size and the barrier thickness, as well as the type of clay minerals, the host rock and the salinity and composition of the infiltrated water. In the meantime, vapour transport in bentonite has been found to be predominant for water movement under thermal gradients (Gens et al., 2009; Hökmark et al., 2007; Kröhn, 2005, 2010). The present study deals with the HE-E heating test performed at the Mont Terri Rock Laboratory located in an argillaceous rock formation in Switzerland. Preliminary studies on the same set of data showed significant discrepancy between modelling and experimental results with respect to temperature and moisture evolutions (Gaus et al., 2014). In order to improve the simulation of the moisture movement in the clay buffer, a thermal enhancing factor was considered in the present study to reflect the enhancement of thermal water vapour diffusion in porous media (Cass et al., 1984). The introduction of this enhancement factor, as well as its calibration with a laboratory column experiment, proved to be critical to the authors’ success in achieving better agreement with the experimental observations in the HE-E test.
The modelling of THM-coupled processes has been developed simultaneously with the experimental studies. A recent study by Chijimatsu et al. (2009) compared some of the most up-to-date THM-coupled models, describing both the relevant governing equations and the modelling results against the same set of test data. Owing to the complexity in both the physics and the characterisation of the material properties, different assumptions in the conceptual model, constitutive relationship and choice of parameters contribute to the discrepancy in the modelling output (Rutqvist et al., 2005a, 2005b). Of all the primary variables, temperature proved to be the easiest parameter to predict since it was conduction dominated owing to the low permeability of the material under consideration and it was not significantly impacted by HM coupling (Rutqvist et al., 2005b). The interaction between the clay barrier and fractured granitic rocks has been well investigated (Holton et al., 2012; Rutqvist et al., 2005b; Thomas et al., 2014; Zheng et al., 2010). The hydraulic conductivities of fractured rocks can be several orders of magnitude higher than those of intact rocks (Massart and Selvadurai, 2014; Selvadurai, 2002). Therefore, in the former case, the resaturation of the buffer can be much shorter (Rutqvist et al., 2005b). The resaturation of the buffer results in the swelling of the clay mineral, leading to: a significant increase in confining stress on the tunnel wall; a significant decline in fracture permeability (Selvadurai, 2015); and an increase in pore pressure in the host rock (Rutqvist et al., 2014). Fewer studies are available for clay barrier/rock interaction in argillaceous rock, such as the one being explored in the present work. A recent such study by Rutqvist et al. (2014) showed that this issue is unique in certain respects. In particular, the low permeability of the argillaceous rock and its inherent anisotropy due to bedding can greatly influence the THM evolution of the clay barrier and, in particular, the time for its resaturation.
The Canadian Nuclear Safety Commission (CNSC) is the nuclear regulator in Canada and will ultimately be responsible for the approval and licensing of current and future geological repositories proposed in Canada. CNSC licensing decisions must be based on science-based arguments on the safety of the proposed facilities. To develop and maintain its expertise, the CNSC participates in collaborative projects with international partners in multidisciplinary projects such as the ones described earlier. This paper presents an example of such collaborative efforts. It describes the development of a mathematical model to simulate the coupled THM processes in a heating experiment called HE-E performed in an argillaceous rock formation, known as Opalinus Clay, at the Mont Terri Rock Laboratory in Switzerland. Field data from the HE-E experiment recorded over a period of 3 years were compared with the results of the THM-coupled model developed by the authors. A long-term simulation (11 000 years) was also conducted to simulate the gradual progress of the resaturation of the clay barriers with groundwater permeating from the host rock.
Description of the HE-E experiment and the laboratory column tests
The HE-E experiment was performed in a microtunnel of the Mont Terri Rock Laboratory (Figure 1). In the HE-E experiment, two sections were isolated in a microtunnel previously excavated in Opalinus Clay. Bentonite pellets (B) were emplaced in one section and sand/bentonite (S/B) mixture in the other. Electric heaters were enclosed in each section. The heaters were subsequently powered at controlled temperature or controlled power output. The experiment was designed to simulate the heat released from waste canisters and its impact on moisture, temperature, deformation and pore pressure evolution inside the engineered barrier system (EBS) and across the EBS–host rock interface. Those parameters were continuously monitored during the experiment.
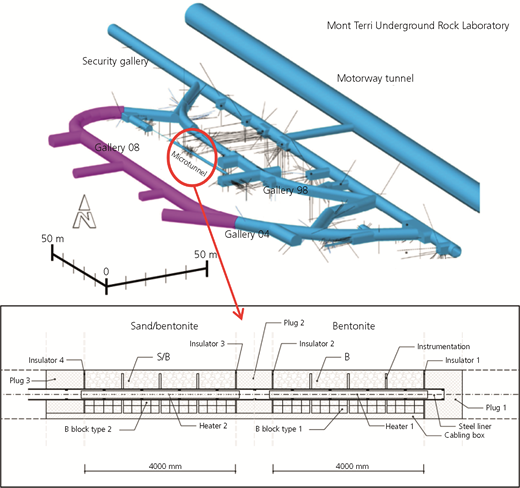
The design parameters, as-built information, geoscientific data and preliminary monitoring data of the HE-E experiment were reported by Gaus et al. (2014). The complete set of experimental results was provided by Nationale Genossenschaft für die Lagerung Radioaktiver Abfälle (Switzerland), through the international collaborative project Decovalex (2017) that aims to develop and validate coupled models for the safety and performance assessment of deep geological repositories for nuclear wastes.
Prior to the HE-E experiment, two small-scale laboratory column tests (Villar et al., 2012) were conducted to determine the THM-coupled behaviour of the EBS used in the HE-E field test (Figure 2). Bs were used in one test, and an S/B mixture was used in the other. The Bs and S/B mixture had the same predetermined optimum water content and target density as the material used in the HE-E experiment. The columns had a height of 50 cm and a diameter of 7 cm. The EBS material was compacted into a Teflon column, which was wrapped with thermal insulating materials. Three integrated sensors capable of measuring both the relative humidity and temperature were installed at different depths to monitor the evolution of temperature and relative humidity. Heat was supplied at the bottom of the column with fixed temperatures of 100°C (t < 2500 h) and 140°C (t > 2500 h) while constant temperature (ambient temperature at around 20–21°C) was maintained at the top. The temperature of the heater is uniform in the cross-section. The columns were laterally insulated with a 5 mm thick dense foam, which was changed to a 30 mm thick insulation wool after 1566 h, and again modified after 1666 h by adding a 25 mm thick Isover BT-LV insulation for a length of 8 cm from the bottom of the column.
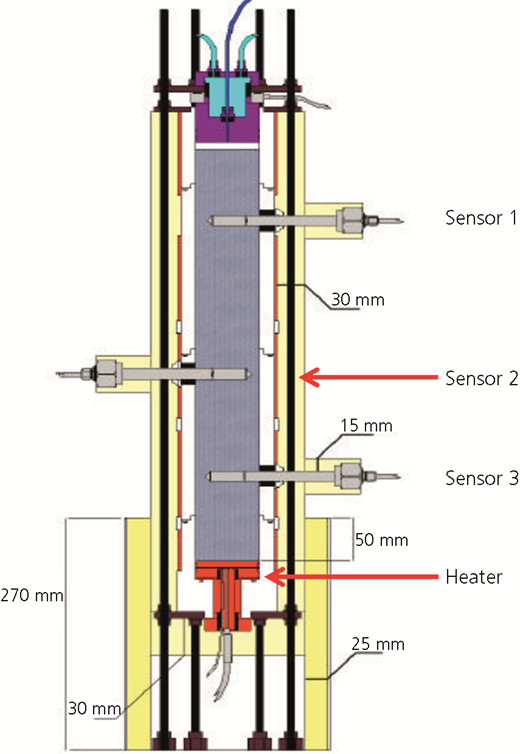
Laboratory column test on the bentonite-based EBS material with relative location of sensors for temperature and relative humidity
Laboratory column test on the bentonite-based EBS material with relative location of sensors for temperature and relative humidity
Theories on THM-coupled models
Conceptualisation
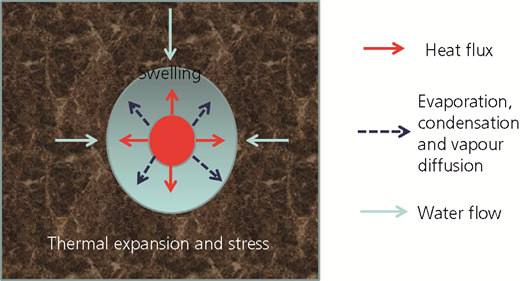
Figure 3 shows the authors’ conceptualisation of the physical processes that take place in the HE-E experiment. First, it is assumed that both the EBS and the host rock can be idealised as porous media, where the pores are filled with liquid water, water vapour and air. At the start of heating, the rock is saturated with liquid water, except for a thin zone around the emplacement tunnel where ventilation partially desaturates the pores. The EBS was emplaced in an unsaturated state – that is, the pores are filled with a mixture of liquid water, water vapour and air. When the heaters are powered, a heat flux is induced outwards, resulting in an increase in temperature in both the EBS and the rock, with higher temperatures closer to the heater. The increase in temperature results in thermal stress and strain in both media. Additionally, it induces the evaporation of liquid water near the heaters, which migrates outwards and condenses at lower temperatures. In the EBS, resaturation also induces swelling. The host rock is mainly saturated; therefore, pore water flows from regions of higher to lower pore pressure. Prior to heating, flow is towards the emplacement tunnel. After heating, the pore pressure increases near the periphery of the emplacement tunnel, due to the differential in the thermal expansion between the pore water and the solid skeleton. This would induce a transient outward flow, until the thermally induced pore pressure dissipates.
Coupled governing equations
The mathematical model was developed based on the previous conceptualisation within the framework of the classical theory of poromechanics, using an approach similar to that of Nguyen and Selvadurai (1995), Rutqvist et al. (2001) and Nguyen et al. (2005). The fundamental principles that were invoked in order to develop the governing equations of coupled THM processes were conservation of mass, conservation of energy and conservation of momentum. In addition, the following main assumptions were made.
The geological medium is conceptualised as a porous medium.
Only heat is considered in the energy balance equation. Thermal equilibrium is assumed between the solid and liquid phases. Furthermore, heat transfer occurs only by conduction.
The water in the pores can exist in a liquid and/or gaseous (vapour) phase. It is assumed that water vapour pressure remains constant at atmospheric pressure.
In the EBS, the flow of liquid water is by advection and is assumed to follow Darcy’s law, while the vapour flow is by diffusion. The rock is saturated or nearly saturated; therefore, vapour flow is neglected in the rock.
A modified Biot’s effective stress principle is assumed
1where
2The storage term for water vapour is negligible compared to that of liquid water because the density of water vapour is very small compared to that of liquid water, by six orders of magnitude (Rutqvist et al. 2001).
The resulting governing equations of heat, mass and momentum conservation (or equation of equilibrium, since dynamic effects are neglected) are as follows
equation of heat conservation
equation of water mass conservation for the rock
equation of water mass conservation for the EBS
equation of equilibrium in the rock
equation of equilibrium in the EBS
In the present work, both the host rock and EBS are assumed to be elastic. The properties of the host rock in terms of thermal conductivity, permeability and elasticity matrix are, however, assumed to be transversely isotropic, with principal directions parallel and perpendicular to the bedding orientation.
Vapour diffusion in the EBS
The derivation of the diffusivity coefficients in Equation 5 is provided in the following. It is assumed that in the EBS, liquid water migrates by advection and obeys Darcy’s law, while water vapour migrates by diffusion. The rate of vapour diffusion is given by Philip and De Vries (1957) as
with the vapour diffusion coefficient D v expressed as
By differentiation, the gradient of vapour density could be decomposed into two components that are dependent on the gradients of pore pressure and temperature as
Philip and De Vries (1957) expressed the vapour flux in the form of
where the diffusivity coefficients D pv and D Tv are expressed as
In Equation 13, R H is the relative humidity and f Tv is a thermal enhancing factor for vapour diffusion (Rutqvist et al., 2001).
Parameters, numerical models and modelling approach
Fundamental parameters
EBS materials
Villar et al. (2012) reported the details of the EBS materials that were tested in the HE-E heating test. In one section of the HE-E experiment, an S/B mix at a ratio of S:B = 65:35 is emplaced together with bentonite blocks. The bentonite used in the S/B mix is a natural sodium bentonite from Wyoming (MX-80). Both the quartz sand and sodium bentonite have the same grain size distribution in the range of 0·5–1·8 mm, which was obtained by crushing and sieving from the qualified raw material. Water content was 13% for the bentonite and 0·05% for the sand, giving an equivalent water content of the mixture in the range of 4%. Granular B and bentonite blocks are used in the other section of the test; the sodium bentonite is also from Wyoming. Once emplaced, its water content was 5·9% and the dry average density was 1460 kg/m3.
Retention curves and thermal conductivity
Figure 4(a) shows the water retention characteristics of B, S/B and Opalinus Clay. Brooks–Corey and van Genuchten models (Villar et al., 2012) are used to fit the experimental characteristics. Figure 4(b) shows the non-linear thermal conductivities of the two EBS materials – that is, S/B and B. Figure 4(c) shows the non-linear Se-dependent thermal diffusion enhancement factor for EBS materials due to the localised thermal gradient enhancement of vapour in porous media (Philip and De Vries, 1957). Other fundamental parameters are listed in Table 1. The input parameters were estimated from a combination of the published data as cited earlier and the calibration of the laboratory column tests is reported next.
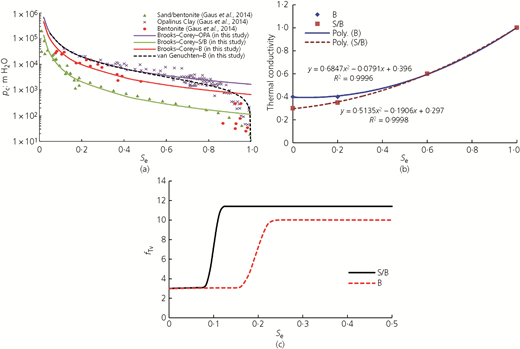
Dependence of various parameters with saturation degree for S/B and B: (a) matric suction, (b) thermal conductivity and (c) diffusivity enhancement factor fTv
Dependence of various parameters with saturation degree for S/B and B: (a) matric suction, (b) thermal conductivity and (c) diffusivity enhancement factor fTv
Fundamental parameters for the numerical simulation
| Parameter | S/B | B | Opalinus Clay | B block | Plug | EDZ |
|---|---|---|---|---|---|---|
| Physical properties | ||||||
| Grain density: kg/m3 | 2546 | 2700 | 2700 | 2700 | 2650 | 2700 |
| Dry density: kg/m3 | 1383 | 1513 | 2330 | 1806 | — | 2330 |
| Porosity | 0·47 | 0·45 | 0·12 | 0·33 | 0·15 | 0·14 |
| Initial saturation (suction): MPa | 0·11 (122) | 0·2 (93·7) | 1 | 0·63 | 0·04 | 1 |
| Biot’s coefficient | 0 | 0 | 0·75 | 0 | 0 | 0·75 |
| Mechanical properties | ||||||
| E: MPa | 18 | 18 | 8000/3000** | 24 | 3·30 × 104 | 3·00 × 103 |
| v | 0·35 | 0·35 | 0·33/0·29** | 0·2 | 0·3 | 0·29 |
| G: MPa | — | — | 3225/1000** | — | — | — |
| Diffusivity | ||||||
| fTv: m2/s | Figure 3 | Figure 3 | 3 | 3 | ||
| τ | 0·5 | 0·5 | 0·5 | 0·5 | ||
| χp: Pa−1 | 1·00 × 10−7 | 7·50 × 10−8 | 1 × 10⁻⁹ | 7·50 × 10−8 | 6 × 10⁻¹⁰ | 1 × 10⁻⁹ |
| ks: m2 | 1·00 × 10−19 | 1·00 × 10−21 | 2·5 × 10−20/6·2 × 10−21** | 2·50 × 10−21 | 1 × 10⁻²⁰ | 5 × 10⁻¹⁹ |
| Brooks–Corey | ||||||
| αw: m−1 | 8·92 × 10−3 | 5·00 × 10−3 | ||||
| n | 0·55 | 0·36 | ||||
| l | −1·370 | 5·500 | ||||
| van Genuchten | ||||||
| αw: m−1 | 5·5 × 10−4 | 5·0 × 10−3 | 6·0 × 10−04 | 2 × 10⁻³ | ||
| n | 1·67 | 1·67 | 1·67 | 1·67 | ||
| l | 2 | 2 | 2 | 2 | ||
| Thermal properties | ||||||
| Thermal expansion Tx: K−1 | 2·50 × 10−5 | 2·50 × 10−5 | 1·7 × 10−5 | 1·7 × 10−5 | 1·5 × 10−5 | 1·7 × 10−05 |
| Thermal conductivity wet: W/(m K) | 1·30 | 1·30 | 1·77/0·98** | 1·9 | 1·4 | 1·96 |
| Thermal conductivity dry: W/(m K) | 0·35 | 0·35 | — | 1·3 | 0·5 | — |
| Specific heat: J/(kg K) | 800–1500 | 800–1500 | 946·5 | 995 | 1000 | 946·5 |
| Initial conditions | ||||||
| Initial pore pressure: Pa | −9·3 × 107 | −1·25 × 108 | 1 × 10⁶ | −9·3 × 107 | −9·3 × 107 | 1 × 10⁶ |
For Opalinus Clay, the parameters marked ‘**’ indicate anisotropy in terms of the component parallel to bedding/component perpendicular to bedding
Calibration of column heating tests
Finite-element models were developed for the column heating tests for both S/B and B columns. The governing equations, with boundary and initial conditions as described next, were numerically solved using the commercial Comsol multiphysics finite-element software (version 4.3b). Boundary conditions included constant temperatures at both the bottom and top boundaries and a variable heat leakage flux for the side-wall to represent the change in insulation. Detailed experimental parameters for this series of column tests can be found in a separate paper (Villar et al., 2012). The initial conditions for temperature, moisture content and porosity were set as determined by experiment. Figures 5(a)–5(d) show the comparison between modelling results of temperature and relative humidity (RH) and the monitored data of the laboratory-scale column tests. Evolutions of both temperature and RH with time are found to be consistent with the experimental observations. Significant temperature shift takes place in the soils column immediately when the source temperature of the heater is increased. The fluctuation is more obvious in regions closer to the heater as a result of the heat diffusion. The moisture movement is dependent on both temperature and suction gradient. As a result, the peaks in RH of sensor 3 as shown in Figures 5(b) and 5(d) are mainly due to temperature shift, which, although increasing temporarily in magnitude, diminishes quickly due to the re-equilibration of the matric suction. For zones far away from the heating source (i.e. sensor 1), RH is found to climb up continuously, which is attributed to two factors, (a) the impermeable boundary condition and (b) the cooler heat sink of the top end. The discrepancy in RH for sensor 1 of S/B column is caused by experimentally introduced disturbance to the top boundary, where water leakage into the soil column has happened unintentionally for a short period of time. As for column B, which has maintained ideal boundary conditions throughout the test, the modelling gives a perfect match to the observed RH values. The authors’ model demonstrates very good agreement with test data, suggesting a successful model calibration. The model constants are thus regarded as representative of the tested samples. Due to the high degree of similarity in the EBS preparation process, these parameters are further applied to the simulation of the field case.
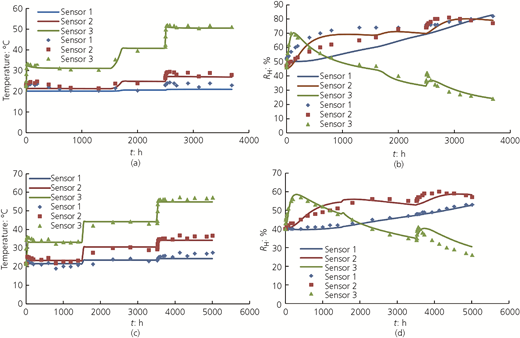
Comparison of modelled and test results of (a) temperature in S/B, (b) RH in S/B, (c) temperature in B and (d) RH in B (scattered diamonds, squares and triangles are test data and the solid lines are modelling results)
Comparison of modelled and test results of (a) temperature in S/B, (b) RH in S/B, (c) temperature in B and (d) RH in B (scattered diamonds, squares and triangles are test data and the solid lines are modelling results)
Finite-element model for the HE-E experiment
A three-dimensional (3D) finite-element model (FEM) was developed for the HE-E experiment, assuming symmetry along the vertical plane running through the axis of the microtunnel. The main features of the FEM are shown in Figure 6. The cross-sectional view of the filled tunnel is shown in Figure 6(b). The tube-like feature surrounding the EBS is a thin layer of excavation-induced damage zone (EDZ) with a radial thickness of 60 cm that is equivalent to the radius of the excavated tunnel. The EDZ around the tunnel is dependent on the stress condition and fabric structure, would likely be non-uniform in shape and possess anisotropic mechanical and hydraulic properties. However, the EDZ was not thoroughly characterised; therefore, for simplicity, the authors assumed its characteristics to be uniform and isotropic. The host rock outside the EDZ was thoroughly characterised. It is inherently anisotropic due to the bedding orientation; therefore, anisotropic hydraulic and mechanical properties as shown in Table 1 were used. The trace of the bedding plane is perpendicular to the microtunnel axis and dips with an angle of 40° towards the south (Figure 6(c)).
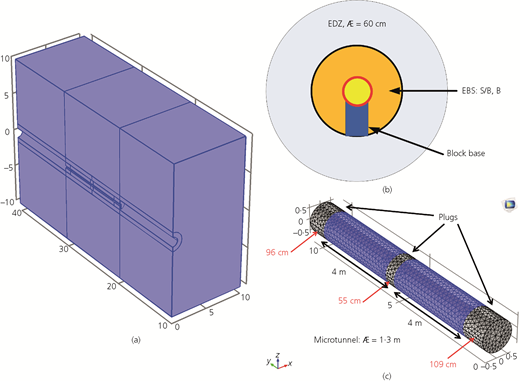
Schematic diagram showing the features of the FEM for the HE-E experiment: (a) the 3D geometry included in the model, (b) the microtunnel cross-section and (c) components
Schematic diagram showing the features of the FEM for the HE-E experiment: (a) the 3D geometry included in the model, (b) the microtunnel cross-section and (c) components
The in situ stress was estimated as (Gaus et al., 2014)
The initial temperature and pore pressure in the rock are 15·75°C and 1 MPa, respectively. The boundary conditions include fixed temperature and pore pressure for the outer boundaries. The left boundary (i.e. x = 0) is a symmetrical boundary for all THM processes (i.e. zero water and heat flux and zero normal displacement).
Modelling strategy for field scale tests
The modelling replicates the three phases of the experimental test sequence: excavation followed by partial desaturation (10 years), emplacement (70 d) and heating (3 years).
Excavation and partial desaturation: To mimic excavation, the boundary load on the tunnel surface that is in equilibrium with the in situ stress was gradually removed. Pore pressure on the tunnel surface was reduced from the initial pore pressure to a suction value equivalent to R H = 95%.
Emplacement: The elements for the EBS were activated in this step to simulate the emplacement inside the tunnel. The EBS was emplaced with varying initial degrees of saturation, with corresponding suction as shown in Table 1. This suction in the EBS would withdraw water from the rock, and the redistribution of pore pressure and suction after the EBS emplacement must be calculated in order to establish the initial conditions for the heating phase.
Heating: In this stage, heat was supplied from the heaters. The boundary condition for the heater–EBS interface was described by thermal fluxes corresponding to the actual power supply (Gaus et al., 2014). The evolution of key variables such as relative humidity, temperature and pressure were continuously recorded at many monitoring points. The analysed heating periods consisted of 960 d until January 2014.
The simulation was also extended into long-term resaturation (11 000 years). The heating power was hypothesised to be shut down after a certain period of time (8 years in this study). The long-term evolution of moisture and temperature during the cooling period was predicted up to the time when full resaturation is achieved.
Results and interpretation
Monitoring points
In the HE-E test, extensive monitoring of temperature (T), pressure (P) and relative humidity (R H) was conducted in both the EBS and the host rock during the heating period. Figure 7 shows the location of temperature and humidity sensors placed inside the EBS materials as well as the convention of the nomenclature. For each EBS section, three cross-sections were designed for monitoring purposes. Only the one located in the centre of the EBS section was used in this study for comparison with the modelling results.
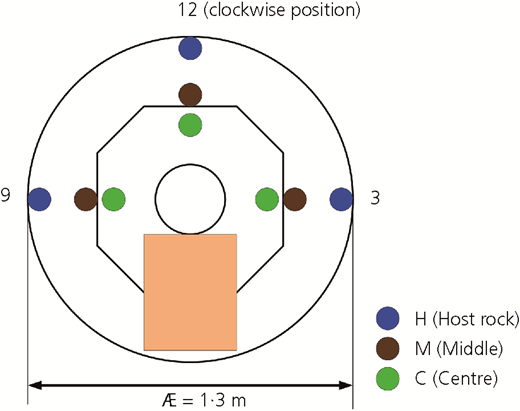
Location of temperature and relative humidity sensors installed inside EBS body for the field experiment
Location of temperature and relative humidity sensors installed inside EBS body for the field experiment
Comparison between modelling results and test data
Temperature data for S/B
Figure 8 shows the evolution of temperature at the monitoring sensors inside the S/B. The experimental results are well reproduced by the model. The temperature at the central position (T-C) is somewhat overpredicted, the one in the middle (T-M) is somewhat underpredicted; however, excellent agreement is found for the point at the interface (T-H) between the EBS and the host rock.
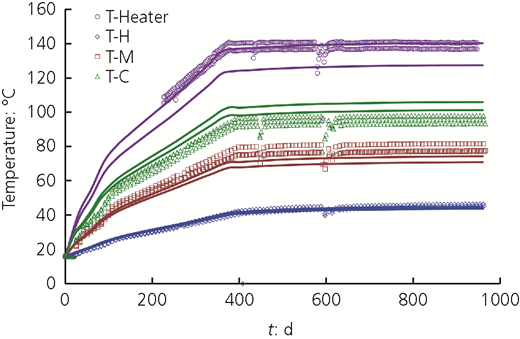
Temperature evolution for monitoring points inside the EBS at the S/B section (open symbols are test data and solid lines are modelling results). T-C, temperature at the central position; T-M, temperature at the middle position; T-H, temperature at the point at the interface
Temperature evolution for monitoring points inside the EBS at the S/B section (open symbols are test data and solid lines are modelling results). T-C, temperature at the central position; T-M, temperature at the middle position; T-H, temperature at the point at the interface
Relative humidity data for S/B
Figure 9 shows the evolution of RH in the S/B section. The modelling results are in good agreement with the experimental data for monitoring points at the EBS–host rock interface, the middle and the central position of the EBS. Note that the authors have modelled the excavation and desaturation stages prior to the emplacement of EBS into the tunnel. The results for these two previous stages of engineering practices are not shown here. Therefore, the simulated RH at the rock–EBS interface t = 0 is overestimated and appears discrepant from the observed data. This may be attributed to the higher estimation of permeability for the EDZ in the tunnel openings. However, the results of the following period of time give a high degree of agreement with test data.
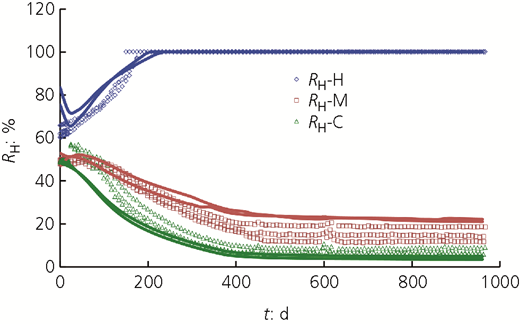
RH comparison for EBS material in S/B section (open symbols are test data and solid lines are modelling results)
RH comparison for EBS material in S/B section (open symbols are test data and solid lines are modelling results)
Temperature data for B
Figure 10 shows the evolution of temperature in the bentonite section. As with the S/B section, excellent agreement is found at the rock interface (T-H) with some discrepancy for the modelling results at the centre (T-C) and middle (T-M) points as compared to the test data. The heat transport process is closely coupled with moisture transport, through the dependence of the thermal conductivity and heat capacity on the effective saturation or moisture content. Therefore, the success in reproducing the moisture profile lays a good basis for best fitting of the temperature profile.
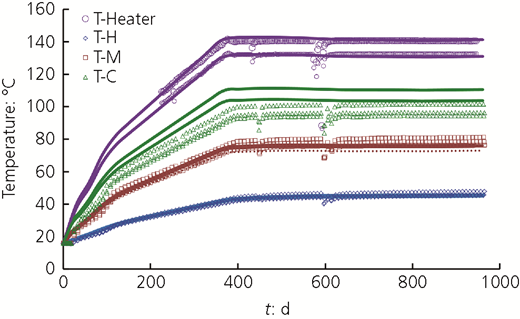
Temperature comparison for EBS material in the B section (open symbols are test data and solid lines are modelling results)
Temperature comparison for EBS material in the B section (open symbols are test data and solid lines are modelling results)
Relative humidity data for B
Figure 11 shows the RH evolution in the bentonite section. Similar to the case for S/B, good agreement is found for points at H, M and C locations. Compared to the S/B section, the RH at H increases much more slowly in the B section. The resaturation of the bentonite near the rock interface is governed by two factors: vapour diffusion from the heat source and fluid infiltration from the surrounding host rock. Since vapour diffusivity characteristics are assumed to be the same for both types of EBS, the slower resaturation of the bentonite is mainly due to its lower permeability. Note that the initial decline of RH for RH-H can be explained by the higher estimation of permeability for the EDZ around the tunnel opening, which resulted in faster water migration towards the EBS.
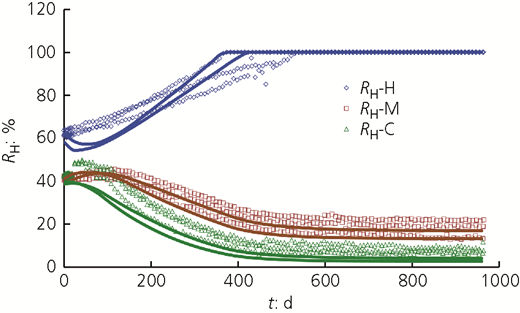
RH comparison for EBS material in B section (open symbols are test data and solid lines are modelling results)
RH comparison for EBS material in B section (open symbols are test data and solid lines are modelling results)
THM coupling phenomena
Figures 12(a)–12(c) show the time variation of R H and temperature along representative profiles perpendicular to the tunnel axis, as shown in Figure 12(c). It is shown that heating induces a drying effect in the EBS near the heater surface. In the S/B, as shown in Figure 12(a), the R H near the heater decreases to a value of 0·05 from an initial value of 0·5. Heating induces outward vapour migration, leading to an increase in R H in the EDZ domain. A steady-state distribution of T and R H seems to be reached after 400 d.
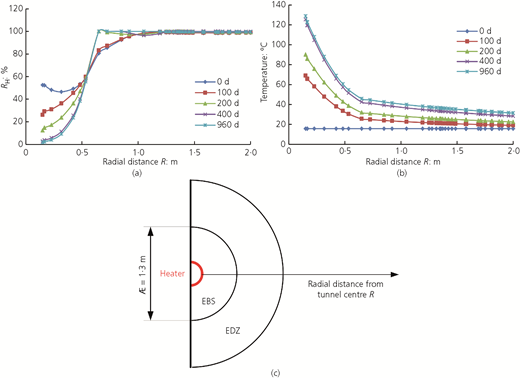
Distribution of various variables (a, b) along the horizontal cut line across the centre of S/B section (c)
Distribution of various variables (a, b) along the horizontal cut line across the centre of S/B section (c)
Figure 12 is intended to show the dynamic evolution of critical parameters – that is, R H and T – in both EBS and host rock. This may reveal the effect of EBS and its thermal conductivity on the accumulated temperature on heater–EBS interface, which has a significant implication for the proper design of EBS in order to maintain a comparatively fast thermal conduction from spent fuel canister towards the host rock. Moreover, the evolution of R H reflects the moisture movement, which is complex in view of the coupled influences of suction and thermal gradients. It is shown that the moisture of EDZ is partly attracted to EBS across the EBS–EDZ interface prior to the start of the heating. But this process turns out to be reversed by the heating. Thermal gradient prevails over suction gradient regarding moisture migration in EBS–EDZ zones.
As shown in Figure 12(b), the heater surface reaches a maximum temperature of about 140°C, while the maximum temperature in the rock is less than 46°C (an increase of 30°C from the background). The temperature increase results in the thermal expansion of the pore water and of the solid skeleton. Due to confinement, thermal expansion is constrained, resulting in the pore water pressure increase near the heat source that gradually dissipates when outward drainage from the heat source progressively takes place. The calculated and measured pore pressure increases at several points in the rock are shown in Figure 13(a). It is shown that the model can reproduce the trends of the pore pressure evolution. The thermally induced pore pressure results from a full coupling of THM processes. In particular, the permeability of the rock and its stress–strain behaviour (as reflected in the value of the Young’s modulus if elasticity is assumed) significantly influence the absolute value and the dissipation rate of the pore pressure (Gens et al., 2007; Selvadurai and Nguyen, 1997). The model underestimated the maximum pore pressure by 30%. One plausible reason for this discrepancy could be the assumption of homogeneity adopted in the model. Opalinus Clay is not perfectly homogeneous, and variations in some of the key parameters discussed earlier can result in significant variations in the pore pressure. In addition, extra swelling pressure can be induced by the increasing saturation of the bentonite at the rock interface. The difference between the observed and the predicted maximum pore pressure could also be attributed to the volumetric swelling of the EBS, which imposed an additional load on the saturated host rock, but was omitted in the present model. In this regard, more sophisticated constitutive models that take into account the swelling of the EBS are being developed by the authors. A thermally induced pore pressure can induce hydrofracturing, when it exceeds the minimum principal stress. In the HE-E experiment, because of the relatively low temperature increase in the rock, the maximum pore pressure reached a value of approximately 1 MPa, while the minimum principal stress is in the 2–3 MPa range. Therefore, hydrofracturing would be unlikely in this particular case.
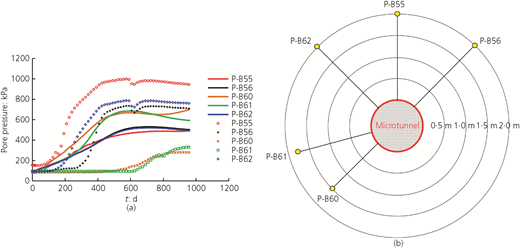
(a) Thermally induced pore pressure in the host rock at the midplane cross-section of B section for various locations and (b) the sensor arrangement in space (marked distance with respect to microtunnel wall)
(a) Thermally induced pore pressure in the host rock at the midplane cross-section of B section for various locations and (b) the sensor arrangement in space (marked distance with respect to microtunnel wall)
Long-term resaturation estimation
Figures 14(a) and 14(b) show the modelling results of the long-term resaturation process that follows immediately the shutdown of the heating source at 7·9 years. It is shown clearly that the temperature profile in the EBS declines rapidly to the background level at 15·75°C. The moisture level quickly becomes equilibrated at R H = 41% within 20 years of post-closure. Since the temperature gradient diminishes, moisture migration may only be dominated by the pressure gradient according to Equations 4 and 5. The resaturation is governed by the host rock as the source of pore fluid in the long-term period. The model predicts that complete saturation (>99·99%) of the EBS would be achieved in 11 000 years.
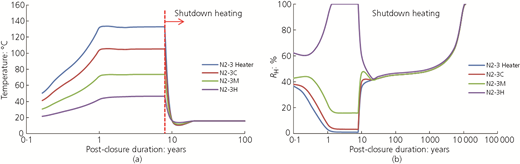
Evolution of (a) temperature and (b) relative humidity in the long-term period along the radial direction for section N2 at the ’3 o’clock’ location
Evolution of (a) temperature and (b) relative humidity in the long-term period along the radial direction for section N2 at the ’3 o’clock’ location
Discussion
In many concepts of geological disposal, the main safety functions of the EBS are to protect the waste container by
providing mechanical support
reducing microbial activity in order to control corrosion
limiting the rate of groundwater flow in its vicinity
dissipating heat from the container.
The swelling potential, the permeability and the thermal properties of the EBS are important indicators for its ability to achieve the safety functions mentioned earlier. Those properties depend on the saturation of the EBS. The drying effects due to heating decrease the thermal conductivity and can result in higher temperatures in the EBS. Heating also can delay the resaturation of the EBS (Millard et al., 2005) and therefore hinders its swelling potential, for a transient period of time. The resaturation time of the EBS also depends on the permeability of the host rock and its capability to supply water to the EBS. The thermally induced pore pressure in the rock can potentially induce hydrofracturing if the pore pressure exceeds the minimum principal stresses. Hydrofracturing was not the case for the HE-E experiment; however, it should be verified for each specific situation. The engineering design and safety assessment of geological disposal systems should take into account relevant coupled THM processes such as the ones discussed in this paper, depending on the specific design and site conditions. Such a consideration can only be reliably performed with the use of THM modelling tools that are extensively verified and calibrated with experimental data.
Conclusions
The HE-E experiment performed at the Mont Terri Rock Laboratory represents a half-scale model of two waste containers/EBS units of the Swiss geological disposal concept. The monitoring data collected during the experiment are invaluable for the understanding of the near-field coupled THM processes in the EBS and near-field rock and for the development of mathematical models to interpret those processes. In this work, the authors have developed a mathematical model that can reasonably simulate the main features of the coupled THM processes, both in trends and absolute values, in particular with respect to the following points.
Heating induces outward vapour migration from the heat source. This results in the drying of the EBS in the vicinity of the heat source. In the test, this drying effect is generalised in the EBS, except at points near the rock interface, where resaturation occurs. The water that is supplied to those points comes from two sources: infiltration from the host rock and condensation of vapour originating from the hotter part of the EBS.
Drying in the EBS results in a decrease of its thermal conductivity, leading to higher temperatures. In the HE-E experiment, maximum temperatures of 140°C were applied at the heater surface, while in the rock, they are limited to 46°C after 900 d of heating.
In the rock, the pore water pressure increases due to its tendency for thermal expansion. The absolute value for this increase depends on the permeability and stiffness of the rock. The pressures would be higher for lower permeability and higher stiffness. In the HE-E experiment, the recorded pressure was lower than 1 MPa, and the calculated pressure was of the same order of magnitude.
Resaturation of the EBS is estimated to take at least 11 000 years before reaching full saturation (>99%) in a shutdown of the heating source following 8 years of maintaining a constant temperature of 140°C on the heater–EBS interface. This long resaturation time is consistent with previous findings (Millard et al., 2005) and is found when the host rock is unfractured and has very low permeability. Should such a long resaturation time be found to be associated with a geological disposal system, the implications on the repository performance should be assessed.
Acknowledgements
This study has been funded by the Canadian Nuclear Safety Commission. The HE-E experiment has received funding from the European Atomic Energy Community’s Seventh Framework Programme (FP7/2007-2011) under grant agreement 249681. Participants in the Decovalex project are also thanked for the many helpful discussions and peer review during the course of this work. Colleagues at the Canadian Nuclear Safety Commission, Dr P. Thompson, Mr A. McAllister and Mr P. Button, are also sincerely thanked for their careful review of this study.

