This article investigates the link between the diversification strategies of Swiss real estate fund portfolios and their financial performance.
Together with the Geneva-based company Conser ESG Verifier, we collected data on 41 listed Real Estate funds and their portfolios, comprising more than 9’000 buildings. We defined spatial metrics, such as distance to headquarters, geographic diversification and linguistic proximity at the building level and aggregated these measures to the fund level. Finally, we applied cross-sectional regressions and categorical and spatial similarity analyses to highlight the differences between funds.
On average, listed Swiss real estate funds tend to hold geographically concentrated property portfolios, with properties close to the fund’s headquarters and predominately in locations where the language aligns with that of the headquarters. Regression results suggest that while funds tend to diversify more as their asset base grows, geographic diversification and the propensity to invest locally do not significantly affect fund returns. Fund returns do, however, tend to increase with fund age and the number of buildings held. Additionally, similarity analysis indicates that Swiss real estate funds are distinct in terms of building types and the spatial distribution of their investments.
This dataset enhances the transparency and comparability of Swiss real estate funds, facilitating future research.
This paper introduces a novel dataset on listed Swiss real estate funds and their portfolio holdings. It demonstrates the link between property characteristics, geographic and linguistic factors and financial performance.
1. Introduction
Switzerland's stability, neutrality, and wealth have positioned it as a haven for international investors seeking secure, long-term investments. At the same time, national investors recognize the country's strong economic foundations and solid market fundamentals. This favorable environment has enabled Swiss real estate funds to successfully attract substantial capital from pension funds, insurance companies, and family offices, both domestically and internationally, looking for reliable, long-term returns. With over CHF 60 billion in assets under management, real estate funds are established key players in the Swiss real estate (RE) market.
The location of a fund's buildings plays a key role in its long-term performance. To achieve optimal returns, funds must carefully balance property prices and building conditions against their locations to maximize long-term value appreciation. Additionally, addressing tenant demand and increasing occupancy rates are crucial for maximizing rental income, and these are often closely tied to a building's location, accessibility, and proximity to amenities. With portfolios often consisting of hundreds of properties, strategically identifying investment opportunities across cantons and prioritizing geographic diversification is essential to minimizing risks and enhancing returns.
However, Switzerland's unique landscape presents specific challenges for effective portfolio diversification. The country's relatively small population is concentrated mainly in the plains between Zürich, Basel, and Geneva. High-altitude and mountainous regions create clear geographic partitions, limiting investment opportunities and complicating the task of achieving effective geographic diversification. Additionally, Switzerland's 26 cantons, with different tax rates and levels of public services, coupled with the country's four official languages, further add to the complexity of building a well-diversified portfolio.
Existing research on home bias and geographic diversification in RE funds has primarily focused on domestic diversification within the USA (Capozza and Seguin, 1999; Feng et al., 2021; Milcheva et al., 2021) and, to a lesser extent, the United Kingdom (Callender et al., 2007; Eichholtz et al., 1995; Lee, 2016). The findings from these studies vary, with some indicating that diversification can either enhance or diminish financial performance, depending on factors such as scope, duration, and methodology. A meta-analysis by Singh et al. (2023) highlighted that research on European and Asian RE markets remains limited. However, recent studies have started to bridge this gap. Ibrahim and Falkenbach (2023) used European property-level data to show that international diversification can reduce operating earnings on a fund's assets, thereby negatively impacting fund value. Similarly, Chu et al. (2023) found that greater exposure to developed Chinese agglomerations diminished the benefits of geographic diversification.
Despite these contributions, empirical research specifically focused on Swiss RE funds remains limited. Previous studies have primarily addressed financial aspects within a broad asset allocation perspective (Hamelink and Hoesli, 2004; Montezuma and Gibb, 2006). This leaves a gap in understanding the unique dynamics of Swiss RE funds and their strategies.
To address this gap, this paper introduces a novel dataset of building-level portfolios held by listed Swiss RE Funds, collected jointly by the ZHAW and Conser ESG Verifier. It investigates the relationship between geographic diversification, proximity bias, and fund performance. By analyzing the portfolios of 41 RE funds included in the SXI Broad Real Estate Index, encompassing approximately 9,000 buildings, this paper aims to provide new insights into the strategies, diversification measures, and performance of these funds in a relatively unexplored market. The analysis focuses on understanding how various fund characteristics such as age and portfolio size, alongside geographic factors such as language and distance from headquarters, influence financial outcomes.
Our findings show that, on average, listed Swiss RE funds tend to hold geographically concentrated portfolios, with properties close to their headquarters and predominately in regions where the local language corresponds to that of the headquarters. Regression results suggest that as asset bases grow, funds increasingly seek properties further from their headquarters, diversify into more cantons, and invest in regions with languages different than the headquarters.
Contrary to findings focused on the US market (Feng et al., 2021; Milcheva et al., 2021), our regression analysis indicates that geographic diversification, a propensity to invest close to headquarters, or a focus on regions sharing the local language do not significantly influence total return figures for Swiss funds. Instead, fund returns appear to increase with fund age and number of buildings held. Finally, the similarity analysis shows that many funds have different portfolio compositions in terms of building types, while the spatial analysis revealed almost no spatial overlap between the building portfolios.
This paper offers novel insights into the relationship between geographic diversification and the financial performance of RE funds within the relatively unexplored Swiss market. For these findings, our goal is to provide practical guidance and establish benchmarks to help asset owners and managers understand the intricacies of Swiss RE Funds.
2. Literature review on the Swiss Real Estate Market and funds, geographic diversification and financial performance
Swiss Real Estate Market and Real Estate Funds
A distinctive characteristic of the Swiss RE market is its rental-based structure. High capital requirements and land prices driven by limited land availability have led a significant percentage of the population to opt for renting over home ownership. In 2022, 61% of households in Switzerland resided in rented or cooperative housing units (Federal Statistical Office, 2024a). A substantial share of these rental units is owned by private-sector corporations and RE funds, with nearly half of all buildings in high-density cantons such as Geneva, Vaud, Saint-Gallen, and Aargau under their ownership (Federal Statistical Office, 2024b).
Legal entities, including corporations and RE funds, own an estimated 12.1% of Switzerland's building stock (Federal Statistical Office, 2024c). These entities hold 3.5% of single-family homes, 20.5% of multi-family houses, 19.6% of residential buildings with ancillary use, and 50.9% of buildings with partial residential use. The data does not include the cantons of Vaud and Zürich, where institutional ownership is notably high. Nevertheless, we observe that legal entities focus primarily on multi-family and mixed-use buildings, which generally offer higher income potential and reduced vacancy risks compared to single-family homes.
The latest figures highlight the importance of Swiss RE funds in the broader real estate sector. According to Refinitiv data, the Swiss RE Fund industry currently comprises 58 RE funds listed in the Lipper dataset and 38 RE funds listed on the SIX Swiss Exchange (SWX). As of September 2024, the 38 funds listed on the SIX held total net assets (TNA) of approximately CHF 41 billion, while the broader set of funds registered with Lipper hold TNA of over CHF 60 billion. Following UBS's acquisition of Credit Suisse in 2023, UBS emerged as the largest manager of Swiss RE funds, overseeing 12 funds with a combined TNA exceeding CHF 25 billion. Table 1 presents the latest figures by fund.
Despite the importance of RE funds in Switzerland's building sector, a notable gap in the availability of consolidated data for RE funds in Switzerland remains. In May 2022, the Federal Statistical Office (BFS) published ownership data on residential buildings for the first time, following the digitization and harmonization of land registers. This data offers insights into property ownership in Switzerland, calculated based on land registry information that BFS has linked with the Register of Buildings and Dwellings (GWR) with the Federal Office of Statistics. However, this data does not distinguish between RE funds and other legal entities within the sector, leaving a gap in sector-specific reporting.
Additionally, there is no consolidated dataset on the market that compiles portfolio holdings of Swiss RE funds alongside financial and sustainability metrics. Although each fund publishes a list of properties in its annual reports, the level of detail is inconsistent, typically including addresses (street name, street number, and city) but with inconsistent levels of detail about each property. Another notable limitation in the current fund reporting is the absence of the unique identifier number (EGID) in annual reports, making it challenging to track properties accurately. Moreover, the dynamic nature of fund portfolios, whereby funds buy, sell, or develop properties, further underscores the need for regularly updated, comprehensive data.
Academic research on Swiss RE funds remains both limited and partially outdated. Academic literature on RE funds has explored markets in the United States, Europe, and Asia to some extent, primarily focusing on performance determinants, risk-return profiles, and diversification benefits within different fund types. A study by Zhao (2014) analyzed global and U.S.-focused RE mutual funds, examining their performance relative to stock markets and finding limited evidence of outperformance. This study highlighted the challenges in achieving meaningful benefits from diversification across global RE funds. Similarly, Lee and Rahman (1990) investigated mutual fund performance in the US and emphasized the roles of market timing and stock selection in achieving superior returns. Goodwin et al. (2021) further analyzed the relative performance of RE exchange-traded funds (ETFs) in the U.S., revealing increased volatility and risks, especially during financial crises, compared to broader market benchmarks. Çamlibel et al. (2021) focused on Turkish listed RE funds during the COVID-19 period, demonstrating that these funds are not well-diversified compared to local stock benchmarks.
Academic research specifically on Swiss RE funds remains limited and outdated. Hamelink and Hoesli (2004) explored RE allocation strategies in institutional portfolios, concentrating on risk management techniques such as maximum drawdown. Montezuma and Gibb (2006) provided insights into residential property investments in Switzerland and the Netherlands, emphasizing the potential for diversification and stable returns within institutional portfolios. Despite these contributions, the focus remains predominantly on residential property rather than on RE funds as a broader category.
The relative scarcity of academic research concerning the unique characteristics and performance of Swiss RE funds points to a significant gap in the literature. The lack of comprehensive studies on Swiss RE funds leaves a considerable opportunity to explore and provide a more detailed understanding of their performance in relation to market conditions, geographic significance, and fund-specific characteristics.
Research Gap 1: Swiss RE funds hold a significant share of the national RE market, yet they lack detailed and consolidated information on critical aspects such as building stock, geographic distribution, building conditions, and renovation efforts. The absence of comprehensive data creates challenges for institutional asset allocators, who require standardized benchmarks and detailed comparability between funds to make informed decisions. The inconsistent reporting and lack of uniform data on key metrics limit transparency and impede a clear understanding of fund performance and asset quality across the market.
- (2)
Geographic diversification: home bias or home advantage
Diversification is a fundamental concept in portfolio management, designed to mitigate risks, reduce earnings volatility and optimize returns by distributing across various, ideally uncorrelated, assets (Markowitz, 1952). Geographic diversification, whether domestic or international, is often believed to provide benefits such as risk reduction, market expansion, broader access to investment opportunities, and portfolio optimization. However, empirical evidence also indicates that, in case of multinational companies, globally diversified assets and cash flows may increase systematic risk (Reeb et al., 1998). Given the inherently local nature of real estate markets, foreign investors may face informational disadvantages. Empirical findings on Real Estate Investment Trusts (REITs) indicate that operating outside of the firm's home region can constrain fund managers' ability to effectively identify and monitor assets remotely (Eichholtz et al., 2016). However, a counterargument is emerging from rapid IT development over the past two decades, suggesting that market information has become more uniformly accessible on a global level. Interestingly, the seminal theoretical model by (Van Niewerburgh and Veldkamp, 2009) questions the assumption that global access to information reduces information asymmetry. Their findings suggest that the information acquired without adequate context or due to misguided learning effects can actually increase the information asymmetry between local and foreign investors.
The location of properties held by RE funds has been a focal point of research for over two decades. This has led to the development of two interrelated yet somewhat contradictory concepts: home bias and home advantage. While home bias refers to an investor's preference for domestic over foreign or distant investments, home advantage refers to the informational and economic benefits of operating or investing in familiar local markets. Although extensive research has been conducted on RE investments, few studies have specifically examined these two concepts in the context of RE funds, as emphasized in a meta-study by Singh et al. (2023). Nonetheless, we were able to identify a handful of relevant studies.
Home bias describes the inclination of investors to favor domestic assets over foreign or distant ones, even when diversification and profit potential would suggest doing otherwise. In a seminal paper, Coval and Moskowitz (1999) examined home bias at a granular level, demonstrating that U.S. fund managers not only favored domestic assets but also exhibited a “local bias” by disproportionately investing in firms geographically close to their headquarters. This raised questions about the relationship between geographic proximity of investments from headquarters, the effect of geographic diversification on performance, as well as the broader implications of geographic diversification strategies. Milcheva et al. (2021) further investigated the effects of geographic portfolio dispersion (concentration) among 162 listed RE firms in the US and its impact on equity performance between 1996 and 2015. They found that following the global financial crisis, firms with geographically diversified portfolios outperformed those with more concentrated holdings in terms of non-market performance measures. Conversely, in an empirical study examining the effects of geographic diversification on the market valuation of U.S. REITs, Hartzell et al. (2014) found that geographically diversified REITs were generally valued lower compared to those adopting a more geographically concentrated strategy. However, their findings indicate that this diversification discount is mitigated in firms with substantial institutional ownership, especially when these institutional investors actively engage in monitoring managerial decisions. In another study on REITS, Eichholtz et al. (2016) examined how the distance between investors and their U.S. office properties affects the effective rents these properties generate. Using hedonic rent models, the researchers found that closer investor proximity resulted in significantly higher rents, especially for lower-quality buildings, largely due to higher occupancy rates. However, their study also highlighted the role that property managers play in reducing the negative impact of investor distance, particularly when owners are located out-of-state.
In contrast, home advantage refers to the informational or economic benefits that investors or firms gain from operating or investing in their local market. These advantages stem from better access to information, stronger relationships, and a deeper understanding of local market conditions, which may be less accessible to external investors. These benefits often include better knowledge of regulatory environments, consumer preferences, and local business practices. Bae et al. (2008) analyzed information asymmetry by studying stock analysts in 32 countries and found that domestic analysts provided more accurate earnings forecasts than their foreign counterparts. Van Niewerburgh and Veldkamp (2009) proposed a theoretical framework to explore the informational and learning effects on RE firms, showing that firms with higher concentrations in their home markets experienced higher returns.
Ling et al. (2021) documented that REIT managers exhibited significant local bias when composing their property portfolios, favoring concentrated investments in their local metropolitan areas. In contrast, RE firms not headquartered in metropolitan areas tended to diversify across the country. The authors showed that firms with high local asset concentrations achieved greater returns, particularly in markets with less transparent information environments. Their analysis demonstrated that an equally weighted portfolio of firms with a high concentration of local assets produced higher average monthly returns than portfolios with low local concentrations.
Feng et al. (2021) examined a sample of equity REITs from 2010 to 2016, uncovering a nonlinear relationship between geographic diversification, firm value, and operational efficiency. On the one hand, geographic diversification was positively associated with higher REIT values for “transparent RE funds,” which were characterized by high levels of institutional ownership or investments in core property types. On the other hand, these transparent RE funds tended to show higher operating efficiency, particularly in revenue generation.
Although a variety of studies have focused on US and UK RE funds, research on European or Asian markets remains limited, as emphasized by Singh et al. (2023). We identified a few relevant studies addressing these regions. Ibrahim and Falkenbach (2023) utilized European listed Real Estate Fund property-level data to demonstrate that international diversification can decrease operating earnings on fund assets, subsequently reducing fund value. Chu et al. (2023) found that higher exposure to developed Chinese agglomerations reduces the benefits of geographic diversification for listed REITs. (Lindquist et al., 2022) analyzed the financial performance of domestic and global REITs between 2018 and 2020, but found little evidence that diversification via international REITs can improve performance.
The meta-study by Singh et al. (2023) underscores the fact that the majority of studies cover US or UK RE funds, while research on European or Asian markets remains very scarce. We were able to find a handful of studies on the subject: Ibrahim and Falkenbach (2023) used European property-level data to demonstrate that international diversification decreases operating earnings on funds' assets and hence has a negative effect on fund value. Chu et al. (2023) found that higher exposure to the developed Chinese agglomerations reduces the benefit of geographic diversification.
Research Gap 2: There is a lack of empirical research examining RE Fund diversification, home bias, and home advantage, as well as their financial performance in Switzerland specifically. Moreover, studies focusing on RE funds in European markets are rare, and there is no research exploring the role of language in RE portfolio construction.
Further, our paper makes a modest contribution to the literature on economic gravity models. Gravity models are spatial interaction models used to estimate the volume of interaction between two locations by taking into account their population sizes and the distances separating them. These models are typically applied to international trade and investment flows. Within a European context, Marku (2014) shows that increased distance between countries reduces direct foreign investment, while higher GDP enhances this volume. Sherrin et al. (2015) analyzed cross-country investment flows among European real estate developers and found that the cost-benefit balance associated with entering non-domestic real estate development markets depends on several factors. Of the 464 matched country pairs they examined, the majority showed no cross-border transactions involving real estate developers. However, significant bilateral flows were observed between countries with high linguistic and cultural affinity, such as Ireland and the UK, Sweden and Denmark, and Germany and Austria. Furthermore, their findings suggest that non-domestic developers from mature markets can gain considerable competitive advantages in less mature markets. Further, a meta study by Egger and Lassmann (2012) that summarized 81 research articles on international trade found that a shared language (official or spoken), on average, increases trade flows by 44%. Fidrmuc and Fidrmuc (2016) have also confirmed similar findings within the European context.
With German, French, and Italian as official languages, Switzerland represents a unique case where investors can operate countrywide within the same regulatory framework and within a relatively small geographic radius, yet still often need to conduct business in a language that is different from their native language.
In a pioneering analysis, Rossera (1990) used data from the Swiss public telephone call network as a proxy for measuring contact intensity between regions. Applying a gravity model, he found a significant drop in communication across the German–French language boundary, identifying it the main “discontinuity” in Switzerland's contact network. In other words, Swiss residents made significantly fewer phone calls across the German–French language boundary than within same-language regions, suggesting that linguistic differences inhibit both interpersonal and business communication. Egger and Lassmann (2015) found that Swiss regions tend to trade more intensively with neighboring foreign regions that share their language (e.g. French-speaking Swiss with France) than with other Swiss regions. This suggests some trade diversion: internal linguistic frictions may lead Swiss firms to orient their commerce activities toward linguististically-aligned markets abroad, rather than trading across the internal language border. On the positive side, Switzerland's multilingual heritage is often cited as an economic asset, making the country more attractive to foreign investor and trade partners. On the investment side, Bachmann and Hens (2016) investigated whether cultural identity influences investment behavior and competence by comparing German-, French-, and Italian-speaking Swiss investors with their respective linguistic counterparts in neighboring countries. Using data from a large international survey, they found that Swiss investors exhibited greater similarity with each other than with same-language investors located abroad. This pattern held for both decision-making behavior and emotional investment competence, suggesting a distinct “Swissness” that goes beyond linguistic differences.
Research Gap 3: While numerous studies have addressed geographic diversification, there is a lack of empirical research examining the investment decisions of REFs in relation to linguistic proximity within multilingual domestic markets such as Switzerland.
- (3)
Comparison of Swiss Real Estate Funds to European Markets
Switzerland has a comparatively large and well-developed real estate investment fund market relative to its European counterparts, especially considering its low population size of approximately 9 million. Using Refinitiv Eikon, we obtained total net asset values (NAV) for various European countries by filtering according to the domicile country and including open-ended and closed-ended real estate funds, institutional pension and insurance funds, Real Estate Investment Trusts (REITs), as well as other listed closed-ended vehicles. Overall, Switzerland's total net assets amount to approximately EUR 147.5 billion, distributed across 141 real estate investment products. This figure positions the Swiss market significantly ahead of several larger European nations, such as Germany (EUR 121.8 billion, population 83 million) and the United Kingdom (EUR 51.8 billion, population 68 million). In the next step we extended this analysis by the ECB Real Estate Fund statistics and national sources. As detailed in Appendix HYPERLINK \l “_Table_A2._Fund“Table A2, the number of funds per country differs considerably depending on the source of the data. While the ECB reports 2619 listed and unlisted funds for Germany, Refinitiv contains only 64 funds and national sources 320, which is a fraction of the ECB number. Still, when comparing the total assets of the RE funds for each country, Switzerland stands out with very high value of total AUMs compared to the country size.
However, direct comparisons across countries are complicated due to structural differences in their respective real estate investment markets. For example, the real estate markets in Germany and the United Kingdom feature a substantial share of listed investment vehicles, including REITs and publicly traded funds, which are covered by Refinitiv Eikon data. Conversely, countries such as Italy, France, and the Nordic countries (Sweden, Norway, Finland, Denmark) rely to a greater extent on specialized closed-ended funds, institutional private placements, and non-listed vehicles, for which asset values are either not readily available or not fully captured by Refinitiv. France predominantly utilizes non-listed structures such as SCPI and OPCI vehicles, while Nordic countries often employ institutional and specialized vehicles for direct property investments. Consequently, market sizes in these countries may be substantially underestimated when relying solely on data from listed vehicles.
Furthermore, the U.S. real estate market is considerably larger than its European counterparts. In 2024, the U.S. REIT Industry Equity Market Cap alone comprised 196 REITs with a market capitalization of USD 1,424.15 billion (approximately EUR 1,295 billion) (Nareit, 2025). This stark contrast highlights the substantial scale of the U.S. real estate investment market relative to Europe. Unlike the U.S., Switzerland exhibits limited benefits from geographic diversification, likely due to its relatively smaller geographic scale, greater economic homogeneity, and efficient transport infrastructure, factors that reduce regional variation in returns.
Additionally, Switzerland's real estate investment market differs notably from most European peers regarding the types of properties targeted. Driven largely by high rental demand and a stable residential rental market, Swiss real estate funds predominantly invest in residential properties. In contrast, real estate investment vehicles in Germany and France frequently pursue more diversified investment strategies, with significant allocations in office, retail, logistics, healthcare, and industrial properties. Germany, with its broader geographic and economic variability across regions, shares some structural similarities with the U.S., potentially offering more pronounced benefits from geographic diversification. France's specialized, predominantly non-listed investment vehicles (such as SCPI and OPCI) represent a different diversification dynamic, influenced more by property sector diversification rather than geographical spread. Thus, Switzerland's distinct market characteristics appear region-specific and reflective of broader structural and economic trends in similarly sized and structured European markets.
3. Data
Swiss real estate funds
Some of the key performance indicators (KPIs) for analyzing RE funds include the Net Asset Value (NAV), fund share price, and total and price returns. The NAV represents the total value of a fund's assets minus its liabilities. Time-series analysis of the NAV provides insights into a fund's performance, indicating whether its properties are generating value on a consolidated level. Open-ended funds are listed on exchanges, with shares actively traded, and the NAV per share is typically used to compare funds. A share price above (or below) the NAV reflects a premium (or discount). Additionally, the financial performance of these funds can be assessed on a total return or net return basis, depending on whether dividends are included.
In this study, ZHAW and Conser ESG Verifier joined their forces to construct a sample of Swiss RE funds by selecting the 41 funds comprising the SXI Broad Real Estate Index as of September 30, 2023. These funds are listed on the Swiss Stock Exchange, and each holds at least 75% of its invested assets within Switzerland (SIX, 2024). The SXI Broad Real Estate Index includes a diverse range of Swiss RE companies and banks, offering a comprehensive representation of the Swiss RE market.
From Refinitiv, we collected the funds' total return time series data. Additional general information, such as each fund's launch year, fund management company, address of the management company's headquarters, ownership type, and third-party verification (auditing) company, was either not readily available in Bloomberg or Refinitiv's databases or was incomplete. Therefore, this data was manually extracted from each fund's annual report. The 2023 reports for each of the 41 funds were downloaded from the Swiss Fund Data portal and the individual companies' websites from which the data was abstracted.
Property Portfolios held by the listed Swiss Real Estate Funds
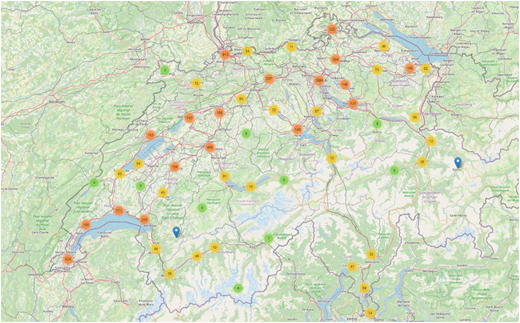
We created a database of holdings for the sample of listed Swiss RE funds, focusing on settlements and individual properties. Each fund's annual report provides a list of building assets at the settlement level, where settlements are defined as two or more adjacent properties of the same building type. However, automatic address extraction proved challenging due to inconsistencies in the reporting of addresses; funds often provide only abbreviated street names, numbers, and city names, while other addresses are incomplete; all this complicates automated extraction processes. To address these inconsistencies, we manually extracted settlement-level address data from each annual report, resulting in a dataset comprising 3,532 entries from 41 different funds. Subsequently, these settlements were disaggregated into individual building entries, yielding a total of 9,300 distinct properties (Figure 1).
The building prices used for the analysis were extracted from RealAdvisor (2024), while additional factors such as property type and language were obtained from the Register of Buildings and Dwellings database from the Federal Statistical Office.
4. Methodology
We employed a standard, multi-step approach, drawing on the methodology used by Milcheva et al. (2021). First, we determined geographic distances at the building level and calculated the diversification and concentration metrics at the fund level. Next, we conducted a similarity analysis to compare RE portfolios based on building age, type, and spatial overlap. Finally, we performed a cross-sectional regression analysis to examine whether the geographic variables calculated in the first step correlate with fund performance or size.
Building-level Geographic Measurement of Distance, Geographic Diversification, and Concentration
We also follow the approach of Milcheva et al. (2021) for the measurement of distances and geographic diversification. The distance of the properties of a fund i from its headquarters (DHQ) is defined as:
where is the square root of the distance of property n of fund i from the headquarters, and Ni is the total number of properties held by fund i. For this study, the headquarters are defined as the fund management company's headquarters, not the fund's issuer (UBS, Credit Suisse, etc.). We use a simple measure of distance expressed in kilometers. While this metric is meaningful and representative, it could be further refined in future studies. In the Swiss context, it would be of interest to consider travel time by public transport or car, or the road distance between these buildings.
To measure the extent of diversification of funds' properties, we employed the Herfindahl-Hirschman Index (HHI) to assess the geographic concentration of each funds' properties across multiple Metropolitan Statistical Areas (MSAs). The HHI is calculated by squaring the number of properties held within one MSA divided by the total number of properties held by the given fund:
where the fund is labeled as i, MSAs are labeled as l, and Ni represents the total count of buildings held by fund i. Furthermore, Pi,l describes the number of properties of fund i that are located in the MSA l. The resulting HHI ranges from close to zero to 1, where values near zero indicate strong diversification across MSAs, while values close to 1 suggest strong concentration within a single MSA.
Lastly, we determined the share of properties that funds tend to hold locally. To do this we drew on the HOME metric used by Milcheva et al. (2021) and Ling et al. (2021) and adapted it to the Swiss context. Several Swiss cantons, such as Zug and Basel-Stadt, have relatively small surface areas and populations. Thus, we consider a property investment to be local if it is located within the canton of the funds' headquarters or a neighboring canton. We define the variable HOME_PLUS for each fund as follows:
where Dn,i is the dummy variable that takes the value of 1 if the property is in the canton of the headquarters or a neighboring canton, or zero otherwise.
Similarity Analysis
Each fund was assessed for its similarity to the others with respect to building age, building type, and building location using the federal building registry data. To analyze age differences, we conducted a simple t-test on the logged construction year of each building. A fund with a p-value of less than 0.05 exhibits a statistically significant difference in the age composition of its RE portfolios compared to other funds.
As a second test for similarity in composition of building types, we employed a multinomial test, where the null hypothesis assumes that the base probabilities for the composition of building types are the same as those of the other portfolios, excluding the portfolio of interest. A p-value of less than 0.05 indicates a statistically significant difference in the building type compositions of the portfolios.
In terms of spatial similarity, we measured the overlap between portfolios using the Jaccard index on a probability metric space:
where sets A and B represent buildings within a given postal code. A fund's portfolio is considered to completely overlap spatially if all its buildings are located within the same postal codes as all the other funds, excluding the portfolio of interest. The Jaccard index ranges from 0 to 1 (inclusive) with higher values indicating greater spatial overlap.
Regression Analysis
We followed an approach similar to past studies by establishing and testing three regression equations to examine the association between geographic variables and fund performance or size:
Fund Age and Number of Buildings served as proxies for track record length and fund size, respectively. For the independent variable , we tested several fund-level indicators, including the Sum of Square Root Distances to HQ (DHQ), Metropolitan Statistical Area (MSA) Diversification Index (HHI), HQ Language Proximity, Propensity to Invest Locally (Home Plus), and the number of Cantons in which the given funds hold properties. The choice of variables for our baseline regression aligns with the approach used by Feng et al. (2021) and Milcheva et al. (2021), who also incorporate fund size and returns alongside similar geographic diversification variables.
While we acknowledge that several omitted variables could potentially improve the explanatory power of the baseline regression, we highlight that this study represents the first attempt to construct a coherent dataset on the holdings of Swiss Real Estate Funds. It is not surprising that several relevant data categories, particularly fund-level and property-level characteristics, are not openly or readily available for the Swiss market. (Credit Suisse Asset Management, 2024) remarks that the bank is in the position to source selected fund-level data directly from the Swiss fund managers including operational costs, leverage, premium/discount metrics, and dividend payout ratio.
In the U.S. REIT literature, previous studies have employed additional variables such as institutional ownership, Tobin's Q, leverage, operational efficiency, and market-derived factors such as momentum or size factors. Future research on the Swiss fund sector would benefit significantly from incorporating financial metrics such as leverage and operational efficiency to improve regressions quality and comparability.
Unlike previous studies of the U.S. REIT market, our analysis is limited to a simple cross-sectional dataset of portfolio holdings for a single year. The dataset reflects the state of fund portfolio holdings as of year-end 2023. As we continue to extend the dataset, we aim to include time series data on the evolution of Swiss real estate prices, property-specific occupancy rates and rental yields, macroeconomic indicators, localized economic development, wealth data, and local population dynamics. Incorporating localized or market-wide shocks, such as the COVID-19 pandemic, which had an impact on property valuations, would also be valuable.
Descriptive fund data also corresponds to 2023, while average fund performance is based on monthly total return data from 2019 to 2023. Given our sample size of 41 observations, we applied Ordinary Least Squares (OLS) without adjustments for standard errors.
5. Empirical results
In this section, we present the descriptive results, the similarity analysis, and the regression.
Descriptive Statistics
Our sample consisted of 41 Swiss RE funds. Table 2 and Appendix Table A3 provide an overview of the funds' characteristics. The average fund has an NAV of over CHF 1.2 bn, though the high standard deviation highlights notable discrepancies within the sector: specifically, the ten largest funds account for over 50% of the total sector NAV, with UBS Swiss Mixed Sima standing out as the largest fund in our sample. This finding is consistent with the variation in building stock, which ranges from 25 to 1,304 properties per fund.
The average fund age is 11 years, with the oldest fund having a 37-year track record and the youngest only two years old. The total return of the funds over the last five years averages approximately 3% with a standard deviation of 5%, suggesting that performance varies considerably between the funds. Similarly, the average Sharpe Ratio of 0.09 indicates that, despite being positive, the risk-adjusted return is very modest, with substantial variation across funds.
The analysis also highlights differences in building prices, with the average price per square meter across the funds being CHF 10,000. This is notably higher than the Swiss national average of CHF 7,000 per square meter, likely due to these funds' propensity to invest in locations with higher demand and more valuable properties.
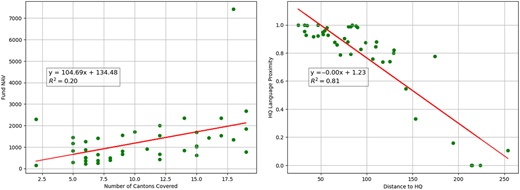
The dot plots in Figure 2, corresponding to the information in Table A3 in the appendix, demonstrate counterintuitive findings about listed Swiss RE funds. First, the largest funds tend to be active in a greater number of cantons than the smallest funds, yet the correlation is very low. More interestingly, the plot on the right-hand side (RHS) of Figure 2 indicates that the majority of these funds invest in properties between 20 and 120 km from their headquarters. Even the larger funds with over CHF 1 bn in net assets and operating in more than 10 cantons have the bulk of their properties concentrated near their headquarters.
Additionally, we observe that on average around 80% of properties are in cities where the spoken language is the headquarters' primary language. This demonstrates a clear tendency for funds to invest in regions that align with their linguistic base, which can offer logistical and operational advantages.
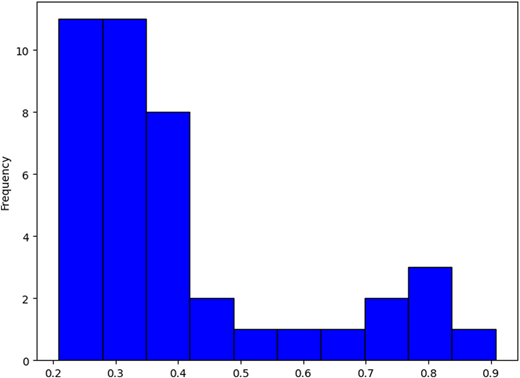
The histogram in Figure 3 presents the distribution of Herfindahl-Hirschman Index (HHI) values for the sample of Swiss RE funds. Thirty of the 41 funds have HHI values between 0.2 and 0.4, which indicates moderate diversification of properties within a broader range of metropolitan areas. Five funds fall in the middle range between 0.4 and 0.7, reflecting the partial concentration of buildings. Six funds exhibit HHI values between 0.7 and 0.9, which indicates a high concentration of buildings in a small number of metropolitan areas and little diversification. The results suggest moderately concentrated portfolios and some highly geographically concentrated funds, reinforcing the finding that Swiss RE funds are generally inclined toward concentrated geographic investments.
To conclude, Swiss RE funds tend to hold geographically concentrated property portfolios, with properties located close to their headquarters and predominately in regions where the local language aligns with the language spoken at the headquarters. In Swiss politics and economics, this is commonly referred to as Röstigraben or Polentagraben, which refers to the linguistic boundaries dividing the German, French, and Italian-speaking regions of Switzerland and the tendency to operate primarily within one's own language zone.
Similarity Analysis
To assess the similarity of the sample of RE funds, we examined the composition of the buildings within the portfolios in terms of both building type and building age. Using multinomial tests, we compared the distribution of these attributes across the funds. As summarized in Table 3, and after applying the Hommel correction to adjust for multiplicity, the analysis revealed that only 17 of the 41 RE funds exhibited statistically significant differences in their age profiles, indicating a relatively uniform distribution of building ages among most funds. By contrast, greater variability was observed in building types, with 33 out of the 41 funds exhibiting statistically significant distinctions in the building types of each portfolio. These results reflect diversity in the types of buildings held by the funds despite similarities in building age.
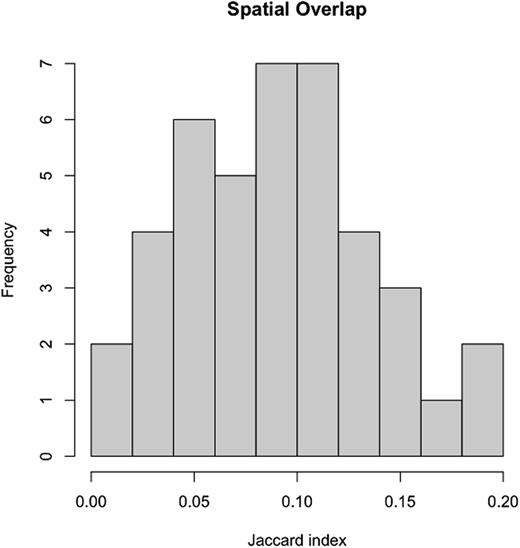
Further, we examined the spatial distribution of buildings within the funds' portfolios using the Jaccard index, which measures the degree of spatial overlap based on shared postal codes. Given the high number of buildings in our dataset, we calculated the Jaccard index for each fund against all other funds and presented the results in the form of a histogram, as shown in Figure 4. We find that most values oscillate between 0 and 0.2, suggesting a low degree of spatial overlap. Despite Switzerland's relatively small size and limited availability of investment locations, Swiss funds appear to avoid concentrating their investments in overlapping area codes and prioritize diversification by seeking properties in various locations.
In the final phase of this exercise, we calculated pairwise Jaccard values for all 41 RE funds, as shown in the matrix diagram in Figure A1 in the appendix. The matrix confirms the low spatial similarity between individual funds, even among larger funds with high assets under management.
Regression Analysis
Table 4 presents the results of the OLS regression analysis with Fund Total Return as the dependent variable, as defined in the previous section. Our findings indicate that Swiss RE funds experience an increase in long-term performance with age and the number of properties held, as both variables both consistently show significant positive relationships with returns across all models. This suggests that older funds and those with larger portfolios generally perform better. The correlation between returns and fund age may reflect building-level diversification effects, more stable cashflows enabling lower borrowing rates, or the benefits of accumulated experience and improved operational procedures over time. Similarly, fund size may offer some intrinsic diversification benefits and allow fixed overhead costs to be spread across a broader asset base. Larger funds may also benefit from more favorable borrowing conditions.
However, our results do not show that geographic variables have a significant impact on fund returns. Variables such as average distance to headquarters (DHQ), geographic concentration (HHI), language proximity, number of cantons in which the funds hold properties, and property prices do not exhibit statistically significant relationships with fund returns. We further observe that proximity to the headquarters and a common language between the fund HQ and the building location are highly correlated (ca 85%), leading to variance inflation when both variables are included simultaneously in the regression model (Appendix Figure A3).
Additionally, the Home Plus variable, which captures whether a fund holds properties in its home and neighboring cantons, also does not indicate any significant advantage or disadvantage for generating returns. These results contrast with earlier findings by Milcheva et al. (2021) and Van Niewerburgh and Veldkamp (2009), which reported geographic diversification and distance as significant factors in other markets.
To ensure that the regression results are not prone to multicollinearity, we proceed in two steps. First, we construct a correlation matrix (Appendix Figure A2). It reveals that the average distance to headquarters, language location, and home plus were highly correlated. Moreover, the number of cantons covered and HHI also exhibit a high correlation. In the second step, we employ the Variance Inflation Factor (VIF) to detect multicollinearity between independent variables when two or more predictors are highly correlated. Appendix Figure A3 shows that the VIF factor for “Distance to Headquarters” is above 10, indicating severe multicollinearity, while the VIF for “Language of HQ” is above 5, suggesting potential multicollinearity.
In Appendix Table A4, we present the results of the OLS regression analysis with the Fund Sharpe Ratio (SR) as the dependent variable. In this case, we observe no significant correlations between the Sharpe ratio and any of the geographic or fund-specific variables. This indicates that geographic factors and traditional fund characteristics do not play a substantial role in explaining differences in risk-adjusted returns for Swiss RE funds. Although language proximity exhibits a marginal significance, the overall lack of significant predictors suggests that risk--adjusted returns are not heavily influenced by factors like fund size, age, or geographic diversification.
In Table 5 we present the regression results where fund NAV is set as the dependent variable. Similar to total returns, we find a significant positive correlation between fund age, the number of buildings, and NAV. This indicates that older and larger funds tend to have higher NAVs. Also, we found that larger funds exhibit a greater distance to headquarters and a lower language proximity, which reflects investments beyond loyal geographic and linguistic regions. The positive link between size and distance between property locations and HQ is in line with the findings of (Feng et al., 2021). Our results for language proximity contribute to the findings on cross-country flows and language proximity (Sherrin et al., 2015). However, we do not find a significant correlation between fund size and geographic concentration (HHI) or between fund size and the propensity to invest in the domestic and neighboring cantons proxied by Home Plus.
These findings show that the larger the fund, the higher the tendency to explore investment opportunities further from the headquarters, even expanding into regions in different language zones. Larger funds also benefit from higher absolute management fees, providing them with more resources to identify and manage new investment prospects effectively. Our results on the fund size, distance and linguistic proximity enrich the body of knowledge built by (Eichholtz et al., 2016) and Ibrahim and Falkenbach (2023). Future research can further build on this data to set up a gravity model for real estate investment flows between cantons, as demonstrated by Sherrin et al. (2015).
It is worth noting that our sample of 41 funds includes one extremely large fund and a few very large ones, which together account for nearly half of the total sector NAV. To test the robustness of our results, we exclude all funds with a NAV exceeding 1.8 billion CHF, resulting in the removal of seven funds. This leaves us with a sub-sample of over 30 observations—sufficient to conduct meaningful OLS regressions—while allowing us to focus on small and medium-sized funds that typically have more limited capacity for diversification. We repeat the OLS regressions for Fund Total Return and the Fund AUM (Ln) using this sub-sample. The regression results, presented in Appendix Tables A5 and A6, are consistent with those reported in Tables 3 and 4, confirming that our findings remain robust even after excluding the largest funds.
6. Discussion and conclusions
This paper fills an important gap in the literature on Swiss listed RE funds by introducing a comprehensive and novel dataset comprising approximately 9,000 buildings within the portfolios held by listed Swiss RE Funds. Constructed jointly by Conser and ZHAW, this dataset enables an in-depth analysis of geographic and linguistic diversification, proximity bias, and home bias in relation to fund performance. We examined the portfolios of 41 RE funds included in the SXI Broad Real Estate Index, focusing on the geographic diversification strategies of these funds and their implications for long-term performance.
Our findings show that, on average, listed Swiss RE funds tend to hold geographically concentrated property portfolios, with properties located close to their headquarters and predominately in locations where the local language corresponds to the language spoken at the headquarters. These results suggest that fund management tends to remain close to home for practical reasons, such as streamlined communication, easier management, and operational efficiency. Additionally, staying within familiar regions may offer advantages in terms of regulatory understanding, established local networks, and reduced logistical complexities.
Our regression analysis results suggest that long-term fund performance is primarily influenced by the age of the fund and the size of its property portfolio. Established funds with larger portfolios tend to outperform their younger and smaller counterparts. These results suggest that the larger the NAV of a fund, the more it diversifies geographically with properties located further from the headquarters, in a greater number of cantons, and extending into different language zones.
Moreover, contrary to findings from studies on the US market, our analysis showed that geographic diversification, proximity to headquarters, and investment concentration in linguistically aligned cantons and regions did not have a significant effect on fund returns. These results contradict prior studies by Milcheva et al. (2021) and Feng et al. (2021), which found geographic variables that significantly influence fund performance in other markets. This difference highlights the unique characteristics of the listed Swiss RE market and suggests that local market factors and operational efficiency may play a stronger role in fund performance than geographic diversification alone.
Additionally, our findings suggest that fund returns tend to increase with fund age and fund size. This points to the significance of experience and accumulated expertise in increasing long-term profitability and asset value. Furthermore, larger portfolios allow funds to achieve economies of scale, such as lower maintenance costs and the costs associated with renovations and management services, especially when these buildings are situated close to the headquarters.
Finally, we used multinomial tests to perform a similarity analysis of Swiss listed RE fund portfolios in terms of building age and type and examined whether the buildings are in the same areas using the spatial Jaccard index. We found significant differences in the composition of building types between the funds, indicating that most funds have different portfolio compositions. However, the building age distributions were relatively uniform across the RE funds. The spatial analysis revealed almost no spatial overlap between the building portfolios, even among larger funds. This implies that investors that allocate capital to different Swiss RE funds are likely to obtain different exposures in terms of building types and geographic location. This level of heterogeneity in the investment locations is interesting in view of Switzerland's small size and limited number of investment opportunities.
In examining fund size and geographic factors as part of the regression analysis, we found that larger funds tend to invest in more cantons and regions that differ linguistically from their headquarters. This trend implies that as funds grow, they expand their investment horizons beyond familiar and proximate locations to seek new opportunities. Larger funds benefit from greater resources, allowing them to explore and manage properties in different regions. However, we did not find a significant relationship between fund size and geographic concentration (HHI), nor between size and the propensity to invest locally, as measured by the Home Plus variable. This suggests that larger funds do not necessarily seek to diversify geographically on a local level in familiar regions but rather expand into new regions independent of the language spoken.
Future research could build on these findings by exploring whether geographic factors influence operational metrics such as revenue generation or efficiency, as suggested by studies like Feng et al. (2021) and Ibrahim and Falkenbach (2023). Additionally, the longitudinal nature of the dataset offers an opportunity to move beyond cross-sectional analysis and establish a panel setup to analyze how portfolio composition evolves over time and how changes in geographic composition correlate with financial outcomes. Furthermore, integrating property location data presents new avenues for investigating exposure to climate risks and regulatory impacts on energy efficiency and sustainability initiatives.
We gratefully acknowledge the valuable input provided by Jean Laville and Angela deWolff from Conser ESG Verifier, as well as the feedback received at the AI + X Summit (ETH Zurich) in 2024.
The supplementary material for this article can be found online.