In recent decades, the carbon sink provided by the U.S. forest sector has offset a sizable portion of domestic greenhouse gas (GHG) emissions. In the future, the magnitude of this sink has important implications not only for projected U.S. net GHG emissions under a reference case but also for the cost of achieving a given mitigation target. The larger the contribution of the forest sector towards reducing net GHG emissions, the less mitigation is needed from other sectors. Conversely, if the forest sector begins to contribute a smaller sink, or even becomes a net source, mitigation requirements from other sectors may need to become more stringent and costlier to achieve economy wide emissions targets. There is acknowledged uncertainty in estimates of the carbon sink provided by the U.S. forest sector, attributable to large ranges in the projections of, amongother things, future economic conditions, population growth, policy implementation, and technological advancement. We examinedthese drivers in the context of an economic model of the agricultural and forestry sectors, to demonstrate the importance of cross-sector interactions on projections of emissions and carbon sequestration. Using this model, we compared detailed scenarios that differ in their assumptions of demand for agriculture and forestry products, trade, rates of (sub)urbanization, and limits on timber harvest on protected lands. We found that a scenario assuming higher demand and more trade for forest products resulted in increased forest growth and larger net GHG sequestration, while a scenario featuring higher agricultural demand, ceteris paribus led to forestland conversion and increased anthropogenic emissions. Importantly, when high demand scenarios are implemented conjunctively, agricultural sector emissions under a high income-growth world with increased livestock-product demand are fully displaced by substantial GHG sequestration from the forest sector with increased forest product demand. This finding highlights the potential limitations of single-sector modeling approaches that ignore important interaction effects between sectors.
1 Introduction
Management of vegetation and soils in landscapes across the U.S. contributes a non-trivial component of total anthropogenic greenhouse gas (GHG) emissions. Forests are currently a net carbon sink, sequestering 716 Tg CO2e in the year 2016 and offsetting roughly 11% of national emissions from all sectors (Hockstad and Hanel, 2018). On the other hand, the agriculture sector (including crops, livestock and land use change) emitted 563 Tg CO2e in 2016, comprising roughly 9% of overall emissions (Hockstad and Hanel, 2018). To enable informed mitigation investment and related policy strategies, it is critical to understand and assess future trends in GHG fluxes in the agriculture, forestry, and other land use (AFOLU) sectors. These future projections form the foundation, or baseline, against which future policy actions can be appraised.1
Projecting AFOLU GHG fluxes requires consideration of future economic conditions, population growth, policies, technological advancement, and biophysical characteristics of terrestrial ecosystems (Latta et al., 2018). Another important determinant of future trends is the responsiveness of producers and consumers to changing economic conditions, hence careful consideration should be given to how market feedback might impact resource utilization, production/consumption patterns, and GHG emissions. Given the uncertainties inherent in each of these parameters, and the range of approaches to projecting AFOLU trends, there is considerable variation in GHG flux projections in the published literature. This variation includes substantial uncertainty regarding the magnitude of the net sink in the U.S. forest sector, and even disagreement about whether the sector will remain a sink through the end of the century (The White House, 2016).
To reduce the variability in model outputs driven by this uncertainty, O’Neill and et al. (2014) present the Shared Socio-Economic Pathways (SSPs) framework, which provides a standard set of five alternative narratives of future socio-economic conditions and responses to climate change. The research community has adopted the SSP framework to facilitate comparison, improve comparability among model outputs, and enable generalization across a broad spectrum of research efforts such as required agriculture productivity to meet expanding populations (Cai et al., 2017), estimating sub-regional population expansion (Merkens et al., 2016), looking at food security under future socioeconomic futures (Palazzo et al., 2017), and socioeconomic adaptability to sea-level rise (Nauels et al., 2017).
However, the high-level narratives provided by the SSP framework are global pathways, and supplemental datasets published at national scales are restricted to country-level projections of population and gross domestic product or regional projections of aggregate output such as net GHG emissions or land use change. Other emerging research has developed detailed SSP narratives for the global forestry sector (Daigneault et al., 2019), the water sector (Graham et al., 2018), and oceanic resources (Maury et al., 2017), but these studies also focus on global storylines instead of national or subnational trends. Thus, additional steps are needed to translate global SSP narratives to sufficiently create quantitative assumptions in models that pertain to one or more sector in a single country. That is, general narratives need to be translated into individual parameters used in an economic model, particularly for diverse sectors such as AFOLU in which production capacity, resource constraints, dietary preferences, and market structures vary considerably by region.
This manuscript applies an economic model of the U.S. agriculture and forestry sectors to project the potential impacts of alternative underlying assumptions about socioeconomic futures on agriculture and forestry sector production, consumption, land use change, and GHG fluxes. We did this by translating two global SSP scenarios from qualitative narratives into detailed quantitative scenarios that include specific estimates of change in (1) demand for agricultural products due to increases in GDP and shifts in dietary preferences; (2) demand for, and international trade in, forest products; (3) patterns of urbanand suburbanization, and (4) enforcement of allowable timber harvest on protected lands. This approach allowed us to project relative emissions changes from AFOLU systems ranging scenarios with changes in individual SSP sector components to scenarios in which all market and policy assumptions change simultaneously (i.e., a comparison between component specific emissions impacts, and net emissions impacts of a comprehensive change).
We base our analysis on a substantially updated 2018 version of the Forest and Agricultural Sector Optimization Model with Greenhouse Gases (FASOMGHG) model, a partial equilibrium dynamic optimization model that is well-suited for capturing interactions across alternative land use sectors (Adams et al., 1996; Beach et al., 2010; Latta et al., 2013). This new model includes a completely redesigned forest sector sub-model calibrated to recent Forest Inventory and Analysis data and incorporates an intertemporal and spatially aggregated version of the Land Use and Resource Allocation modeling system described in Latta et al. (2018). In contrast to previous studies that project greenhouse gas emissions from the U.S. forestry and land use sectors (e.g., Wear and Coulston, 2015; Latta et al., 2018; Tian et al., 2018), the modeling framework applied in this analysis directly captures the interface between agricultural and forestry production systems. We exploit this capability to assess the potential emissions implications of SSP sector components in isolation and in combination.
Results indicate that a development pathway characterized by high-income growth and continued fossil energy development could actually decrease emissions from the U.S. AFOLU sectors relative to a development pathway that places a greater emphasis on sustainable growth. This result reflects additional investments made in the forest resource base in anticipation of future demand growth, which our analysis indicates will outweigh the additional emissions from simultaneous expansion in agriculture. This is consistent with results from recent studies that establish a strong link between forest product demand growth, investment, and carbon sequestration outcomes (Tian et al., 2018; Kim et al., 2018). We show that the relationship between forest product demand growth and net sequestration changes is more elastic than agricultural demand growth and net emissions changes, which has important policy implications for establishing future baseline emissions levels and GHG mitigation targets in the AFOLU sectors.
The remaining sections of the manuscript are as follows: Section 2 provides an overview of the recent updates and additions to the 2018 version of FASOMGHG, including a description of the new forest sector representation, updates to the model structure, and expansion of agricultural sector mitigation options (a model supplement provides additional detail). Section 3 outlines the baseline assumptions across SSP scenarios and public harvest scenarios used for this analysis. In Section 4, we present product demand, land use change, and GHG flux results across SSP narratives. Section 5 provides some discussion and key takeaways from these results and offers direction for future research.
2 Methods
We applied an updated and redesigned 2018 version of the FASOMGHG model, a constrained intertemporal optimization model of the U.S. agricultural and forestry sectors (Beach et al., 2010). The model maximizes the present value of total welfare over time, assuming profit maximization by producers and consumer surplus maximization on the demand side. It is solved on a 5-year time step from 2015 to a terminal period of 2080 in this analysis. This time horizon is consistent with other previous U.S. government reports and several recent publications that have applied previous versions of the framework [e.g., Baker et al. (2010), Sissine (2010), Latta et al. (2013), and U.S. c (2014)], and is sufficient to incentivize investments in the forest resource base at both the intensive and extensive margins. This section provides an overview of model updates and new data sources, and we provide additional detail in the supplemental information section.
The updated forest sector represents a spatial aggregate and intertemporal version of the spatially detailed and recursive dynamic Land Use and Resource Allocation (LURA) model, presented in Latta et al. (2018). LURA uses USDA Forest Service Forest Inventory and Analysis (FIA) data on forest type, site class, and ownership from over 130,000 plots in the conterminous United States (Roesch and Reams, 1999). We estimated forest yield growth as a function of stand age from the FIA plots using a two-parameter Von Bertalanffy (1938) growth equation for each of the 7 FIA site productivity classes, 14 forest types, and 36 forested ecoprovinces. We aggregated yield functions from ecoprovinces in LURA to 11 FASOMGHG regions through spatial weighted averaging (additional discussion of this approach is provided in the supplement). We linked the supply side of the model to a forest products demand based on an aggregation of LURA’s 3000+ biomass demand points, including forest product manufacturing facilities, electricity generation units (EGUs) and ports to FASOMGHG’s regions. We likewise averaged LURA transportation costs from individual FIA plots to individual mills and ports by FASOM region for each forest product reflecting of hauling forest biomass from plot to final demand point post-harvest. Logging residue supply curves are based on regional supply curve functions estimated using the spatial allocation optimization routine described in Baker et al. (2018).
We developed a new intertemporal forest sector module for the 2018 FASOMGHG modeling system based on the spatially disaggregated LURA framework. As with previous versions of FASOMGHG, the updated framework explicitly captures land use competition and market substitution between forestry and agriculture and allows for endogenous intensive/extensive margin investments and forward-looking investment activity. We aggregated spatially explicit (FIA plot-level) data from the LURA model to the 11 FASOMGHG regions, and then incorporated an objective function component that maximizes the present value of producer and consumer surplus over the simulation horizon, incorporating both price endogenous revenue and detailed cost components (including harvest, management, transportation, processing, land transfer, and fixed capital costs in each period). Forest product demand and export demand are based on exogenous demand growth assumptions tied to income growth (Latta et al., 2018; Larson et al., 2018, and with additional information provided in the supplement). Land and products (e.g., energy feedstocks) are fungible between the agriculture and forestry sectors (Latta et al., 2013; U.S. EPA, 2017), and the two sectors are linked operationally through a compound welfare objective function to interact the sectors.
Key data updates were also implemented in the agricultural sector to reflect contemporary market conditions and land use. This included updated data on crop acreage trends, agricultural commodity trade, and livestock feeding rates (detail is provided in the supplemental appendix). We also expanded the range of agricultural production technologies and associated emissions levels, incorporating alternative production methods such as cover cropping and associated soil carbon sequestration (detail is provided in the supplemental appendix). We regionalized the existing livestock non-CO2 accounting and production technology sets consistent with technologies reported in Frank et al. (2018). Further description of these agricultural sector updates is found in the supplemental information section.
The land transition possibilities in FASOMGHG are outlined in Beach et al. (2010). Land to development transfers are exogenously determined based on population and income, using spatially explicit projections from the Integrated Climate and Land-Use Scenarios (ICLUS) project (U.S. EPA, 2017), and all other transfers are endogenous. Incorporating regional land- to-development estimates using the ICLUS framework improves urbanization representation relative to the previously-used more spatially aggregated method in Alig et al. (2010). Land conversion from one use to another requires a conversion cost plus an opportunity cost (foregone economic value from the prior use). For some land use conversion possibilities, including conversion of pasture to cropland, we assumed constant average costs for each region. However, afforestation possibilities from cropland, pasture, and rangeland face upward-sloping marginal cost curves as described in Cai et al. (2018). Bioelectricity pathways and energy infrastructure constraints are consistent with the version of the model presented in Latta et al. (2013) and U.S. EPA (2014), and Cai et al. (2018). We incorporated commodity transfers between sectors, allowing for interregional trade within and across sectors to meet food and fiber demands.
3. SSP Scenario Construction
This analysis assumes two primary baseline scenarios, modeled based on different shared socio-economic pathways (SSPs), which offer general narratives for the possible evolution of global socioeconomic future and the potential challenges each future might see in terms of GHG mitigation and adaptation to climate change (O’Neill et al., 2012). Under SSP1, society “shifts gradually, but pervasively, toward a more sustainable path, emphasizing more inclusive development that respects perceived environmental boundaries” (O’Neill and et al., 2014). SSP1 is a dramatic departure from prioritizing material growth and economic expansion, to a greater emphasis on meeting development goals such as reduced inequality, access to clean water and sanitation, increased education levels, and renewable energy production. Markets are open, but all regions focus on meeting development goals in a sustainable way. On the other hand, the economy under SSP5 is characterized by open markets, international trade, and a continued reliance on fossil fuels. SSP5 is typically seen as a higher net anthropogenic emissions baseline due to high growth and continued reliance on fossil energy (Riahi et al., 2017). These connected markets lead to the highest GDP growth of all the SSPs. Under this scenario, environmental challenges are managed through innovation, including geo-engineering and increases in agricultural productivity (O’Neill and et al., 2014).2
The benefit of using the SSP1 and SSP5 scenarios is that they are based on similar assumptions regarding future GDP growth (though population growth is higher for SSP5). Adopting similar future income levels allow us to test the sensitivity of model output to the modifications of individual parameters representing (1) domestic demand for agricultural products due to small changes in income but large shifts in dietary preferences, as well as shifts in export demand due to dietary changes; (2) domestic demand for, and international trade of, forest products; (3) patterns of urban- and suburbanization; and (4) enforcement of allowable timber harvest on protected lands. Table 1 depicts the scenario setup and general parameterization of the model relative to the descriptive SSP narrative found in Popp et al. (2017).
3.1 Agriculture Sector
In the agriculture sector, we translated the SSP assumptions into changes in domestic demand curves and trade. While projected per capita GDP is similar for each SSP, population growth estimates vary significantly. SSP1 projects a 2050 U.S. population of 466 million versus 713 million under SSP5 (Samir and Lutz, 2014). We translated these population growth rates into long-term demand growth increases of 10% under SSP1 and 50% under SSP5, by 2100, and relative to the previous FASOMGHG baseline demand growth assumptions from the version of the model presented in Baker et al. (2013), Latta et al. (2013), and U.S. EPA (2014); and Ogle et al. (2015). The resulting demand growth assumptions are presented in Table 1, which shows the net percent change in the demand curve in 2050 relative to the base period of 2015 in our simulations.
Then, we adjusted the composition of long-term diets under each scenario by introducing exogenous shifts to the demand function for grains/vegetables (including corn, soy, wheat, sorghum, rice, vegetable oils, and potato products), and livestock products (including pork, chicken, eggs, dairy products, and beef). Following previous investigations into national low-meat diet scenarios by Popp et al. (2010) and Westhoek et al. (2014), we assumed that demand for livestock products would increase approximately 25% by 2025 under SSP5 and decrease 25% under SSP1, relative to baseline assumptions in the previous version of the model. We calculated the corresponding increase or decrease in the demand for non-livestock products to compensate for the lost or gained calories from the change in livestock product consumption. It is important to note that the model focuses on agricultural commodities and does not include all caloric sources. A full product list is available in Beach et al. (2010). Including GDP and diet impacts, this equated to a shift in domestic livestock-product demand function of −23% for SSP1 and 43% for SSP5 by 2050 (Table 2). To represent a diet-shift globally, we assumed that the export demand for livestock-products increases by 10% under SSP5 and decreases by 10% under SSP1. Demand shocks relative to the 2015 base period are summarized in Table 2.
We acknowledge that this approach is different than the forest product demand shift methodology presented below that relies primarily on income elasticities. However, the SSP1 narrative suggests that per capita livestock product consumption should decrease, regardless of relatively high-income growth, due to sustain ability considerations. Given this inconsistency, we adopted relatively simplistic scenario assumptions on diet and consumption changes to conform to the basic SSP narratives presented in O’Neill and et al. (2014). The relative increases or decreases in livestock product and crop-based consumption affect the net projected change, or demand shift, for each independent commodity group. That is, we assume shifting demand over time for all agricultural commodities given population and income growth, but the relative growth for livestock products versus crop-based products changes between SSP1 and SSP5. These demand shifts are not hard constraints in the modeling framework, as prices and consumption are still endogenous. Shifting demand without requiring specific consumption levels allows for market reallocation with changing macroeconomic or policy conditions.
Under our base SSP5 assumption, increasing or decreasing crop-based product demand commensurate with livestock product demand changes maintains “caloric neutrality.” That is, we assume a similar level of caloric intake overall, so if livestock product consumption increases under SSP5, we assume that the relative portion of crop-based consumption shifts downward. In practice, this assumption may not hold as populations might instead increase consumption of all food sources as incomes rise. To reflect this possibility, we also conduct a robustness check of our results in which the caloric neutrality constraint is relaxed. This constraint is initially introduced to assure that shifts in consumption of agriculture products result in constant caloric intake, but relaxing this assumption allows crop-based consumption to change endogenously with the projected shift in livestock product demand. These sensitivity results are presented in the discussion section.
3.2 Forest Sector
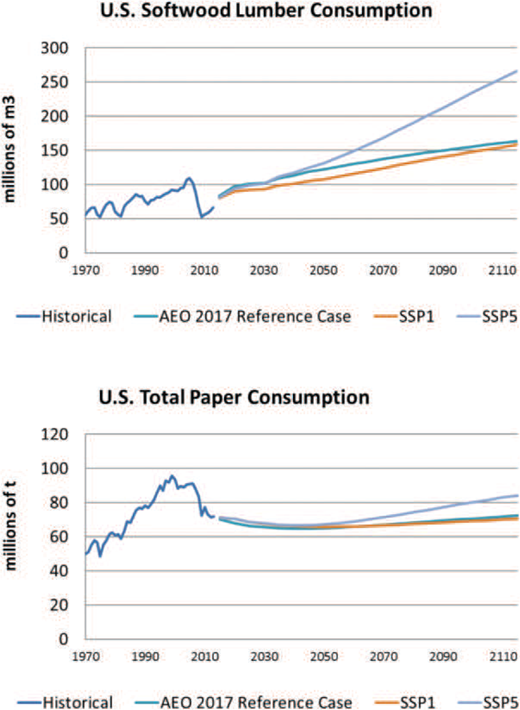
To translate the broad SSP narratives into quantitative forest sector scenarios, we defined changes in domestic demand for forest products and sector-specific trade assumptions. We shifted demand curves exogenously based on the projections of GDP and population from each SSP scenario (O’Neill and et al., 2014). The elasticities for shifting solid wood product demand curves come from (Ince et al., 2011), while elasticities for shifting paper product demand curves are from Latta et al. (2016). We shifted softwood lumber demand indirectly through housing starts and GDP, which we projected using their individual ratios to SSP scenario-specific GDP, following the approach outlined in Latta et al. (2018). Figure 1 provides an example of forest product projections for SSP1, SSP5, and the original AEO 2017 case presented in Latta et al. (2018) and used to form the basis of the new demand structure in this model.
We developed trade projections using estimates from a gravity model of trade, which regresses exports on the natural logarithm of exporter GDP, importer GDP, the distance between countries, and country-year indicators for each exporting and importing country (Silva and Tenreyro, 2006; Larson et al., 2018). We repeated this process for each forest product category in the FAOSTAT dataset on forest product bilateral trade flows (FAO, 2017). This process creates product-specific elasticities of trade by exporter and importer as a function of GDP, as well as a product-specific set of coefficients for the country/year indicators. We then combined the calculated trade elasticities with the projections of GDP across the SSP scenarios. We repeated this process for each exporting and importing country and aggregated the results to yield product-specific exogenous growth rates in U.S. imports and exports across SSP scenarios.
3.3 Land Protection
Consistent with previous versions of the model, private forest management is completely endogenous while the LURA framework allows the 2018 updated version of FASOMGHG to include public forest management as well. In this version, total public harvest levels remain exogenous yet the values have been updated to a more recent average level based on Timber Product Output (TPO) historic public harvest estimates between 1997 and 2012 (USFS, 2012). We used average county-level public forest removals to calibrate the supply of public softwood and hardwood timber resources to the market and then aggregate these volumes to each FASOMGHG region to represent an annual exogenous supply of timber, by region, that can be allocated to final forest product demand. The inclusion of the forest dynamics of public lands in this updated FASOMGHG means that when we incorporate scenario-specific public harvest rates we not only get a public-private interaction in forest product output and total carbon storage but also see a change in public forest carbon accounts as that exogenous harvest shifts across the public forest landscape. For this analysis, we developed scenarios representing relative levels of public forest protection consistent with the general SSP narratives. In addition to low population growth and low-meat diets (Riahi et al., 2017; Van Vuuren et al., 2017), our SSP1 scenario includes enhanced forest protection, which we represent in FASOMGHG through reduced harvesting in public forests. Under SSP5, higher population growth and increased meat consumption will put more pressure on public forests. Therefore, we assumed that allowable harvests are 10% below the historical average harvest under SSP1, and 10% higher under SSP5.
3.4 Urbanization
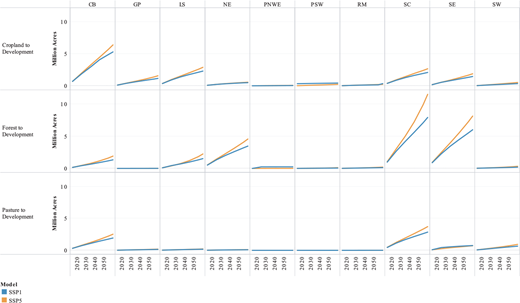
We incorporated land to urban development in the model using spatially explicit projections from the ICLUS project (U.S. EPA, 2017). ICLUS v2 produces projections of the population on a 90 m × 90 m pixel scale and land use that are aligned to SSP scenarios. These projections have been used in several health- and development-oriented papers (Voorhees et al., 2011; Bierwagen et al., 2010; Georgescu et al., 2014; Post et al., 2012), but have not previously been used to investigate AFOLU emissions across alternative development pathways. We aggregated the ICLUS-generated spatially explicit projections of urban- and suburban expansion of agriculture, pasture, and forest land cover under scenarios SSP1 and SSP5 to FASOM region to yield differentiated land to development transfers by land use type (Figure 2).
4 Results
In this section, we report the aggregate impacts of shifting from SSP1 to SSP5 assumptions, which we refer to as the SSP5-All scenario. We also report the impacts of shifting individual sector assumptions on product demand, land use change, and GHG fluxes; SSP5-Ag refers to individual modifications of the agriculture sector assumptions, SSP5-For to individual modification of the forest sector assumptions, and SSP5-Dev to individual modification of the urbanization assumptions. We omit presentation of the individual land protection case under SSP5, as this did not substantially differ from the SSP1 case across all evaluation indicators.
4.1 Forest Production
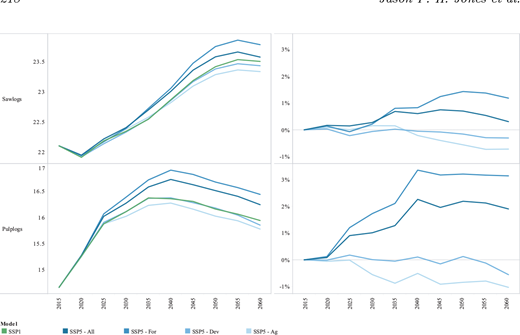
Total forest harvests and forest product supply are sensitive to SSP scenario assumptions. Results show that the production of forest products is roughly 0.5%–2% higher under SSP5-All than under SSP1 (Figure 3 shows the results for saw and pulp logs only; other products show similar differences over the simulation horizon). The projected increase in pulp log and saw log harvests is small relative to the total increased use of forest biomass for forest product production given that imported forest biomass also increases under SSP5, thus offsetting the need for an increase in domestic harvests commensurate with the total increase in demand.
Most forest product prices increase over time under growing demand. Softwood lumber prices are projected to increase over time, though the extent of this price increase varies across the different SSP scenarios. Initially, $255 in SSP1 and $323 in SSP5-All per 1000 cu ft, softwood lumber prices increase 3.9% year−1 under SSP5 with higher demand and 2.6% for SSP1. Hardwood lumber sees consistent demand over time, with limited response to changes in income and housing starts, unlike softwood lumber. Prices for pulpwood-based products generally rise as well, with less variation across SSP scenarios than softwood lumber shows. Both hardwood and softwood inventories increase over time, driven by investment and afforestation early in the simulation horizon. This expansion is higher under SSP5, especially for softwood inventories, as demand growth for softwood lumber is more than 20% higher under SSP5 than SSP1 by 2050.
Results indicate that forest harvests are higher under the individual SSP5- For scenario, in which only elements related to forest product demand are expanded relative to SSP1, compared to the SSP5-All case (Figure 3). Conversely, forestry production is lower under the individual SSP5-Ag scenario, in which we modified only elements related to agriculture demand, compared to the SSP5-All case. Thus, for scenarios that only increase demand for agricultural commodities, but without concomitant increases in demand for forest products, additional forest land will be converted to cropland as agricultural production shifts to the extensive and intensive margins to meet increased demand. This decreases forest inventories and forest product supply long-term relative to socioeconomic scenarios that consider growth in both agricultural and forest product demand. The SSP5-Dev case results show slightly reduced forestry production relative to SSP1 (−0.5% by 2060), primarily due to the encroachment of urban land into productive managed forest land in the southeast and south-central regions of the U.S.
4.2 Crop and Livestock Production
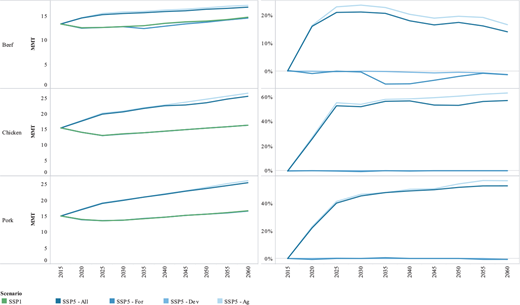
Under the SSP1 baseline, production of most livestock-based commodities initially declines but then begins to increase gradually over time, driven by lower crop commodity prices and feed costs. However, total livestock production does not expand significantly over time relative to current consumption rates for SSP1. Exogenous shifts in the demand curves for livestock products result in a 15% increase in beef production by 2060 for SSP5-Ag relative to SSP1, while chicken and pork production each increase by more than 50% relative to SSP1 (Figure 4). Under SSP5-Ag production of livestock is slightly higher than SSP5-All, suggesting that resource competition with forestry somewhat offsets the impacts of increased livestock product demand under SSP5-All.
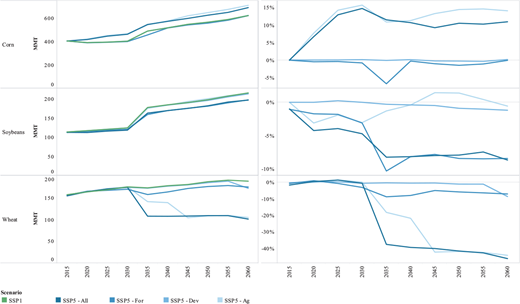
These diet changes result in a large reallocation of resources to support increased livestock production. For instance, we project an increase in corn production, the primary input to livestock production, of 10% under SSP5- Ag by 2060 (Figure 5). Conversely, soybean and wheat production decline under the influence of higher livestock product demand and increased corn production. Soybean production declines approximately 7% by 2060 under SSP5-All relative to SSP1, with relatively small differences between SSP5-All and SSP5-Ag. Under SSP-For, soybean production decreases near term (driven by extensive margin expansion in forestry), but then recovers and increases long-term relative to SSP1.
Wheat is the primary crop commodity that is most sensitive to SSP scenarios. Under all SSP5 scenarios, wheat production is projected to decrease relative to SSP1. In the SSP5-Ag scenario, this is driven by intensive margin expansion and crop mix reallocation towards more corn production to satisfy livestock feed demand. In the SSP5-For scenario reduced wheat production is driven by extensive margin forestry expansion, which encroaches on some wheat production in less profitable agricultural regions such as the South Central. The greatest decline in wheat production is seen for the SSP5-All, in which both extensive and intensive margin adjustments in agricultural land use result in a 40% reduction in U.S. wheat production by mid-century.
4.3 Land Use
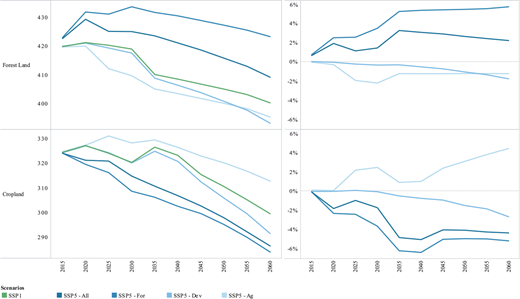
We project relatively large differences in total land use across SSP scenarios commensurate with variation in forest and agricultural production trends. It is important to note that all major land uses experience a slight decline over time relative to the base period as the encroachment of urban development (driven by ICLUS projections) reduces the land endowment available for managed agriculture and forestry (Figure 6). Under SSP5-Fort there is an initial increase in forest land, due to early extensive margin expansion (new planting) to meet anticipated future demand growth. This is followed by a decrease in forest land due to harvesting and conversion to other uses by mid-century. In aggregate, forest cover is 2.2% higher in SSP5-All and 5.7% higher in SSP5-For relative to the SSP1 baseline projection though 2060. The SSP5-All scenario forest land use projection is thus a product of a large initial increase in forests under SSP5-For, offset by decreases in forest land use under the SSP5–Ag and SSP5–Dev components, which drive endogenous land use competition and exogenous decreases in total land available, respectively.
Under SSP5-All we also project a decrease in cropland resulting in ∼5% less cropland than under SSP1 by 2060. SSP5–For results in a much faster decline in cropland area, whereas SSP5–Ag results in a slower decline and an increase in total cropland use overall relative to the SSP1 baseline. Thus, the forest product demand growth effect on land use is larger than the agricultural demand growth effect, resulting in a reallocation from cropland to forestry for the aggregate SSP5-All scenario.
Under SSP5-Dev both forests and croplands, principally in the southeast, are converted to urban areas, resulting in a slight decrease in both land cover types. Under this scenario, we estimate 2% more land to development by 2060 in both forest and cropland, compared to SSP1. This exogenous forcing on total land availability also drives land use competition and results in more land converted from cropland to forests in the SSP5-All case, mostly at the expense of wheat production.
4.4 GHG Emissions
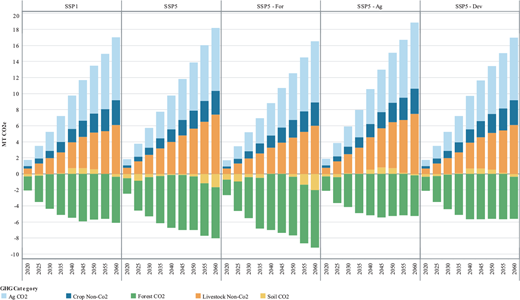
Forest carbon sequestration projections reported in this manuscript only capture biomass forest carbon sequestration changes and do not capture changes in carbon stored in wood product pools. Given this omission, net sequestration changes reported in this section are likely lower than full sequestration potential. Under SSP5-All we estimate increased CO2 sequestration from the forestry sector due to the increased demand for forest products, along with increased soil sequestration (Figure 7). On the other hand, under SSP5-All, shifts in diets and increased demand for livestock products increases net emissions from the livestock sector. The result is a net increase in sequestration (reduced anthropogenic emissions) under SSP5 relative to SSP1, which is somewhat counter-intuitive given the emphasis on sustain ability and green growth under SSP1. The net result of opposing forces in agricultural and forestry demand growth and land resource competition is a net change in sequestration of approximately 0.49 Gt CO2e more in 2030 for the SSP5-All scenario than the SSP1 scenario, a cumulative stock change difference of 50%. This difference increases to 0.77 Gt CO2e in 2060 relative to SSP1, however as a cumulative stock change difference this becomes 7%. Thus, early management interventions in anticipation of future demand lead to increased carbon storage early on, but this net difference between SSP1 and SSP5 becomes smaller over time.
Under the SSP5-Ag scenario, we see substantially increased emissions from the agriculture sector (0.58 Gt CO2e more cumulative emissions in 2030, and 1.8 Gt CO2e more emissions by 2060, than under SSP1), as well as reduced sequestration from the forest sector due to the conversion of forests to croplands (0.48 Gt CO2e by 2060). Conversely, under SSP5-For we see increased carbon storage due to afforestation and soil impacts (1.18 Gt CO2e more cumulative sequestration than in SSP1 by 2030, increasing to 3.07 Gt CO2e by 2060), as well as diminishing emissions from agriculture because of a smaller land area dedicated to crops and livestock (0.08 Gt CO2e fewer emissions in 2030, increasing to 0.51 Gt CO2e in 2060 relative to SSP1). Relative to SSP1 there are an additional 13.8 million acres of plantation forests in 2030 under SSP5-All and an additional 15.0 million acres by 2060. This intensive margin forest sector investment results in higher growth rates than naturally regenerated forests which leads to higher rates of carbon sequestration and hence increased sequestration rates overall. This is consistent with the result from Tian et al. (2018), which showed stable near-term emissions in the U.S. overall with forest product demand growth and management intensification.
However, unlike Tian et al. (2018), projected net sequestration rates from this study decline to mid-century, eventually becoming a source of emissions, as most investment occurs early in the simulation horizon and then tapers off. This effect is driven by several factors. First, Tian et al. (2018) consider a much longer simulation horizon, with forest product demand growing strongly for more than a century. This growth causes a continuation of forest management investments past mid-century and maintains higher forest carbon stocks. Also, Tian et al. (2018) is a global model, and recognizes the strong U.S. comparative advantage in forest product supply, whereas this model assumes exogenous growth rates for forest product imports and exports, and thus no global market feedback mechanism exists to incentivize continued investment in the forest resource base over the long term.
5 Discussion
This analysis applies a dynamic economic model of the U.S. agriculture and forestry sectors to demonstrate the impact of alternative assumptions about macroeconomic futures on modeled projections of product demand, land use, and GHG fluxes. Our analysis applies a newly updated agriculture and forest sector model, FASOMGHG, including significant agricultural sector updates and a completely redesigned and new forest sector model. SSP1 and SSP5 scenarios were translated from qualitative global narratives into highly detailed quantitative U.S. scenarios within this new framework. The elaboration of these scenarios provides a blueprint for translating the SSPs that can be used for a broad range of modeling applications and will improve comparability among model outputs.
Results show the potential implications of shifting from SSP1 to SSP5 assumptions both in aggregate and by individual components. The SSP5-Ag scenario, which reflects agricultural commodity demand growth and shifting diet preferences (albeit with similar income levels) results in the highest net emissions, as agricultural production shifts to the intensive and extensive margins to accommodate higher demand for livestock feed grains. On the other hand, the SSP5-For scenario results in the greatest increase in net carbon sequestration, as increasing domestic demand and trade of forest products increases relative returns to forest activities and results in investment in the forest resource base, also at the extensive (afforestation) and intensive margins (increased planting). Under SSP5-Dev, in which only changes in projected urban development are accounted for, results in increased conversion of forest and cropland to developed land and a net GHG emission increase by mid- century. Varying the assumptions of harvesting on public lands had little impact on our results, which is not surprising given that total hardwood and softwood removals on U.S. public timberland has only accounted for approximately 10% of total removals over the past 20 years (TPO, 2012). Our assumptions of a 10% increase or decrease in public harvests in either direction for SSP5 and SSP1, respectively, thus only amounts to approximately a 1% shift in total available harvests, which does not result in a substantial net change in carbon sequestration.
The SSP5 scenario results in larger net GHG sequestration relative to SSP1. The aggregate results are the product of increased emissions from the ag sector, offset by substantial sequestration from the forest sector, both driven by product demand in their respective sectors. This difference is larger early in the simulation horizon and cumulative anthropogenic emissions levels begin to converge after mid-century due to a strong near-term management intensification effect under SSP5 in which the forestry sector responds to anticipated demand growth by switching to more productive planted systems. It is important to note that our study only considers a relatively small portion of all anthropogenic emissions in the U.S. and that energy and industrial sector emissions would almost certainly rise in an SSP5 world relative to an SSP1 scenario, and this increase in emissions would outweigh changes in net AFOLU emissions. Furthermore, land management changes globally from anticipated SSP5 market changes relative to SSP1 could result in higher net AFOLU emissions globally, driven by high rates of land use change in regions that expand agricultural production.
Nevertheless, our results indicate that in the U.S. context increased sequestration levels from forest management changes could outweigh increased emissions from crop and livestock production given strong demand growth in each sector. These results illustrate a potential challenge of myopic considerations of a single sector in projections modeling. An SSP scenario is a collection of elements that are not mutually exclusive, and accounting for cross-sector interactions is important to understand possible emissions pathways under different socioeconomic futures. While integrated assessment or computable general equilibrium models capture important interactions across many sectors of the economy for projecting SSPs, these frameworks could lack sufficient detail related to specific forest or agricultural product markets, and how the interactions between crop, livestock, and forest production systems can affect land use and management change under anticipated future market and policy changes (Baker et al., 2018).
While there are examples in the literature that link forest product demand growth to decreased forest carbon sequestration in the U.S. (e.g., Nepal et al., 2013 and Latta et al., 2018), this analysis aligns with more recent assessments that project increased U.S. carbon sequestration with higher forest product demand (e.g., Tian et al., 2018 and Kim et al., 2018). The key difference in these projections, discussed in detail in Tian et al. (2018), is that structural dynamic models of land use systems will invest in the resource base in anticipation of demand growth, and there is generally a positive relationship between management interventions and increased carbon sequestration in forestry. Reduced form or recursive dynamic approaches that do not account for endogenous land use or management possibilities will not capture such carbon changes.
Furthermore, we argue that intertemporal management considerations are important for developing long-term projections of resource management across alternative socio-economic futures. While perfect foresight is often a rigid assumption in systems modeling applications, there is documented evidence that forest managers respond to anticipated future market conditions when making management decisions and that the relationship between forest resource investment and carbon is positive (Tian et al., 2018). Our results are consistent with the findings in Tian et al. (2018), which applies a different modeling framework. Other recent studies show that forest management has been increasing over time and carbon stocks have been stable or growing globally due to both management and land use factors (Pan et al., 2011; FAO, 2017). Our results align with recent literature that projects terrestrial carbon growth under growing demand for timber products or policy-induced demand for forest-based bioenergy feedstocks (Latta et al., 2013; Galik and Abt, 2016; Baker et al., 2018; Kim et al., 2018; Tian et al., 2018).
We tested the robustness of this result to the SSP5 scenario assumptions regarding dietary preferences. Specifically, we ran an additional scenario that relaxed the caloric neutrality constraint that reduced the demand for plant- based calories in SSP5 with assumed growth in livestock product consumption. The purpose of this sensitivity run was to stimulate crop production for additional calories (holding the exogenous livestock product demand growth target constant) to assess resulting land use and emissions projections. Results from this sensitivity run (not shown in the primary results section) show small minimal changes in agricultural land use and emissions. Minor crop production increases were found for this sensitivity scenario, but trade adjustments (e.g., reduced grain exports) supplied much of the additional crop demand. Thus, emissions results from the SSP5-All case appear robust to assumptions regarding dietary preferences and relaxing the caloric neutrality assumption.
There are some limitations to this study. Notably, we only conduct a partial equilibrium modeling exercise of alternative SSPs and do not account for broader connections to energy and industrial sectors that could drive changes in production costs and the demand for bioenergy feedstocks. Second, we made exogenous assumptions to shock demand and land management systems that generally relate to the SSPs and allow for a general comparison of different forcing mechanisms, though there are potentially an infinite number of interpretations of how the global SSP narratives translate to national- scale market and policy shocks. Finally, we do not directly account for international leakage or global market feedback across alternative SSPs. Despite these limitations, we argue that this manuscript offers several contributions to the growing literature around land use sector projections modeling and GHG emissions. This research projects market and environmental impacts of simulating changes to individual SSP narrative elements within and across sectors. Modeling studies that select single elements of an SSP scenario should exercise caution if the interaction effects from other SSP elements within a single scenario can lead to different outcomes within and across different sectors. Likewise, the impact of an SSP component is sensitive to how that component is translated to a single country or market system, and SSP narrative components may not always conform to standard economic theory. One example of this is the assumption in SSP1 of decreasing livestock product demand with increasing GDP. Future research is needed to quantify the sensitivity of model results to specific SSP components and to compare results across alternative modeling frameworks.
6 Conclusion
This study contributes to the literature by developing forest carbon and other AFOLU emissions projections while directly accounting for the interface between agriculture and forestry and evaluating changes in these projections when each sector faces future demand growth. Our SSP scenarios are designed such that agricultural product demand increases by a wider margin under SSP5 relative to SSP1 than forest product demand. Yet, net emissions decline under the SSP5 aggregate scenario given intensive and extensive margin shifts in forestry, which is inconsistent with the basic narrative of SSP5 (at a macro level).
The sensitivity of forest carbon projections to future demand growth has important policy implications. In regions such as the U.S., where published forest carbon projections vary widely, policy mechanisms that support increased carbon sequestration could provide a risk management tool for achieving targeted emissions reductions in the general economy or ensuring that baseline emissions do not deviate substantially from projections used for establishing mitigation goals. Our results indicate that policy incentives designed to increase the utilization of forest biomass for a variety of end uses could result in increased management and investment in the forest resource base, and hence higher sequestration potential in forest biomass and (potentially) forest product pools.
Notes
Not only can a projected baseline influence the estimate of mitigation potential available from AFOLU activities, but the changing contribution of these sectors to economy-wide emissions over time may substantially influence the level of mitigation required from other sectors of the U.S. economy to meet future decarbonization targets or related policy objectives (Van Winkle et al., 2017).
For purposes of this analysis, we assume that agriculture and forestry technology (yields) evolve similarly under alternative SSPs.