


A quay wall directly next to a building, both dating from around 1870, collapsed along the Grimburgwal in Amsterdam, the Netherlands, on 1 September 2020. The historic quay wall consisted of a masonry wall, built of a timber deck supported by several rows of timber piles of about 12 m long. As over 200 km of such quays exists in Amsterdam and streets are usually very busy, the collapse triggered the question of the safety of the remaining quay walls in the city. A forensic investigation was carried out to determine the failure mechanisms and factors that contributed to the collapse. The investigation aimed to learn from this event and to prevent similar failures in the future. The main failure mechanisms and contributing factors were identified and confirmed using an integrated model of the quay, which is both simple and robust. The model was used to perform a sensitivity study taking all relevant uncertain factors into account. This work provided valuable insight into the main collapse mechanisms of the wall. Based on the results of this forensic study, it is possible to assess other historic quays.
Notation
- D
diameter of a pile
- EI
bending stiffness of the wall
- Fh
horizontal force on the quay wall from the fill
- Fs
force from the sheet pile on the deck
- ki,j
spring stiffness of pile–soil interaction i in layer j
- r
rotational stiffness of pile-crossbeam connection (piles 1,2..n)
- qfill
weight of the soil fill (sand and clay) on the deck
- qi,j
soil pressure of pile i in layer j
- qs
horizontal pressure from the sheet pile on the front pile row
- qwall
weight of the masonry wall on the deck
- y
displacement of the pile in the soil
- μ
mean value of the maximum bending stress in the timber
1 Introduction
On 1 September 2020, part of the quay wall along the Grimburgwal (GBW) in Amsterdam, the Netherlands, collapsed. It concerns a quay right adjacent to an educational building, both dating from around 1870. A picture of the collapsed quay can be seen in Figure 1. During the collapse, video images were taken by a security camera, which show that the quay leans forward into the canal and a stretch of about 25 m disappears into the canal. As streets in Amsterdam are usually very busy, the collapse triggered the question of the safety of the remaining quay walls in the city. This paper describes the forensic investigation that was carried out to determine the failure mechanisms and factors that contributed to the collapse. The investigation aimed to learn from this failure and prevent similar failures in the future. Such an investigation is crucial, as Amsterdam has over 800 km of quay walls, of which about 200 km is historic and potentially not capable of fulfilling their current function.
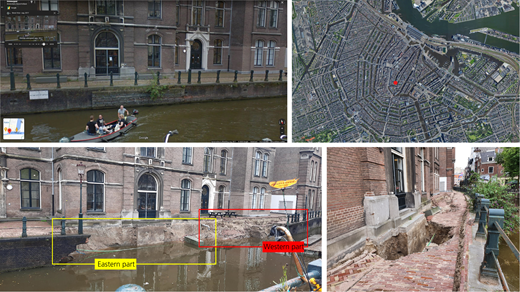
Collapsed quay and location in Amsterdam. Top left: initial condition of the quay in May 2019; picture from Google. © Google. Top right: location of GBW in Amsterdam at red dot. Bottom left: front view of quay just after collapse. Bottom right: surface view just before collapse
Collapsed quay and location in Amsterdam. Top left: initial condition of the quay in May 2019; picture from Google. © Google. Top right: location of GBW in Amsterdam at red dot. Bottom left: front view of quay just after collapse. Bottom right: surface view just before collapse
The historic quay walls are part of the UN Educational, Scientific and Cultural Organization heritage site of the canals of Amsterdam and as such are invaluable. They usually consist of a masonry wall, built on a timber deck, found on several rows of timber piles about 12 m long. Typical cross-sections are shown in Figure 2. In situ, the actual assembly, geometry and size of the structures show a large variation. The structures can be as old as 300 years and are often remarkably robust, given the fact that city conditions and traffic loads have dramatically changed over time. However, after all these years, it is not surprising that a large renewal operation is currently ongoing.
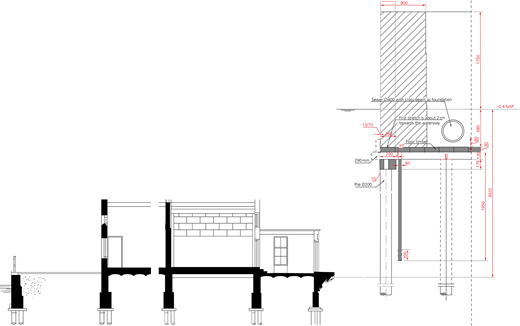
Cross-section of the quay wall according to historic evidence (the quay was built around 1875) on the left, and cross-section according to divers’ inspection with dimensions on the right (dimensions are in mm). NAP, Amsterdam Ordnance Datum
Cross-section of the quay wall according to historic evidence (the quay was built around 1875) on the left, and cross-section according to divers’ inspection with dimensions on the right (dimensions are in mm). NAP, Amsterdam Ordnance Datum
Since the collapse of the GBW was well documented, significant value can be found in studying the cause of the collapse and the failure mechanisms that occurred in the GBW event. It is unique that the collapse was captured on camera and showed such a clear overall deformation and failure mode.
This paper summarises the forensic engineering analysis of the collapse of the GBW as it was performed by a consortium led by Delft University of Technology. As the collapse raised concerns regarding the safety of quay walls in Amsterdam, the investigation aimed to establish the lessons that can be learned from the collapse of the GBW for other quays. The investigation was a multidisciplinary effort of specialists in masonry, timber, hydraulic engineering, monitoring and geotechnics. The full documentation of the collapse is available in Dutch in the report by Korff et al. (2021).
2 Methodology: the forensic engineering approach
The forensic engineering approach was used, which means that in a structured way, information is gathered, a list of potential failure mechanisms is developed and these are combined to determine the most likely cause of events and contributing factors to the collapse. The six steps as described in the paper by Terwel et al. (2018) on the Dutch approach are followed, which start with orientation, followed by data collection, hypothesis generation, hypothesis testing and reporting of findings and finish with recommendations.
3 Findings and results
3.1 Step 1: orientation; step 2: data collection
As a first orientation, the investigation team visited the site on the day of the collapse as well as 2 days after the collapse. In the data collection step that followed, a large amount of evidence (recent and historic) was collected, with great help from the City of Amsterdam.
Conditions and circumstances of particular interest included the loading conditions and exposure of the structure during its service life. Significant traffic loading could be excluded, as no vehicles are allowed on this part of the quay. The location of the collapse is exactly on a spot where ships have to perform a difficult manoeuvre to turn and to steer into a narrow clearance under a historic bridge opposite of the failed quay. Signs of multiple ship collisions were found (see Figure 1). In old drawings, an older quay was found to cross the current quay near the site of the collapse. Also, the meteorological conditions just before the collapse were investigated. In 2014 the foundation of the building behind the quay was renewed. New piles were installed from the inside of the building. Interference with the foundation of the quay wall at the spot where the proximity of building and quay is closest could not be excluded.
Interesting sources of information were the old historic information on the contract from 1875 (Figure 2), photographs of bystanders (Figures 1 and 3(b)), footage from security cameras available at NOS (2020), depth of the canal bed (Figure 4), the study of the remains of the quay above as well as underwater (Figure 5) and satellite measurements (Figure 6). The data were processed, which resulted in timelines, drawings (Figure 7) and cross-sections (Figure 2).
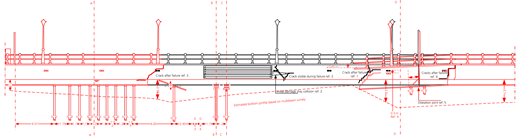
Front view of the wall. In black, the situation prior to collapse; in red, the situation found after collapse, including crack locations (dimensions are in m). East is on the left; west is on the right
Front view of the wall. In black, the situation prior to collapse; in red, the situation found after collapse, including crack locations (dimensions are in m). East is on the left; west is on the right
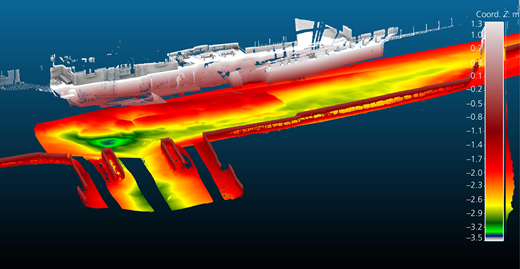
Visualisation of the multibeam and three-dimensional scan made after collapse of the quay by Van Gellecum (2021). The colour red refers to shallow bed levels, showing debris in canal and quays and bridge foundations opposite of collapsed stretch, and colours green to blue refer to the deepest canal bed level (NAP −3.25 m and locally to NAP −3.5 m)
Visualisation of the multibeam and three-dimensional scan made after collapse of the quay by Van Gellecum (2021). The colour red refers to shallow bed levels, showing debris in canal and quays and bridge foundations opposite of collapsed stretch, and colours green to blue refer to the deepest canal bed level (NAP −3.25 m and locally to NAP −3.5 m)
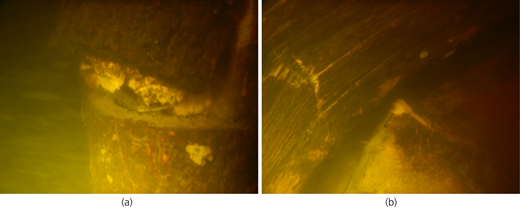
Pictures of the collapsed foundation under water by Van Gellecum (2021): (a) broken pile; (b) broken cross-beam
Pictures of the collapsed foundation under water by Van Gellecum (2021): (a) broken pile; (b) broken cross-beam
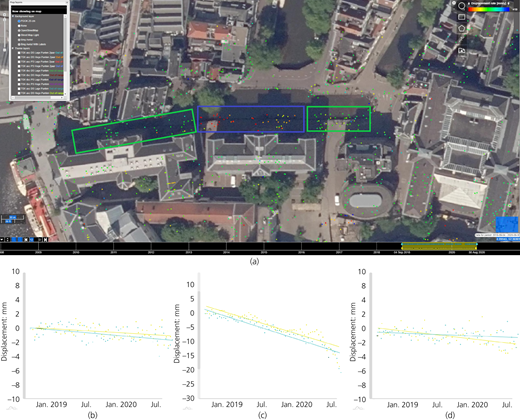
Satellite measurements with (a) overview of settlement reflection points over the 2 years before the collapse on a scale of −10 mm in red to +10 mm in blue. (b, d) Settlement point average of the zones on either side of the collapse in green rectangles in (a) and (c) settlement point average of the collapsed section in blue rectangle in (a); results from both ascending (yellow) and descending (blue) tracks are shown
Satellite measurements with (a) overview of settlement reflection points over the 2 years before the collapse on a scale of −10 mm in red to +10 mm in blue. (b, d) Settlement point average of the zones on either side of the collapse in green rectangles in (a) and (c) settlement point average of the collapsed section in blue rectangle in (a); results from both ascending (yellow) and descending (blue) tracks are shown
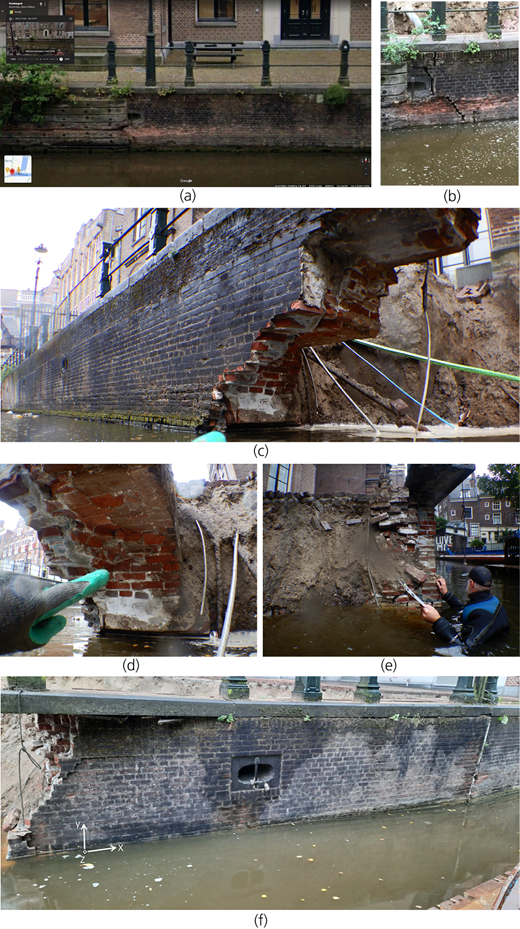
Cracks in the quay. (a) Ship collision crack ref. 2 from Google 1 year before collapse. © Google. (b) Crack B visible minutes before the collapse. (c) Eastern crack ref. 3 after collapse. (d) Eastern crack ref. 3 detail with sharp surface in bricks. (e) Western crack C after collapse. (f) Front view of western crack ref. 1 left and dilation joint ref. 5 on the right
Cracks in the quay. (a) Ship collision crack ref. 2 from Google 1 year before collapse. © Google. (b) Crack B visible minutes before the collapse. (c) Eastern crack ref. 3 after collapse. (d) Eastern crack ref. 3 detail with sharp surface in bricks. (e) Western crack C after collapse. (f) Front view of western crack ref. 1 left and dilation joint ref. 5 on the right
From the data, the order of the collapse was established based on the information shown earlier and the investigation of cracks in the masonry above water and the timber underwater. The study of the failure of the GBW revealed that the quay collapse had occurred in several phases. Initially, there was a horizontal deformation of the quay, and a few days before it collapsed, holes were found in the paving. The quay then became detached following a subsequent vertical deformation and fell out of plane towards the canal. A section of the wall of approximately 25 m long submerged completely. The collapse started in the eastern part. The western part was pulled along and tilted as a result; see Figure 8 for a visualisation of the collapse in progress and the relative movements of the masonry sections.

Part of the three-dimensional animation of the collapse with relative movements of different sections just before full collapse
Part of the three-dimensional animation of the collapse with relative movements of different sections just before full collapse
A detailed assessment of the cracks (see Figure 7 for the crack locations and identification) was made. The middle crack (crack ref. 2) was clearly visible a few minutes before the collapse of the structure (Figure 3(b)). The crack was located in an area subject to extensive damage due to mainly boat impacts, opened and deformed out of plane. The latter can be related to actions of the soil laterally pushing the quay wall. It is not clear if the crack already existed before the collapse of the quay wall started.
On the eastern side of the collapsed quay wall, a regular diagonal/vertical crack (crack ref. 3) was observed (Figure 3(c)). The surface shows an identical shape along the entire thickness of the quay wall. This indicates that out-of-plane torsional actions are to be excluded. The eastern crack is vertical on the top part of the quay wall. To obtain this pattern, a deformation along the quay wall was required. This deformation can be triggered by an in-plane rotation of the failed part of the quay wall. The eastern crack shows a sequence of horizontal and diagonal sections just below the top part of the quay wall. To form such a pattern, a deformation along the vertical direction was required. This deformation can be triggered by an in-plane rotation of the failed part of the quay wall and/or an in-plane vertical collapse of the failed part of the quay wall.
Pictures available in Figures 3(c) and 3(d) indicate that the failure occurred in a restricted time span, as all cracks, excluding the previously described existing cracks, are fresh. However, damage due to environmental conditions at the waterline, which can also be seen in these pictures, can be a sign of earlier deterioration of the material.
On the western side of the collapsed quay wall, a diagonal/vertical crack was observed, indicated as ref. 1 in Figure 7 and in detail shown in Figure 3(e). The surface shows an irregular shape along the thickness of the quay wall, including the opening of vertical joints in the thickness. This indicates that out-of-plane torsional actions occurred in this section. Considering the out-of-plane deformation of the remaining part observed at the front side of the quay wall (Figure 3(e)), it is possible that the collapsed western part failed due to out-of-plane torsional actions and out-of-plane overturning action. From the overview, it is possible to observe that the remaining part of the quay wall shows a residual vertical deformation. This deformation can be triggered by an in-plane rotation of the failed part of the quay wall and/or an in-plane vertical collapse of the failed part of the quay wall.
Furthermore, Figure 3(f) on the right shows a dilatation joint (ref. 5) with an opening without the presence of out-of-plane deformations. This potential in-plane deformation is compatible with the vertical residual deformation recorded for the remaining part of the quay wall. Lastly, a tapered crack (crack ref. 4) cuts through the quay wall on the most western part. This crack is consistent with the vertical residual deformation recorded for the remaining part of the quay wall.
The last phase of the failure process is shown in a three-dimensional sketch in Figure 8.
3.2 Step 3: hypothesis generation
In this step, all possible failure mechanisms were determined. Loading conditions and the strength or capacity of the structure were determined for each mechanism. For both load and strength, so-called influence factors (either contributing to the loss of strength or a higher than normal load) were also investigated.
Some of the most important mechanisms are shown in Figure 9 and can be found in general sense in, for example, the handbook Quay Walls (De Gijt and Broeken, 2013) or the Dutch handbook of inner-city quay walls (Roubos and Grotegoed, 2014). From left to right, Figure 9 shows the horizontal bending of the piles and local geotechnical failure of soil around the piles, the overturning of the masonry wall, cross-beam failure and horizontal sliding of the masonry from the deck. Other failure mechanisms investigated include the axial capacity of the foundation piles and the structural failure of the masonry wall.
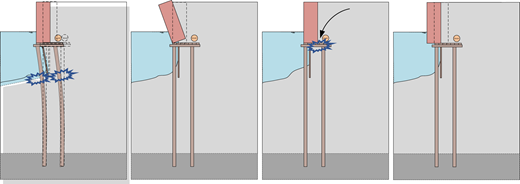
Most relevant failure mechanisms for the quay wall from left to right: horizontal bending of the piles and local geotechnical failure of soil around the piles, overturning of the masonry wall, cross-beam failure and horizontal sliding of the masonry from the deck
Most relevant failure mechanisms for the quay wall from left to right: horizontal bending of the piles and local geotechnical failure of soil around the piles, overturning of the masonry wall, cross-beam failure and horizontal sliding of the masonry from the deck
Several potential factors influencing the loads were determined. These include, among others, incidental loads on the quay, heavy rainfall, drought, wave impact, foundation works at the adjacent building and replacement work of the pavement on top of the quay. The following most relevant loss of strength factors were identified: damage to masonry from ship impact, the deeper bottom of the canal bed and environmental degradation mechanisms of masonry and timber.
3.3 Step 4: hypothesis testing; step 5: reporting of findings
In step 4, modelling took place to determine the most likely (combination of) failure mechanisms based on the information collected in steps 1–3. The overturning mechanism turned out to be stable with a low factor of safety for most combinations of loads. This, therefore, was not considered as the initiating mechanism. The pile axial capacity was sufficient to resist the axial loads, even though according to the historic evidence, the piles were shorter than normal. This excluded a local axial failure of the piles being the initiating mechanism. Other important assessments were made with a model describing the geotechnical and structural behaviour of the foundation of the quay, with a masonry wall and soil fill of clay and sand on top of a timber deck supported by timber piles. These calculations were performed by using a model developed by one of the team members (Hemel et al., 2022) using an elastic-perfect-plastic soil–pile behaviour. The main principle of the model is shown in Figure 10, and the results are in Figure 11. As it was clear from step 1 that the bottom of the canal was deepened up to 1.5 m by erosion (most likely by boats), the response of the foundation of the quay to the deepening of the canal was assessed for various situations. The variations included two and three pile row foundations, pile diameters of 0.2 and 0.25 m and canal bed depths between Amsterdam Ordnance Datum (NAP) −1.2 m and NAP −3.2 m, as all these variations were found in the data collection step. Since it was not certain whether the quay was supported on two- or three-row pile foundations, both options were modelled.
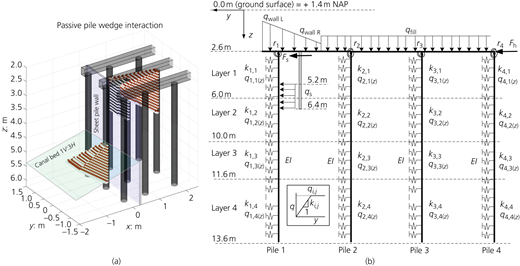
(a) Three-dimensional passive wedge model for computing the plastic limit of p–y springs with nine piles and three cross-beams shown as well as the sheet pile wall behind the front pile row and the canal bed; (b) structural model showing in cross-section the schematised springs resisting and loads acting on the piles and the cross-beam
(a) Three-dimensional passive wedge model for computing the plastic limit of p–y springs with nine piles and three cross-beams shown as well as the sheet pile wall behind the front pile row and the canal bed; (b) structural model showing in cross-section the schematised springs resisting and loads acting on the piles and the cross-beam
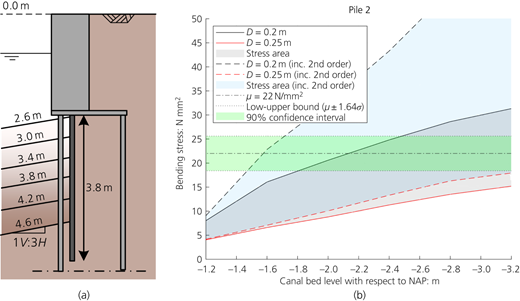
Results of the bending stress in the piles (a) depending on the depth of the canal and (b) for different pile diameters, first- and second-order calculations and strength of the timber
Results of the bending stress in the piles (a) depending on the depth of the canal and (b) for different pile diameters, first- and second-order calculations and strength of the timber
From Figure 11, it can be seen that for the two-row pile system, the bending stress in both pile rows exceeded the timber capacity (in green) for the smaller piles even for small increases in canal bed depths. For larger pile diameters, this was not the case nor for quays with three pile rows. Comparing the results of the bending of the piles with the initial horizontal movement of the quay as seen in Figure 1 and the deformations of the satellite measurements in Figure 6, as well as the broken foundation parts in Figure 5, leads to a consistent collapse mechanism.
The main failure mechanism was the horizontal bending of the piles as a result of a local deepening of the canal followed by breaking of the quay piles. This explanation assumes that only two rows of piles were present or functioned effectively over at least part of the quay. This is in accordance with the historic evidence and the underwater inspection and is also the most likely given the very short distance from the quay to the building behind it, where there is not enough space for a system with three piles. The long-existing cracks in the masonry wall reduced the possibility of redistribution of forces in the quay in the longitudinal direction, so that the loads could no longer be transferred to the stronger parts (with three rows of piles). The analyses were carried out with the assumption that the timber was not degraded, which to date needs to be confirmed. The presence of the old quay, crossing the current quay near the site of the collapse, might also have contributed or might explain the presence of only two pile rows locally.
The cause of the deeper canal bed is likely related to the fact that the canal is very narrow at this location and exactly at this spot the tour boats turn sharply under a bridge. It has been observed that the depth of the canal increases in the direction of the bridge and then decreases again. The repeated collisions of the tour boats have weakened the quay. Ship traffic was a cause of masonry damage, which caused a precondition with less ability to distribute loads along the quay. The trigger for the collapse was believed to be the renewal of the pavement in May and August 2020. This repaving was necessary as a result of the deformation of the quay that occurred before. The effects of this repavement were clearly recognisable in the satellite measurements that show an increased settlement rate over time during repaving. Groundwater flow and drought/rain may also have played a role in accelerating the failure in combination with the horizontal quay deformation that had already occurred and the leakage path from behind the quay towards the canal for the formation of holes in the pavement as shown in Figure 1.
After determining the most likely contributing factors to the collapse, measures were identified for the City of Amsterdam to implement for assessment of other historic quays.
4 Step 6: recommendations and lessons learned
This assessment has shown that the geometry of the quay played an important role in the sensitivity of the quay to the deepening of the canal. This resulted in measures/follow-up actions being recommended related to stress testing the historic quays in Amsterdam. The main recommendations are to check other places with soil erosion of the canal bottom, quays that have only two rows of piles as foundation and/or quays with damage of the masonry in the form of cracks.
Furthermore, it was found that interferometric synthetic aperture radar (InSar) measurements provided a good insight into the weakness of the quay wall section, as it was possible to identify deviating settlements of the street behind the quay already long before the collapse. The vertical settlements are a result of horizontal deformation of the quay, an indicator of possible collapse. It is thus possible to use InSar in the stress testing of quay walls and to reduce the risk of collapse by paying systematic attention to settlements behind the quays. Analysis of the subsidence of the quays with InSar measurements can help map other ‘hotspots’. Additionally, a registration/notification system can be set up for the occurrence of subsidence on the quays or necessary street work. Also, it is advised to perform measurements of the quays (preferably not only horizontally on the quays but also vertically) and to investigate the relationship between the deformation and possible failure (numerical or experimental). Further analyses must be performed to determine which limit values indicate failure.
To reach final conclusions and answers to the research questions, more in-depth analyses are required of the most likely failure mechanisms. Specifically, the exact geometry and strength of the timber structure of the GBW need to be determined.
5 Conclusions
A forensic engineering approach was applied to determine the most likely cause of events and contributing factors to the collapse of the GBW in Amsterdam on 1 September 2020. In a structured way, information was gathered, a list of possible failure mechanisms was made and the two were combined to determine the most likely cause of events and contributing factors to the collapse.
In the GBW collapse, the main failure mechanisms that occurred were the horizontal bending of the piles, leading to loss of soil behind the quay (sinkholes) and loss of stability and collapse of the timber foundation, initiating the progressive rotation out of plane of the whole structure. Factors that contributed to the collapse are the deepening of the canal and the long-time ship impact on the masonry. The most likely trigger of the collapse is thought to be the repaving of the street after settlements occurred due to initial horizontal quay wall movements.
This study has shown that it is possible to obtain an impression of the stability of the quay using rather simple calculation methods for overturning, sliding, horizontal bending and axial pile capacity. Combined with satellite (InSar) measurements, this can be used in stress testing of other historic quay walls. Further development and validation of models for combined calculation of the entire structure (deck, masonry, piles) such as by Hemel et al. (2022) is necessary, because they are not yet commonplace.
Acknowledgements
The research team is grateful for the opportunity that the City of Amsterdam has provided to study this collapsed structure. A lot of information was provided by the City of Amsterdam, particularly by the teams of Joost Beljon and Rinske van Schooneveld. The full team for this research project consisted of Dr Mandy Korff (project lead, Delft University of Technology (DUT)/Deltares); Mart-Jan Hemel MSc (AMS/DUT); Dr Dirk Jan Peters, Professor Bas Jonkman, Dr Rita Esposito, Professor J. W. van de Kuilen, Dr Geert Ravenshorst, Paul Korswagen MSc and Alfonso Prosperi MSc (all DUT); Maarten de Groot MSc (SkyGeo); Patrick Stoppelman (SkyGeo); Dr Pantelis Karamitopoulos (AMS/DUT); and Dr Henk Wolfert (AMS).

