Since the introduction by UK insurers of cover for subsidence of the foundations to domestic properties in the early 1970s there has been a considerable rise in both the number of subsidence claims per annum and in the occurrence of claims surges related to clay shrinkage and periods of dry weather. The cost to date of the associated remedial works to shallow foundations runs to billions of pounds. The incidence of subsidence claims and claims surges over the previous three decades has been reviewed in relation to rainfall data from which it is concluded that both phenomena are closely linked to both rainfall deficits and to climate change. It is further concluded, on the basis of the historical data, that surges in subsidence claims can occur with little or no warning, irrespective of the antecedent soil moisture conditions. If current climate changes continue, the pattern of subsidence claims and surges is likely to continue. Whether or not recent events represent permanent climate change or normal variation is still very much open to debate.
1. INTRODUCTION
The mechanism by which moisture abstraction from shrinkable clay soils, particularly as a result of tree-root activity, leads to large increases in effective stress and subsidence of foundations is well understood.1–3 The degree of subsidence is primarily a function of the shrinkability of the clay, the type, size, number and location of the trees and the climate. Climatological effects include both normal seasonal variations in rainfall and evaporation, as well as extremes–floods and droughts.
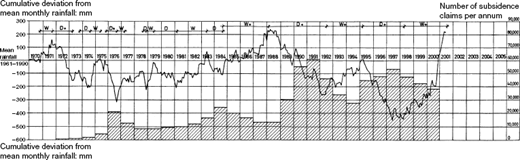
Since the introduction of insurance cover for subsidence of domestic properties, statistics (see Fig. 1) published by the Association of British Insurers (ABI) covering the period 1972 to 2000 reveal two immediately obvious facts
an overall rise in the number of claims per annum, from less than 500 in 1972 to in excess of 38 000 in 2000
the occurrence of a number of periods with annual claims elevated well above the prevailing norm, commonly referred to within the insurance industry as claims surges.
Both the annual claims totals and the size of the claims surges are of interest to insurers for obvious financial reasons. With an average claims settlement figure of the order of £9000, the annual subsidence claims bill runs to in excess of £350 million, much of which relates to remedial works to foundations. Claims surges, however, additionally put enormous pressure on insurers and their engineers in order for the claims to be processed within acceptable time-scales.
The ability to anticipate future trends and, in particular, claims surges would be of benefit in relation to insurers' resource planning. In the following, the history of subsidence claims is reviewed together with climatic trends to see what, if anything, they say about the future.
2. SUBSIDENCE CLAIMS AND RAINFALL DEFICITS
The ABI records reproduced in Fig. 1 also show that, since subsidence cover was introduced
there have been claims surges in 1976, 1983/84, 1989/91 and 1995/97
following each claims surge the underlying base level of claims has risen as follows
pre-1976, a few thousand per annum
1977–1982, about 10 000 per annum
1986–1988, about 15 000 per annum
1993–1994, about 25 000 per annum
1999–2001, about 35 000 per annum.
The rainfall data presented in Fig. 1 represent the monthly totals for a station in the Chelsea Physic Garden, West London, for which the mean annual rainfall is 604 mm. They have been plotted as the cumulative deviation from the mean monthly rainfall (1961–1990). This means that, starting at an arbitrary zero datum (in this case 1970, just prior to the introduction of insurance cover for subsidence), each month's rainfall is compared to the mean and either added (a surplus for the month relative to the mean) or subtracted (a deficit for the month relative to the mean) from the running total. Thus
if the rainfall for the month is average, the graph is horizontal
if it is drier than average, it slopes down to the right
if it is wetter than average, it slopes up to the right.
The rainfall graph clearly depicts a number of drier than average and wetter than average sequences. Extremely dry sequences (times of drought) have been designated D+ on the graph (1971–73, 1975–76, 1988–92, 1995–98) and correspond to cumulative rainfall deficits of the order of 300 mm or greater (i.e. a deficit in excess of 50% of the mean annual rainfall total). Similarly, extremely wet sequences (times of flood) have been designated W+ (1984–88, 1992–95, 1998–2001) and correspond to cumulative surpluses of the order of 300 mm or more.
Figure 1 shows that the period 1984–2001 has been dominated by a sequence of large deficits and surpluses following one upon the other. Prior to 1984, conditions were generally closer to average with less extreme dry and wet periods. Cumulative deficits (D) and surpluses (W) in excess of 100 mm and less than 300 mm, indicating less extreme dry and wet periods, are therefore also indicated on Fig. 1.
3. CLIMATALOGICAL TRENDS
Recent occurrences of extremes of climate, producing floods and droughts in rapid succession, have prompted much speculation with respect to climate change. A detailed analysis of meteorological data4 suggested that since the 1970s and coincident with the introduction of insurance cover for subsidence
the long-term imbalance of rainfall between the northwest of the UK (wetter) and the south-east (drier) has increased with the north-west correspondingly wetter and the south-east drier
the ratio between the winter and summer rainfall totals, which long term has been close to unity, has increased significantly, with winter rainfall now typically 20% higher than the summer
both summers and winters showed a tendency to be warmer, consistent with a reported 1°C rise in average temperatures over the past century, with approximately 0·5°C over the past 20 years.
An explanation advanced for the warm, wet conditions experienced of late is the atmospheric pressure difference over the North Atlantic (the North Atlantic Oscillation5) which, again since the early 1970s has been positive, producing mostly mild, wet and stormy winters. Prior to this, however, the pressure difference was largely negative during the 1940s, 1950s and 1960s, producing mostly cold, dry and calm winters. Thus, it is suggested5 that the prognoses of a new ice age in the late 1960s/early 1970s and of global warming in the 1990s could both be based on the occurrence of normal climatic oscillations.
Whether or not the climate changes of the past 30 years are part of a long-term change, it is clear that they have been conducive to increasing clay shrinkage and subsidence. The majority of subsidence claims are the result of clay shrinkage, and the claims surges relate almost solely to clay shrinkage. The outcrops of shrinkable clays in the UK are predominantly in the south-east1 and it is the south-east which has experienced
an overall decrease in rainfall
increased winter rainfall relative to summer rainfall
increased temperatures that increase evaporation, which in a normal year exceeds rainfall
clusters of hot, dry summers.
Following the protracted drought of 1988–1992, which contained the driest 28-month sequence in England and Wales since the 1850s, was the then wettest 32-month sequence of the last century, culminating in 1994/95, the wettest winter on record at that time.4 As a result, groundwater levels were close to their seasonal maximum entering the spring of 1995. Nevertheless, the drought of 1995, which was on a par with 1976 in terms of the lowest rainfall totals in over 200 years,4 produced major water-supply problems as well as a very significant subsidence-claims surge. Following the 1995/1998 drought, the 37-month period from April 1998 to April 2001 generated a cumulative rainfall surplus of 657 mm at the Chelsea Physic Garden (see Fig. 1).
4. CLAIMS SURGES AND RAINFALL DEFICITS
While Fig. 1 shows a very clear relationship between rainfall deficits and the number of subsidence claims, there are obviously many other influencing factors. Not all subsidence claims are related to clay shrinkage. Subsidence is often only noted during surveys conducted as part of a house sale, and house sales tend to be more numerous when the economic climate is good. Conversely, two of the claims surge periods have coincided with economic recession in the UK.
The available supply of insured properties with foundations vulnerable to subsidence would be expected to be decreasing following 30 years of insurance cover and billions of pounds spent on remedial foundation works plus new build to NHBC standards. However, the overall trend seems to be one of increasing claims, driven in part at least by climate change, against a background of a reducing population at risk.
Considering in more detail the climatic conditions which led to claims surges, the following can be noted.
The drought of 1975/76 was brief and severe with a cumulative rainfall deficit in excess of 300 mm in eleven months. Claims surged by a factor of 20 (20 000 claims in 1976) relative to a base level of about 1000 claims per annum but dropped off rapidly with the advent of wetter conditions to a new base level of about 10 000 claims per annum for some six years.
During 1983/84 a cumulative rainfall deficit of only 175 mm over 14 months was sufficient to increase claims in 1984 to 25 000, a surge of 2·5 times relative to the new base level. The return to normal levels was less rapid than post-1976 and the new base level appears to have been about 15 000 claims per annum.
The first stage of the 1988/92 drought was a cumulative rainfall deficit of 275 mm in 15 months during 1988/89. Claims surged to 30 000 in 1989–an increase of a factor of 2 relative to the new base level. This continued into 1990 with a further 225 mm deficit in nine months. Claims surged to 55 000, a factor of 3·7 times the new base level. This was followed by a further 200 mm deficit over eight months in 1991/92, resulting in 60 000 claims in 1991, a surge of a factor of 4 times relative to the new base level. The return to normal levels took at least three years, with the new base level approximately 25 000 claims per annum.
1995 saw a cumulative rainfall deficit of 200 mm in eight months and 45 000 claims, a surge of 1·8 times the new base level. A further deficit of 175 mm in ten months in 1996 produced 48 000 claims, a surge of a factor of 1·9 and in 1997 a deficit of 125 mm in the first five months produced 53 000 claims, a surge of about 2·1 times the new base level. Despite the greater intensity of the 1995/97 drought (470 mm cumulative rainfall deficit in 26 months) compared to the 1988/92 drought (500 mm cumulative deficit in 43 months), the claims surge was not as great relative to the new higher base level. Again the return to normal levels was slow, being some 38 000 claims in 2000 with the new current base level possibly about 35 000 claims per annum.
5. CONCLUSIONS
Climatic conditions during the past three decades when insurance cover has been available for subsidence have been conducive to increased frequency and severity of clay shrinkage.
It appears that a claims surge can be produced by a cumulative rainfall deficit in excess of 150 mm occurring over a period of less than a year and which includes the spring and summer months.
A claims surge can occur even though the previous period has been wet enough to fully replenish soil moisture. As such it is not considered possible to predict a claims surge until it is actually occurring or, conversely, to positively state that one will not occur. Based on the historical data, there could be no guarantee at the end of the 2000/2001 winter, which saw a cumulative rainfall surplus of more than 400 mm in eight months, that 2001 would not be a surge year despite the saturated ground conditions at the time.
The period between claims surges has decreased over the past 30 years, as follows
six years post 1976
four years post 1984
three years post 1991.
We are now more than three years post 1997.
Based on the historical data, the next claims surge that occurs in response to a rainfall deficit seems likely to see annual claims increase by about 1·4 times over a base level of about 35 000. If the rainfall deficit persists for two or more years, the claims surge seems unlikely to increase annual claims by more than 1·7 times this base level in a single year.
It is too early to say whether the climatic change over the past 30 years, which appears to have contributed significantly to the increased incidence of clay shrinkage and foundation subsidence, is a permanent feature or just a periodically occurring extreme within the general fluctuations of the UK's variable climate.