

| NOTATION | |
|---|---|
| Af | pore pressure parameter related to deviatior stress at failure |
| AR | |
| B | outside diameter of sample tube |
| CAUC | anisotropically consolidated undrained triaxial test |
| Cc | compression index |
| Cs | swelling index |
| Cα | coefficient of secondary compression |
| cv | coefficient of consolidation |
| D | pore pressure parameter after Lunne et al. (1997) |
| Dc | internal diameter at cutting edge |
| De | external diameter at cutting edge |
| Di | internal diameter of sample tube |
| ELE | name of manufacturers of sample tube ELE Ltd. |
| E0·01 | secant stiffness at 0·01% strain |
| e0 | initial void ratio |
| GDS | manufacturer of triaxial stress path system (Geotechnical Data Systems) |
| ICR | inside clearance = (Di − Dc)/Dc |
| Mi | initial stiffness in oedometer test |
| preconsolidation pressure | |
| initial (or residual) effective stress | |
| su | undrained shear strength |
| t | sample tube thickness |
| wi | initial moisture content |
| in situ vertical effective stress | |
| σv0 | in situ total vertical stress |
| Δe0 | change in initial void ratio |
| ΔV | change in volume during consolidation |
| εv0 | strain to initial vertical effective stress |
| εf | strain at failure in triaxial test |
| ρi | initial density |
1. THE SITE AND SOILS
Sampling was undertaken at the site of the Athlone Bypass in Mid-Ireland. A detailed description of the design and construction of the road embankments and of the ground conditions can be found in Dauncey et al. (1987)32 and O'Riordan (1996).33 Two distinct normally to lightly over-consolidated late glacial lake clays underlie the site, namely
An upper very soft grey organic clay of medium to high plasticity and having a vane shear strength of about 15 kPa (called the grey clay in this discussion).
A lower very soft brown laminated clay of low plasticity and having a vane shear strength of about 5 kPa (called the brown clay in this discussion).
2. SAMPLING
Sampling was carried out from three shell and auger boreholes using a standard ELE type 100 mm dia. fixed piston sampler in two (one from undisturbed ground and one through the road embankments) and the same sampler modified by sharpening the cutting edge angle in the third. Drilling and sampling was carried out by the same driller on consecutive days from adjacent boreholes. Details of the samplers are given in Table 4.
3. ASSESSMENT OF SAMPLE DISTURBANCE
Assessment of sample disturbance was made by carrying out a series of oedometer and triaxial tests as follows and by comparing some of the laboratory derived parameters to those determined from field performance of the road embankments.
4. OEDOMETER TESTS
These were maintained load (24 hour) tests which broadly followed the procedures of Sandbækken et al. (1986).34 Specimens were prepared by extruding them from the sampling tubes directly into the oedometer rings and trimming using a piano wire. Test results are summarised in Table 5. Data for the grey clay confirms its high degree of natural material variability, a reflection of a variable organic content.
Summary of oedometer test results: (a) grey clay 30° tubes; (b) grey clay 5° tubes; (c) brown clay 30° tubes; and (d) brown clay 5° tubes
| Test | Depth (m) | (kPa) | wi (%) | ρi (Mg/m3) | (kPa) | Cc/1 + eo | εv02 (%) | Δe/e03 |
|---|---|---|---|---|---|---|---|---|
| (a) | ||||||||
| G1 | 3·9 | 39 | 89 | 1·507 | 636 | 0·213 | 6·1 | 0·111 |
| G2 | 4·8 | 37 | 63 | 1·63 | 500 | 0·236 | 7·8 | 0·160 |
| G3 | 5·6 | 46 | 57 | 1·597 | 861 | 0·174 | 6·7 | 0·110 |
| G5 | 3·9 | 39 | 78 | 1·51 | 875 | 0·208 | 4·3 | 0·067 |
| G6 | 4·8 | 37 | 53 | 1·72 | 700 | 0·145 | 5·9 | 0·116 |
| G8 | 5·5 | 46 | 57 | 1·589 | 3404 | 0·183 | 3·6 | 0·063 |
| G14 | 6·25 | 125 | 71 | 1·495 | 1435 | 0·226 | 6·9 | 0·085 |
| Average | 1200 | 0·198 | 5·9 | 0·102 | ||||
| (b) | ||||||||
| G10 | 3·1 | 41 | 77 | 1·559 | 407 | 0·124 | 10·7 | 0·166 |
| G11 | 5·8 | 54 | 33 | 1·987 | 1250 | 0·069 | 4·6 | 0·114 |
| G12 | 5·6 | 53 | 37 | 1·913 | 824 | 0·119 | 7·3 | 0·258 |
| G13 | 6·4 | 58 | 31 | 2·035 | 1400 | 0·104 | 6·4 | 0·134 |
| G15 | 5·5 | 50 | 37 | 1·906 | 1083 | 0·135 | 4 | 0·093 |
| G16 | 6·8 | 60 | 44 | 1·909 | 1000 | 0·143 | 6 | 0·130 |
| Average | 995 | 0·116 | 6·5 | 0·149 | ||||
| (c) | ||||||||
| B1 | 7·6 | 138 | 39 | 1·791 | 1794 | 0·087 | 8·4 | 0·156 |
| B2 | 8·8 | 136 | 23 | 2·217 | 4722 | 0·053 | 4·2 | 0·124 |
| B3 | 7·6 | 128 | 32 | 1·969 | 2388 | 0·115 | 4·7 | 0·103 |
| B4 | 9·4 | 70 | 32 | 1·926 | 2429 | 0·07 | 5·6 | 0·119 |
| B5 | 9·6 | 64 | 36 | 1·848 | 1333 | 0·104 | 5·2 | 0·101 |
| Average | 2530 | 0·086 | 5·6 | 0·121 | ||||
| (d) | ||||||||
| B6 | 8·3 | 68 | 26 | 1·995 | 3150 | 0·066 | 1·8 | 0·044 |
| B7 | 8·4 | 68 | 28 | 2·038 | 3520 | 0·054 | 1·6 | 0·038 |
| B8 | 10·3 | 80 | 26 | 2·06 | 3390 | 0·037 | 3·9 | 0·096 |
| B9 | 10·4 | 80 | 29 | 2·009 | 1733 | 0·038 | 5·4 | 0·117 |
| B10 | 10·5 | 80 | 26 | 2·069 | 3730 | 0·037 | 3·7 | 0·092 |
| Average | 3100 | 0·046 | 3·3 | 0·077 | ||||
Notes: (1) initial oedometric modulus; (2) strain to initial vertical effective stress; and (3) change in void ratio to initial void ratio to initial vertical effective stress
4.1. Oedometer tests—assessment of sample disturbance
Typical oedometer test results are shown in Figure 9. The very rounded nature of the e – log p plots is obvious, with the curve for the test on the 5° specimen of the brown clay being particularly poor.
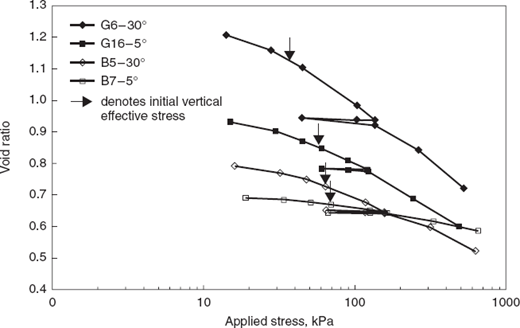
Comparison of typical 30 (degrees symbol) and 5 (degrees symbol) oedometer tests
Comparison of typical 30 (degrees symbol) and 5 (degrees symbol) oedometer tests
Sample quality has frequently been assessed by determining the strain (εv0) required to reconsolidate the sample back to its initial effective stress , see for example Andresen and Kolstad (1979).35 The data in Table 5 suggest that most of the samples in this study fall into the ‘poor’ category (εv0 = 4%–10%). Lacasse (1985)36 suggested that the above criteria were two strict and outlined a revised system based on depth and overconsolidation ratio. This method suggests that specimens are acceptable if εv0≤3·4%. Even if this revised assessment criteria was used no test would be deemed ‘acceptable’.
Lunne et al. (1997)37 proposed a criteria for quantifying sample disturbance in terms of the normalised change in void ratio (Δe/e0) to . They suggested that, as this parameter is a measure of the change in pore volume to the initial pore volume, while εv0 is equal to the change in pore volume divided by the initial total volume, it is a more reasonable parameter to use. Again the tests would be quantified as ‘poor’ (Δe/e0 = 0·07–0·14). A number of the tests on the 5° brown clay specimens would be classified as ‘fair’ using the criterion (Δe/e0 = 0·04–0·07). However the shape of the e – log p curves would suggest that in fact the specimens were of poor quality.
4.2. Oedometer tests—comparison with in situ determined parameters
Field behaviour of the embankments has been analysed and reported by Long and O'Riordan (2000)38 who report values of various parameters derived from field loading of the soils.
Only a relatively small amount of data are available on the in situ preconsolidation stress, . However the field values are higher than those determined in the laboratory tests for both types of sampler.
Field and laboratory Mi and Cc/1 + e0 values are summarised in Table 6 and 7 respectively. Scatter in the data prevent any conclusions being made on the swelling coefficient Cα or the coefficient of consolidation, cv.
Recompression (constrained modulus) Mi
| Clay | Typical field (kPa) | Lab. average 30° (kPa) | Lab. average 5° (kPa) |
|---|---|---|---|
| Grey organic clay | 2000 | 1200 | 995 |
| Brown laminated clay | 7500 | 2530 | 3100 |
Compression coefficient Cc/1 +e0
| Clay | Range from field | Lab. average 30° | Lab. average 5° |
|---|---|---|---|
| Grey organic clay | 0·19–0·53 | 0·198 | 0·116 |
| Brown laminated clay | 0·10–0·18 | 0·086 | 0·046 |
In both cases the laboratory derived parameters considerably underestimate the in situ stiffness. This finding is consistent with that reported by others, see for example Kabbaj et al. (1988).39 There is little difference in the performance of the two samplers.
4.3. Oedometer tests—conclusions
In general there is little difference between the results from the two samplers. In both cases relatively poor specimens were obtained. Contrary to the analytical predictions of the authors, inspection of the general shape of the e – log p curves and the relationship between laboratory and in situ parameters suggests that the 30° specimens give slightly better results than the 5° ones.
5. TRIAXIAL TESTS
Testing comprised standard anisotropically consolidated undrained triaxial tests (CAUC), which were carried out on 101·4 mm dia. specimens in a GDS system. Samples were extruded from the piston tubes, trimmed top and bottom using a piano wire and then placed in the cell. K0 was assumed to equal 0·6. Shearing was carried out at a rate of 4·5% per day. Test results are summarised in Table 8.
Summary of CAUC triaxial tests:(a) grey clay 30° tubes; (b) grey clay 5° tubes; (c) brown clay 30° tubes; and (d) brown clay 5° tubes
| Test | Depth (m) | (kPa) | wi (%) | ρi (Mg/m3) | * | ΔV† (%) | Δe/e0‡ | εf (%) | E0·01§ (kPa) | D†† | |
|---|---|---|---|---|---|---|---|---|---|---|---|
| (a) | |||||||||||
| g501 | 3·6 | 35 | 60 | 1·589 | 0 | 5·5 | 0·090 | 0·47 | 5·4 | 45,000 | 0·51 |
| g503 | 4·3 | 27 | 57 | 1·653 | 3 | 8·2 | 0·140 | 0·43 | 2·8 | 45,000 | 0·64 |
| g508 | 5·6 | 35 | 50 | 1·754 | 3 | 4·5 | 0·083 | 0·35 | 1·1 | 15,000 | 0·05 |
| g1 | 4·55 | 30 | 64 | 1·644 | 3 | 9·4 | 0·155 | 0·37 | 1·2 | 131,000 | 0·69 |
| g2 | 6·25 | 125 | 60 | 1·559 | 14 | 3·2 | 0·052 | 0·52 | 8·6 | 50,000 | 0·22 |
| g3 | 5·95 | 124 | 43 | 1·787 | 17 | 2·2 | 0·043 | 0·38 | 6·1 | 39,000 | 0·22 |
| g6 | 5·3 | 42 | 73 | 1·564 | 0 | 4·8 | 0·075 | 0·50 | 4·5 | 110,000 | 0·27 |
| g11 | 3·2 | 34 | 51 | 1·707 | 2 | 5·5 | 0·099 | 0·49 | 8·8 | 35,000 | 0·39 |
| g541 | 5·2 | 38 | 95 | 1·454 | n/a | 5·4 | 0·076 | 0·70 | 11 | 20,000 | 0·2 |
| Average | 6·2 | 0·090 | 0·46 | 5·6 | 54,500 | 0·06 | |||||
| (b) | |||||||||||
| g502 | 5·7 | 50 | 34 | 1·868 | 3 | 7·3 | 0·162 | 0·32 | 2·9 | 45,500 | 0·10 |
| g504 | 6·5 | 57 | 36 | 1·828 | 5 | 4·5 | 0·096 | 0·35 | 1·9 | 28,000 | 0·33 |
| g507 | 6·9 | 60 | 38 | 1·796 | 1 | 5·4 | 0·111 | 0·33 | 1·4 | ? | 0·08 |
| g5 | 7 | 60 | 39 | 1·877 | 0 | 8 | 0·169 | 0·46 | 0·6 | 250,000 | 0·05 |
| g4 | 5·3 | 49 | 41 | 1·800 | 3 | 2·8 | 0·056 | 0·43 | 3·8 | 130,000 | 0·03 |
| Average | 5·6 | 0·119 | 0·38 | 2·1 | 114,000 | 0·07 | |||||
| (c) | |||||||||||
| b1 | 7·55 | 137 | 27 | 1·981 | n/a | 2·7 | 0·064 | 0·4 | 7·0 | 38,500 | 0·23 |
| b2 | 8·85 | 150 | 30 | 1·980 | n/a | 5·7 | 0·131 | 0·4 | 5·7 | 71,500 | 0·03 |
| b3 | 8·3 | 60 | 34 | 1·946 | 0 | 7 | 0·152 | 0·39 | 5·3 | 190,000 | 0·3 |
| b20 | 9·5 | 64 | 25 | 2·068 | 3 | 5·2 | 0·135 | 0·36 | 5·4 | 140,000 | 0·07 |
| b21 | 9·5 | 64 | 27 | 2·099 | 0 | 5·8 | 0·150 | 0·44 | 6·5 | 220,000 | 0·06 |
| b25 | 7·2 | 99 | 29 | 2·008 | 6 | 2·7 | 0·064 | 0·53 | 5·8 | 300,000 | 0·26 |
| Average | 4·9 | 0·116 | 0·42 | 6·0 | 89,500 | 0·14 | |||||
| (d) | |||||||||||
| b22 | 10·2 | 80 | 32 | 2·044 | 1 | 5·6 | 0·132 | 0·52 | 8·3 | 430,000 | 0·0 |
| b23 | 10 | 80 | 31 | 2·180 | 0 | 3·7 | 0·097 | 0·39 | 5·8 | 390,000 | 0·01 |
| b24 | 8·65 | 68 | 25 | 2·072 | 3 | 2·7 | 0·070 | 0·58 | 6·3 | 128,000 | 0·37 |
| Average | 4·0 | 0·100 | 0·50 | 6·8 | 316,000 | 0·13 | |||||
Notes:
initial (or residual) effective stress in specimens in triaxial cell;
volume change required to re-consolidate to in situ stress;
change in void ratio to initial void ratio required to re-consolidate to in situ stress;
Young's modulus at 0·01% axial strain; and
pore pressure parameter [Δu = Δσ1 − D(Δσ1 − Δσ3)] used by Lunneet et al. (1997) to assess sample disturbance effects. Value at stress of 2/3 peak stress should be close to 0·0 for a perfect sample.
5.1. Triaxial tests—assessment of sample disturbance
Typical triaxial stress/strain curves and stress path curves are shown on Figures 10 and 11 respectively. It can be seen that the tests on the two grey clay samples and two brown clay samples are very similar in both cases. The brown clay 5° curve shows some clear signs of sample disturbance. Typical normally consolidated type behaviour is exhibited by the grey clay. With the brown clay, following initial normally consolidated type behaviour, there is some tendency for dilation which is similar but not as severe as measured for clayey sands by Georgiannou et al. (1990).40
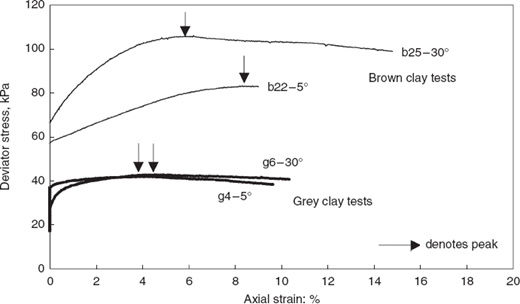
Stress strain curves—typical CAUC triaxial tests—30 (degrees symbol) and 5 (degrees symbol) specimens
Stress strain curves—typical CAUC triaxial tests—30 (degrees symbol) and 5 (degrees symbol) specimens
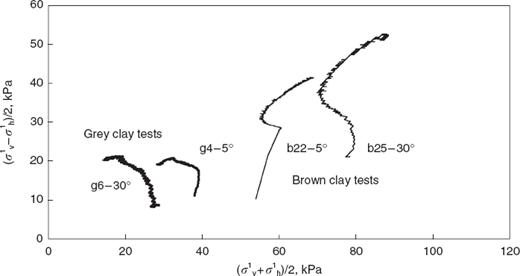
Stress paths—typical CAUC tests on 5 (degrees symbol) and 30 (degrees symbol) specimens
Stress paths—typical CAUC tests on 5 (degrees symbol) and 30 (degrees symbol) specimens
Examination of the data for volume change (ΔV) during re-consolidation to in situ stress, using the assessment criteria of Andresen and Kolstad (1979),35 suggests that most of the samples in this study fall into the ‘poor’ category (ΔV = 4%–10%). Similarly if the Lunne et al. (1997)37 criteria are used only a few of the tests, particularly the grey 30° ones would be classified as ‘fair’ (Δe/e0 = 0·04–0·07). Most would fall in the ‘poor’ (Δe/e0 = 0·07–0·14) category. On average the grey clay 30° specimens are stronger. However the 5° specimens are stiffer and have a lower strain to failure. The 5° brown clay specimens are stronger and stiffer but have a higher strain to failure than the 30°.
Other parameters, which may give an indication of sample disturbance, such as the initial (or residual) effective stress, and the pore pressure parameter D show little difference between the two sets of specimens.
5.2. Triaxial tests—comparison with in situ behaviour
Details of a trial embankment which was loaded to failure on the site are reported by Dauncey et al. (1987).32 Using a conventional limit state stability analysis they show that the operational strengths of the grey and brown clays are approximately and respectively. Mesri (1988)41 suggests that typically the ratio between CAUC undrained shear strength and operational shear strength is 1·4. Therefore the laboratory derived strength for the grey clay should be approximately:
which is consistent with the average values of and actually determined in the laboratory for the 30° and 5° specimens respectively.
For the brown clay the laboratory derived strength should be:
which is much lower than the actual laboratory derived values, particularly for the 5° specimens. This may suggest that the dilatant behaviour exhibited by the brown clay is due partly at least to sample disturbance effects.
5.3. Triaxial tests—conclusions
In this case the samples are shown to be reasonable in quality. Again there is little difference between the specimens from the two types of piston tube. There may be some evidence to suggest that the specimens from the 30° are superior.
6. COMPARISON WITH BLOCK SAMPLE SPECIMENS
Long (2000, 2001)42,43 also compared the data given here with that on high quality Sherbrooke block sample specimens (Lefebvre and Poulin, 1979)44 of both clays. For both clays, tube sampling effects appeared to
reduce the measured natural moisture content and the initial void ratio but increase the bulk density
reduce large strain stiffness values for both clays (Cc/1 + e0 and Cα), a finding consistent with that of other researchers
increase small strain stiffness (Mi, and E0·01), a finding consistent with that made by others for a wide range of clays.
For the grey organic clay, tube sampling effects
reduce the normalised undrained strength
cause an shrinkage of the large scale yield surface
reduce strain to failure.
However for the brown clay the same effects
increase the undrained strength
expand the large scale yield surface
induce a strong tendency for dilatant behaviour post peak
increase the strain to failure
reduce the pore pressure parameter, Af.
The unusual effects observed were attributed to a tube sampling insertion process which was partially drained, particularly in the slit lenses of the laminated clay. These loose slit lenses contracted during sampling, resulting in a densification of the material. Similar effects, albeit to a lesser extent, occurred for the grey clay.
7. CONCLUSIONS
The following conclusions can be drawn for the comparative study presented here.
There is little difference between the sample quality produced by the standard (30° cutting edge angle) and modified (5° cutting edge angle).
This is contrary to the analytical findings of the authors and to some similar laboratory based comparative work on Bothkennar clay reported by Hight (2000).45 It is likely that any difference in the effects of the strains induced in the materials by the two tube samplers were masked by the densification process described above. For the Athlone clays the tube sampling insertion was a drained/undrained process. In the authors analytical study it was assumed to be purely undrained.
It would be interesting to have the views of the authors on this.
Authors' reply
Long presents some interesting data that appear to show that there is no value in using a better-configured cutting edge when sampling soft soils. The authors are extremely reluctant to accept such a proposition, since it flies in the face of careful research carried out by many people over the past 60 years or so.
In our paper we note that sample disturbance can take place at several different stages during the life of a laboratory test specimen, i.e. during
drilling
sampling
storage
extrusion
the early stages of testing.
Our paper considers only the effects of tube sampling.
If the soil disturbance during tube sampling (whether using a standard cutting shoe or a refined one) is significantly less than the disturbance at one or more of these other stages, then one should not expect to be able to detect the effects of different types of tube sampling.
Michael Long shows that by many of the empirical criteria established by previous workers in this field his samples are seriously disturbed. Where then can such high levels of disturbance have been applied to the samples in question? The Discussion suggests a number of possibilities. In the case of samples taken from light percussion (‘shell and auger’) borings.
This form of drilling is widely acknowledged as potentially leading to high levels of disturbance.
Firstly, in soft ground it is relatively easy for the driller to allow the casing to run ahead of the bottom of the hole, resulting in severe disturbance to the section about to be sampled. Only continuous and careful supervision is likely to detect this and prevent it from happening.
Secondly, it is essential to use a borehole fluid in very soft deposits (the authors would advocate a drilling fluid rather than water in most cases) to maintain as much total stress as possible at the base of the borehole, and thus ensure that borehole base failure (with associated severe disturbance) does not occur.
Thirdly, in soft materials it is normally necessary to progress the hole using the ‘shell’ (sometimes termed a ‘bailer’). The jerking action used with this tool is almost guaranteed to cause severe disturbance to the soil, as it sucks it upwards. These last two effects will destructure soil some three diameters ahead of the casing, which in the case of 150–200 mm diameter hole would equate to approximately one-half to two-thirds of the sample length.
No details are given of the method used to insert the sampler into the ground, or to retrieve it. Pushing a plugged tube such as a piston sampler below the base of the hole will cause large amounts of disturbance. In addition, as we note in our paper, a smooth continuous action is required when the tube is being advanced ahead of the piston.
The discussion also makes general comparisons with results obtained from Sherbrooke samples, although no data are given to allow the reader to confirm the statements made. Without these data we are unable to comment in detail, but would simply observe that is remains possible that significant disturbance could have affected even these samples and test specimens.
The two strata concerned are described as ‘very soft grey organic clay’ and ‘very soft brown laminated clay’. The various stages of drilling, sampling and specimen preparation are likely to have led at one or more stages to a complete loss of total stress. The low air entry pressure of coarse-grained materials (such as organic inclusions and sand/silt laminations) will have allowed the water content of these materials to be sucked into the surrounding clays (which will have negative pore pressures, but higher air entry pressures) after relief of total stresses. The increase in moisture content in the clay component of the soil has obvious implications for its initial effective stress, its strength and compressibility, but in addition it is possible that natural, weakly bonded soils can be destructured by swelling them. It is noted that Table 1 shows that virtually all the specimens had negligible effective stresses before reconsolidation. Whilst anisotropic reconsolidation in the triaxial apparatus will go some way to correcting this effect, it will not completely repair the damage. And, because there is no reconsolidation to the in-situ effective stress, one could expect the oedometer specimens to be more significantly affected.
In any case, it must be expected that there would be considerable disturbance to any granular varves or laminations in the specimens, since these would have undergone not only complete effective stress relief, but also a loss of ‘memory’ due to grain contact movements.
The discussion does not relate how the samples were sealed and transported, but clearly such soft specimens could be destructured by rough handling, perhaps whilst being transported to the laboratory, and could be further damaged during extrusion and handling.
The method of saturating and reconsolidating a specimen will also have a significant effect on its behaviour in later stages of the test. The discussion makes no mention of any saturation technique. We infer that the specimens were Ko reconsolidated against a zero back pressure, before being sheared monotonically in compression. It seems doubtful if pore pressure measurements would be meaningful under such conditions.
Finally, there is no record of the use of local strain measurement in the triaxial testing. Bedding effects (for example between the porous stones and the specimen ends would undoubtedly contribute significantly to the strains measured in the oedometer, but these effects could be avoided in the triaxial by measuring strains locally.
In conclusion, we believe that it is unreasonable to infer from the data and information presented in the discussion that the geometry of the cutting shoe is unimportant. The results suggest only that on this site disturbance due to tube sampling was less than that from other causes. As we have shown, the evidence from the discussion suggests many ways in which the soil might have been significantly disturbed both before and after sampling, and there is also the possibility that erroneous measurements may have resulted from the laboratory testing instrumentation and techniques.

