
The response of granular materials is significantly affected by the stiffness of the particles that constitute them. This stiffness can evolve and the particles can exhibit strong inter-granular strain. While generally overlooked in literature, these features emerge in numerous materials that can soften and swell. This is the case for clays, root systems, and polymer-based particles. This study investigates the macroscopic effects of concurrent particle swelling and softening, based on previous experimental results on hygroscopic granular assemblies. The material studied therein shows a dilation–compaction response in oedometric conditions, despite the constant load, driven by the evolving properties of the particles. To model this complex response, an intentionally simple discrete element approach is proposed, with variables depending on one main parameter. A sensitivity analysis – built on the proposed material model and implemented within the discrete element method approach – successfully reproduces the experimental observations and notably the dilation–compaction response. An analytical one-dimensional model is then developed to further explore the role of variables in such assemblies. The study highlights that a simple model can capture the experimentally observed meso-scale mechanisms, underlining how complex responses can emerge from elementary inter-particle interactions.
Notation
applied vertical force
height of an assembly of particles
height of an assembly of particles when
stiffness of the 1D system
stiffness of the 1D system when
particle stiffness, dependent on
particle stiffness when
vertical stress
critical or reference vertical stress
particle radius, dependent on
time
particles overlap
main variable
particle radius when
particle overlap when
maximum asymptotic value of
coefficient modulating the 1D system stiffness decrease
coefficient modulating the particle stiffness decrease
coefficient describing the relationship between and
ratio between and
ratio between and
height variation of an assembly of particles
height variation of the 1D system
friction coefficient
particle density
coefficient modulating the increase of with time
INTRODUCTION
When modelling the mechanical behaviour of granular materials, it is typically assumed that the individual particles are rigid and their properties immutable. Inter-particle interactions generally receive much attention, as they play a crucial role in driving the macroscopic response of granular materials. This is particularly true for thoroughly studied granular materials such as sand and gravel. Nevertheless, a variety of other granular materials comprise ‘active’ constituents such as clay, roots, super-absorbent polymers, and biological or organic matter (Aguilera et al., 1995; Romero et al., 2011; Sweijen et al., 2017; Saha et al., 2020; Kolb et al., 2022). The properties of the particles composing these materials vary with time, for example, in the presence of a triggering agent, such as water, which can alter their stiffness and their volume. This diverse group of materials is relevant for domains well beyond the geotechnical field, finding applications in diverse domains such as chemical, food, and pharmaceutical industries (Aguilera et al., 1995; Zafar et al., 2017).
The impact of phenomena such as particle swelling or softening on the response of the material can be significant (Glenn et al., 1991; Aguilera et al., 1995; El Youssoufi et al., 2005; Garcia-Rojo et al., 2005; Radjai et al., 2017; Sweijen et al., 2017; Zafar et al., 2017; Aguirre et al., 2021; Braile et al., 2022; Vego, 2023). However, the simultaneous occurrence of these two phenomena is generally overlooked (Sweijen et al., 2017; Braile et al., 2022). The study presented here is inspired by a recent experimental work performed on a highly hydro-sensitive granular material (Vego et al., 2022, 2023a; 2023b), employed as a reference for assemblies that can exhibit both swelling and softening at the particle scale. Specifically, several samples of couscous were exposed to high relative humidity levels while being subjected to constant vertical stress in oedometric conditions. Information about the evolving microstructure and the water distribution was concurrently gathered by way of X-ray (Vego et al., 2022), neutron + X-ray tomography (Vego et al., 2023b), and time-domain nuclear magnetic resonance (Vego et al., 2023a). In these works, the samples exhibit dilation and compaction, despite the constant vertical stress, as shown in Fig. 1(a). This is ascribed to the concurrent occurrence of swelling and softening at the particle scale. While some single-grain stiffness tests confirm this loss of rigidity of the particles (see Appendix), a link is missing to justify this response. This work aims to fill this gap through numerical simulations investigating the interplay between these concurrent and competing processes.
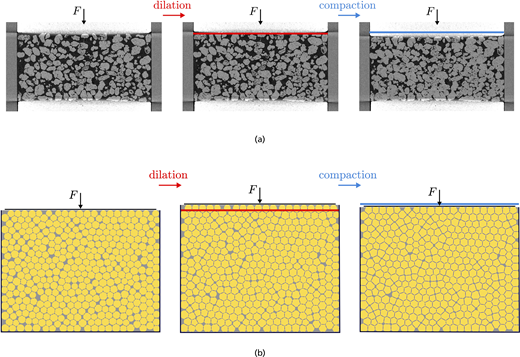
(a) Tomography images of an assembly of couscous exposed to high relative humidity in a 16 mm diameter oedometer (Vego et al., 2022) and (b) illustration of a 2D DEM simulation. A dilatant–compactant response for assemblies of swelling and softening particles subjected to a constant vertical force is observed in both the experiment and the simulation. Initially, the swelling induces a dilation of the system. Eventually, when the softening of the particles becomes dominant, the assembly is compacted by the applied vertical force
(a) Tomography images of an assembly of couscous exposed to high relative humidity in a 16 mm diameter oedometer (Vego et al., 2022) and (b) illustration of a 2D DEM simulation. A dilatant–compactant response for assemblies of swelling and softening particles subjected to a constant vertical force is observed in both the experiment and the simulation. Initially, the swelling induces a dilation of the system. Eventually, when the softening of the particles becomes dominant, the assembly is compacted by the applied vertical force
The modelling approach presented in this paper is intentionally simple, in so much as the response is described through few variables, all described by relatively simple equations. Beginning with elementary assumptions at the particle scale, the final goal is to mimic meso-scale mechanisms observed experimentally and notably the dilation–compaction response (Vego et al., 2022; Vego, 2023; Vego et al., 2023b).
Elementary and computationally efficient two-dimensional (2D) simulations are performed using the discrete element method (DEM). Furthermore, these meso-scale key features emerge even from the simpler model comprising only two particles (1D system).
A SIMPLE DISCRETE APPROACH
Concurrent swelling and softening
Both the swelling and softening phenomena are described as depending from a single governing variable, here denoted as . This variable – that could be, for example, the water content – is considered independent and always positive. In real-case scenarios, may evolve with time, temperature, or other external factors. This dependency may also be influenced by inherent material properties. For sake of generality, these further possible dependencies are neglected.
A useful and very common simplification is the approximation of the particle shape as spheres, which is also adopted in this study. Taking the particle radius as a metric of the particle size, the swelling dependence on can be expressed as:
where indicates the radius of the particle, is the initial radius (when ), and defines the inherent relationship between swelling/shrinking and the governing variable , for example, water content. This linear relationship between the particle volume and is supported by experimental results on hygroscopic particles such as couscous (Vego, 2023; Vego et al., 2023a).
To describe then the softening of particles with respect to , an exponential decay of the particle stiffness is imposed based on experimental observations, here reported in the Appendix, and on previous studies (Glenn et al., 1991; Kamst et al., 2002; Cao et al., 2004):
where is the stiffness at , and the ratio indicates the ultimate softening ratio, while the coefficient modulates the softening rate with , which is an inherent property of the material of interest. The exponential decrease equation is also chosen for its stability. This way, the stiffness of the particle cannot indefinitely decrease, but rather reach – close to the asymptotic value – when . It could be argued that the stiffness of the particle could increase instead of decreasing; however, this is an unlikely scenario while a volumetric dilation occurs and would contradict most experimental data in the literature.
Two-dimensional DEM simulations
The DEM (Cundall & Strack, 1979) is selected as a numerical technique to assess whether the material model is able to replicate the mechanisms of a particle assembly as observed experimentally. The simulation configuration is as follows.
- ▪
A total of 407 spheres of diameter between 625 and 800 µm are restricted in a plane by three rigid walls, under the action of gravity and a constant vertical force applied on the upper wall (see Fig. 1(b)).
- ▪
The axial symmetry of oedometric conditions allows for the 2D simplification, where the centres of particles are only allowed to move in a given plane. Despite the 2D restriction for kinematics, the model maintains the 3D nature of the particles for mass/volume and interactions.
- ▪
Inter-particle forces are modelled with the Hertz–Mindlin non-linear elastic model, given its widespread adoption and generality, which challenges the assumption of small overlap.
- ▪
The contact stiffness is defined as the harmonic mean of that of the two particles.
- ▪
The tangential forces are limited through the Coulomb friction criterion.
The next step involves activating the swelling and softening of the particles. This is done imposing a relationship between and the time-steps of the numerical simulation. The meaning of time differs between these numerical DEM simulations and the actual experimental work. Nonetheless, a relatively small time-step is adopted in sequential computations, preserving the quasi-static nature of the problem. The chosen form for the growth is an exponential increase, a form supported by different studies investigating hygroscopic materials (Omidian et al., 1998; El Youssoufi et al., 2005; De Richter et al., 2022; Vego et al., 2023a, 2023b):
where indicates the time-step, is the asymptotic value, and is its growth rate; is calibrated to reach a value of by the end of the simulation.
Before running the simulations, it is necessary to define the particle density (= 1·3 g/cm3, in order to match experimental data of couscous) and the friction coefficient ( = 0·8, arbitrarily imposed). The coefficient in Equation 1 is set equal to 1, under the assumption that the density of the particles remains constant, and represents the water content (Vego, 2023). The stiffness is calibrated as discussed in the Appendix. The parameters selected to perform the sensitivity analysis are summarised in Table 1.
Input parameters for the 2D DEM numerical simulations
| Simulation parameter | Value |
|---|---|
| 0·5 | |
| Initial radius | 0·31–0·4 mm |
| Particle density | 1·3 g/cm3 |
| 1 | |
| Friction coefficient | 0·8 |
| Initial particle stiffness | 4·29 N/m2 |
| Softening ratio | 0·01 |
| Oedometer width | 16 mm |
A sensitivity analysis is performed to understand the role of the applied vertical force, using an in-house C++ DEM code. Ten different simulations are run with force values ranging from 0·01 to 5 N. Simulations with exactly = 0 N are not executed because of the lack of stable solutions, although the 0·01 N can be virtually considered as the free-swelling case.
Figure 2 presents the evolution of the relative height of the samples, denoted as , where is the initial height of the assembly and is the difference between the current height at a given simulation step and . Specifically, Fig. 2(a) shows that the response of the assembly with respect to time follows the imposed increase of in Equation 3 at relatively low loads, while the effects of particle softening become progressively more dominant as the load increases. When studying the evolution of with the independent variable , one can note again the emergence of a dilation–compaction behaviour and that, for relatively small loads, the response of the assembly can be roughly approximated as linear, given the linear relationship between the particle volume and (Equation 1), as highlighted by the dashed line in Fig. 2(b).
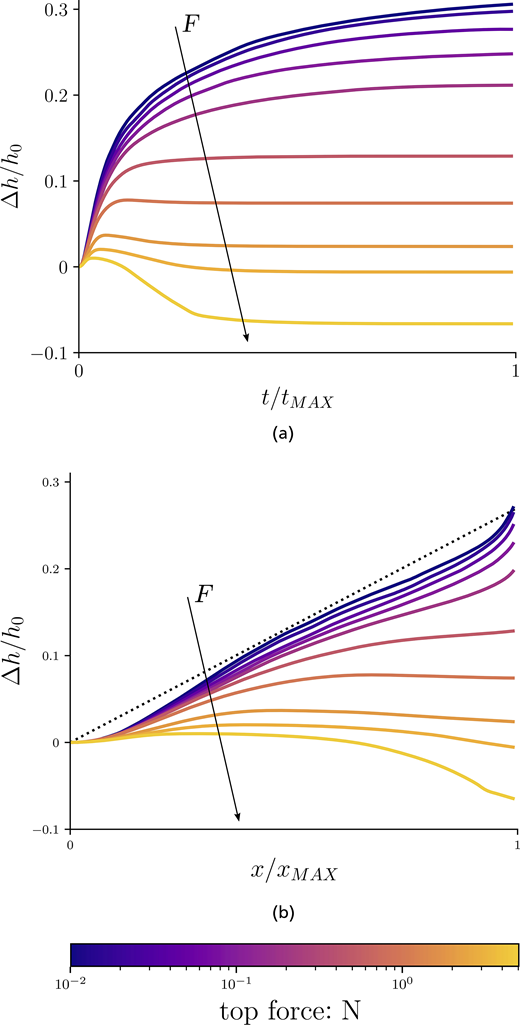
Vertical load sensitivity analysis: (a) evolution of the sample relative height variation () as a function of the time-step and (b) the main variable . Given the generality of the model, both the time-step and the values have been normalised. For relatively small vertical loads, the assembly dilates coherently with the swelling of particles. The softening effect becomes significant when for higher values of , the vertical force applied on the upper wall: the concurrent swelling and softening at the particle scale induces a dilatant–compactant response of the assembly
Vertical load sensitivity analysis: (a) evolution of the sample relative height variation () as a function of the time-step and (b) the main variable . Given the generality of the model, both the time-step and the values have been normalised. For relatively small vertical loads, the assembly dilates coherently with the swelling of particles. The softening effect becomes significant when for higher values of , the vertical force applied on the upper wall: the concurrent swelling and softening at the particle scale induces a dilatant–compactant response of the assembly
Despite the simplicity of the model, the simulations – under specific conditions – are capable of reflecting the dilation–compaction behaviour of the assembly observed experimentally (Vego et al., 2022, 2023a, 2023b) as a result of the competition between swelling and softening at the particle scale.
A 1D system to explore the role of variables
Hereafter, a further reduction step is performed to explore the response of swelling and softening of the particles. Starting from the main assumptions made for the 2D model, a simplified 1D analysis is performed.
This new configuration is conceptualised as two identical particles packed vertically in an oedometric cell with diameter equal to . A vertical constant force is applied to the packing: , where represents the vertical stress. To counterbalance the applied force , the single contact force is equilibrated when , with indicating the overlap between the two particles. Therefore, can be expressed as:
The relative variation in height of the system is denoted as , where is the direction linking the centres of the two particles. As increases, so does the particles size, and the expression for is then given by:
where the derivation of this expression can be deduced from the sketch in Fig. 3. It should be noted that a positive value of indicates a dilation of the system and vice versa. Moreover, the picture does not take into consideration any micro-structural features, as the emphasis lies solely on the inter-particle contact in one and only one direction.
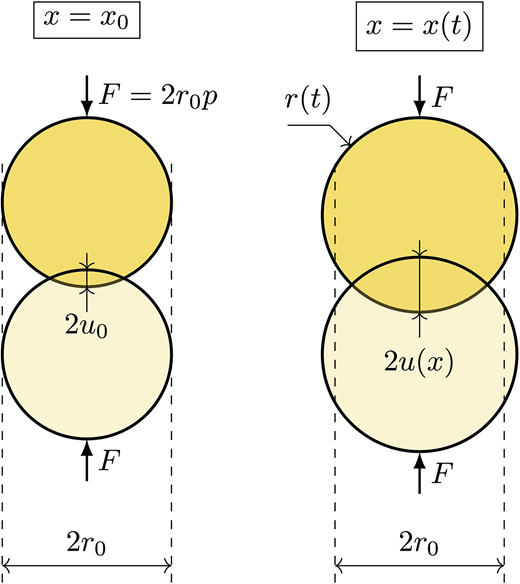
Illustration depicting the parameters employed in the two-particles system. The direction n is vertical. The centre-to-centre distance is 2[r(x) − u(x)]
Illustration depicting the parameters employed in the two-particles system. The direction n is vertical. The centre-to-centre distance is 2[r(x) − u(x)]
Substituting the terms from Equations 1 and 2 – assuming that the stiffness of the 1D system decreases similarly to the one of individual particles – two distinct components are identified in the expression for :
The first term reflects the contribution from the swelling of the particles, while the second term their softening. Notably, the initial radius does not appear in the final equation, indicating the independence from particle size.
Equation 6 allows for quantifying the role played by these competing mechanisms. To understand the load discerning between a dilatant and a compactant response, one can compute the first derivative of the height variation with respect to the main variable :
At , one obtains:
The sign of is determined by the right-hand side of the expression above. Furthermore, if the condition holds – a likely condition in most real-case scenarios – the stress value at which the system neither grows nor decreases in size, that is, , can be defined as the reference vertical stress :
This provides an indication of the vertical stress above which initial dilation of the system does not occur and vice versa.
CONCLUSIONS AND PERSPECTIVES
This contribution studies the macroscopic response and microscopic origins of the concurrent swelling and softening of particles, a common process in natural and artificial materials, which is often overlooked in the literature. A simple model that takes into account the simultaneous occurrence of these phenomena is developed based on micro- and macro-scale experimental observations. This model is intentionally simple and all variables depend on a main parameter, . Numerical simulations using the DEM are performed to verify whether the model is able to capture key features observed experimentally. The approach can be considered successful, as it can capture the dilatant–compactant response. The sensitivity study reveals a range of loads for which this can occur in 2D oedometric conditions. An analytical 1D model based on two particles is then developed to further explore the role that certain variables play in the response of assemblies of swelling and softening particles. This further simplification of the problem captures complex processes observed in experiments and provides, in a first approximation, an insight into the parameters governing the response.
To summarise, the simplicity of the modelling approach adopted in this study is an intentional choice made to demonstrate that certain mesoscopic scale mechanisms emerge from the basic processes occurring at the particle scale. The model can serve as an intuitive and effective pedagogical tool, showing that complex responses can be initiated by elementary particle-to-particle interactions.
Several key improvements of the model, directly associated with swelling and softening particles, could include: (a) an appropriate inter-particle contact law, which also accounts for cohesion, as it plays an important role in granular assemblies (Delenne et al., 2009; Sonzogni et al., 2024), (b) explicitly incorporating particle deformability, possibly based on the recent advances in the modelling of the interaction among deformable particles (Cárdenas-Barrantes et al., 2021, 2022), rather than allowing a large interpenetration, (c) taking into account inevitable heterogeneity in the activation of swelling and softening (Brockbank et al., 2021; Vego et al., 2022; Vego, 2023; Vego et al., 2023a), and (d) analysing different forms of input functions for radius and stiffness.
CONFLICTS OF INTEREST
There are no conflicts to declare.
ACKNOWLEDGEMENTS
This project has received funding from the European Union’s Horizon 2020 research and innovation program under the Marie Skłodowska-Curie Grant agreement No. 812638 (CALIPER). The authors acknowledge LabEx Tec 21-France (Investissements d’Avenir #ANR-11-LABX-0030).
Appendix
Stiffness of Individual Couscous Particles VS. Water Content
Building upon the previously mentioned work (Vego et al., 2022, 2023a, 2023b), an experimental campaign is conducted to evaluate the dependency of the stiffness of individual couscous particles to their water content (). Specifically, compression tests of individual couscous particles are performed at different levels of water content. This appendix summarises the experimental procedure in the next section, while the last section presents relevant results for the sensitivity study presented in the main text, particularly for the calibration of the particle stiffness and its softening rate .
Experimental procedure
Couscous particles, whose diameter is between 625 and 800 µm, are placed in a sealed vessel and exposed to a continuous flow of air of constant relative humidity to stabilise their water content (Vego et al., 2023a). This process is repeated for increasing humidity levels until a constant w is recorded. Then, only relatively convex particles are selected and placed in a custom-built apparatus, where they are compressed by moving a piston at constant and slow velocity ( = 1 µm/s). This piston, whose displacement is controlled by an ultra-high precision linear actuator with ceramic linear motor, is securely connected to a load cell.
The experimental campaign includes simple and cyclic compression tests. The simple tests are performed as described above, while the cyclic ones require additional steps in the compression stage. In this latter case, the piston is halted once the load cell records a force increase. The system is then left to relax for 3 min, after which the particle is ‘unloaded’ back to the position corresponding to the first halt (displacement of 0 µm). Next, the particle is compressed again by imposing a displacement equal to +10 µm relative to the maximum displacement of the previous cycle. In total, seven cycles are performed.
Results
The simple compression tests are performed at five different water contents: 4·05, 7·89, 9·80, 11·55, and 18·1%. For each , at least nine successful tests are conducted in order to average them.
Figure 4 reports, for each , the evolution of force–displacement curves within a 25 µm displacement range, 3·5% of the average particle diameter. Drier particles exhibit higher stiffness. In addition, the variance is larger for low w due to more brittle response. The collected data suggest that the force and displacement are linearly related within the selected range.
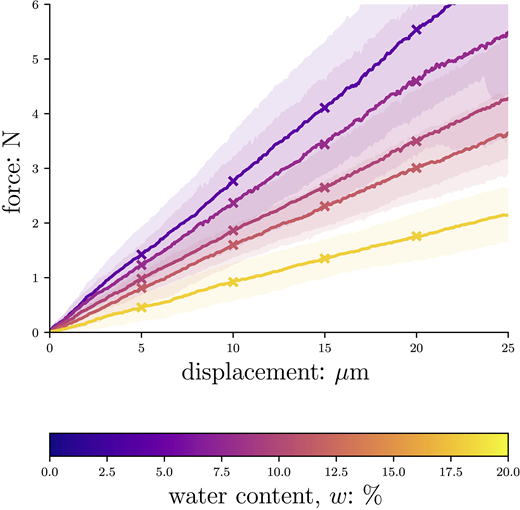
Force–displacement curves from the simple compression tests of individual couscous particles at different water content levels (from 4·05% to 18·1%). Drier particles exhibit a higher stiffness than wet ones. The force–displacement response can be described as a linear relation
Force–displacement curves from the simple compression tests of individual couscous particles at different water content levels (from 4·05% to 18·1%). Drier particles exhibit a higher stiffness than wet ones. The force–displacement response can be described as a linear relation
The force–displacement curves then allow for measuring the apparent stiffness of the particles, defined as the ratio between the average force and the respective displacement.
It should be noted that the apparent stiffness determined from these compression tests cannot be directly used as a value for in the sensitivity study. Therefore, an indication of the stiffness value and its evolution is obtained by deliberately dividing the apparent stiffness by the average particle diameter (Zhang et al., 2016). As highlighted in Fig. 5, decreases with , a behaviour similar to that observed in previous experimental studies exploring the mechanics of other hygroscopic materials (Glenn et al., 1991; Kamst et al., 2002; Cao et al., 2004). A negligible difference is observed among different displacement ranges.
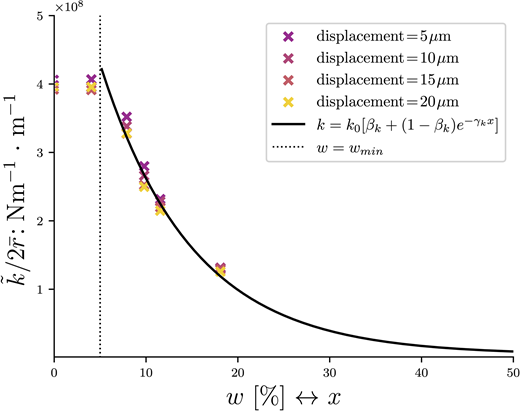
Couscous particles stiffness (apparent stiffness/average diameter) as a function of water content . The particles soften at higher water content levels. The effect of the piston displacement range is found to be negligible. A plausible fit with Equation 2 is shown as a dotted black line
Couscous particles stiffness (apparent stiffness/average diameter) as a function of water content . The particles soften at higher water content levels. The effect of the piston displacement range is found to be negligible. A plausible fit with Equation 2 is shown as a dotted black line
The cyclic tests are carried out to qualitatively investigate the loading–unloading response and the variation of the stiffness of particles undergoing cyclic loading. Here, the results of two cyclic compression tests are reported; the first test is performed on a relatively dry particle with = 4%, while the second test on a more hydrated one ( = 10%). The force–displacement curves of these two tests are reported in Figs. 6(a) and 6(b), respectively. The results suggest that does not vary between cycles up to the fifth cycle, after which the particle is most likely severely damaged. Further dependencies of the harmonic stiffness adopted in the Hertz–Mindlin model can be then neglected in first approximation. Moreover, the drier particle shows a fragile breakage, while the other exhibits a more ductile response.
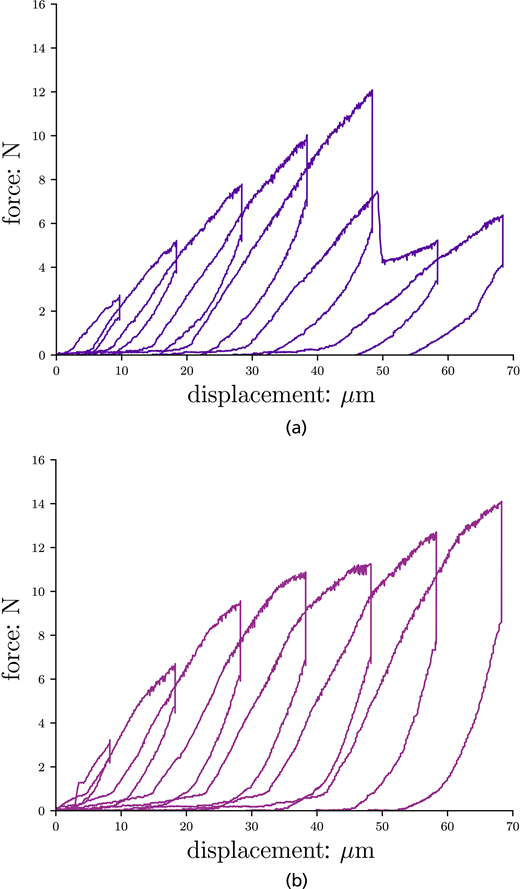
Force–displacement curves of cyclic compression tests at different water content levels: (a) 4% and (b) 10%. The loading and unloading apparent stiffness appear to remain constant throughout the tests
Force–displacement curves of cyclic compression tests at different water content levels: (a) 4% and (b) 10%. The loading and unloading apparent stiffness appear to remain constant throughout the tests
Notably, these cyclic compression tests show loss of linearity upon cycling loading and unloading, which is not crucial to capture the key macroscopic process of interest here (dilation and compaction of the sample upon constant load), but which could constitute an interesting future generalisation of the model.
