

Spun precast prestressed concrete (SPC) piles have been used in many parts of the world as a viable foundation alternative. This study assessed the load-carrying capacity of SPC piles passing through a deep soft subsoil layer and resting on a dense sand layer. The vertical bearing capacity of an SPC pile was estimated using various analytical methods and static pile load tests for the Jolshiri area of Dhaka, Bangladesh. The liquefaction potential of the site was assessed using local seismic site conditions and field and laboratory test data. The liquefaction analysis suggested that the topsoil layer was liquefiable to a depth of 4.5 m. The capacity obtained from the load test was compared with those obtained from different methods, the ultimate push-in load and local design guidelines. Finite-element analysied (FEA) was performed considering the hardening soil model using the Plaxis 3D software to simulate field conditions. The load–settlement response obtained from FEA showed good agreement with the test results. The capacity examinations primarily suggested that SPC piles could be a viable foundation solution for the subsoil conditions of the Jolshiri Abashon area of Dhaka.
Notation
- Ag
gross cross-sectional area of a pile
- amax
peak surface acceleration
- c
cohesion of soil
- d0
outer diameter of a spun precast prestressed concrete (SPC) pile
- di
inner diameter of an SPC pile
reference stiffness modulus corresponding to the reference stress
oedometer modulus
unloading/reloading stiffness
compressive strength of concrete
- fpc
effective prestress in the pile after losses
- Gmax
shear modulus
- Gs
specific gravity
- g
acceleration due to gravity
- Mw
moment magnitude
- (N1)60
SPT blow count with 60% hammer efficiency
- (N1)60cs
corrected SPT blow count for fine content with 60% hammer efficiency
- Pa
axial load-bearing capacity of an SPC pile
- Pref
reference stress
- Qdesign
design load
- Qult
ultimate load
- Qyield
load corresponding to yield point
- rd
stress reduction factor
- S
settlement
- Sult
ultimate settlement
- t
pile wall thickness
- Vs
shear-wave velocity
- wn
moisture content
- γsat
saturated unit weight
- γunsat
unsaturated unit weight
- νur
unloading/reloading Poisson’s ratio
- ρ
soil mass density
- σ0
total overburden pressure
effective overburden pressure
minor effective principal stress
- φ
angle of friction
Introduction
Hollow spun precast prestressed concrete (SPC) piles are gaining popularity as a deep foundation particularly in coastal zones due to their cost-effectiveness, flexural performance, large load-carrying capacity and quality control before pile installation (Cao et al., 2020). Previously, Meng et al. (2010) also suggested employing SPC piles to achieve optimum size, better quality and durability. Strength properties of SPC piles such as flexural behaviour and ultimate axial capacity have also been examined by a few researchers (Ahmed et al., 2023; Wang et al., 2020).
Previously, earthquake-induced liquefaction, such as those due to the Niigata (1964), Kobe (1995) and Tohoku earthquakes (2011), caused severe and extensive damage to both superstructures and foundations, which ultimately triggered not only economic loss but also loss of lives (Bhattacharya et al., 2011). Many researchers have analysed the liquefaction potential of the subsoil of different cities in the world to observe its susceptibility during earthquake events (Dixit et al., 2012; Gautam et al., 2017; Rahman and Siddiqua, 2016; Rahman et al., 2015a, 2015b; Satyam and Rao, 2014; Sharma and Hazarika, 2013). Rahman et al. (2020) performed liquefaction severity analysis at different locations in the Chattogram area of Bangladesh and prepared a hazard map based on liquefaction potentiality. Islam et al. (2010) studied the liquefaction vulnerability of different reclaimed areas of Dhaka City. Fahim et al. (2022) prepared a hazard map for Dhaka City of Bangladesh based on the liquefaction potential index and its cumulative frequency distribution by using an artificial neural network. Ansary and Rashid (2000) also assessed the liquefaction potentiality of the Dhaka metropolitan area based on the standard penetration test (SPT) method as proposed by Seed et al. (1985). Islam and Ahamed (2005) mentioned that some reclaimed areas of Dhaka City were susceptible to liquefaction.
The behaviour of precast piles under compressive loading was investigated in a study by Zhou et al. (2019), where three design interpretation methods were compared to assess bearing capacity. Among the methods, the double-tangent method was found conservative in the bearing capacity prediction. However, the ultimate bearing capacity and failure characteristics of a pile were also related to the shape of the pile (Phutthananon et al., 2018). Additionally, ground heave after pile installation can reduce the compressive capacity of a pile by 40% (Ahmadi et al., 2021). The bearing capacity of a pile in liquefied soil is significantly less under vertical loading conditions (Knappett and Madabhushi, 2008).
A large settlement of foundation can occur under static and lateral loading conditions, which can cause damage to pile-supported structures such as buildings and bridges. Yang et al. (2015) assessed the field behaviour of prestressed high-strength concrete (PHC) piles in sandy soil for a bridge project in China. Ling et al. (2019) determined the shaft resistance of pre-bored precast piles with an enlarged base in stiff clay. Kou et al. (2018) observed that the performance of open-ended PHC piles was more complex than that of solid piles due to the effect of soil plugs. Huang et al. (2020) reported that increased reinforcement ratio, pile depth and prestressing level could move the plastic hinge location of a pile at a deeper depth and improve soil–pile interaction. Kim et al. (2017) found that extended end piles could increase the bearing capacity by up to 24% compared with PHC piles. Spun pile foundation and design in cohesionless soil for a 16-storey building were numerically studied by Kyi and Phone (2019). However, their study was confined only to analytical modelling without conduction of any experiments.
Krishnan et al. (2021) conducted both experimental and numerical investigations using the Plaxis 3D software (Bentley Systems, 2019) and reported that loose sand improved with colloidal silica could reduce moment generation with the increase in vertical and lateral load-bearing capacity. Uzuoka et al. (2007) performed finite-element (FE)-based analysis to determine the dynamic response of group piles in reclaimed soil. Their three-dimensional (3D) analysis suggested that the pile yielded before complete liquefaction took place. Shafiqu and Sa’ur (2017) studied the seismic behaviour of piles using the FE program Plaxis 3D. The pile–soil system was modelled using dynamic soil properties and earthquake data in the analysis. The study concluded that the 3D numerical model could analyse the real response of seismic activity more accurately than the Plaxis 2D software. Mohey Mohamed et al. (2020) used the University of British Columbia 3D–Plaxis liquefaction model using the Plaxis 3D software to model the seismic liquefaction behaviour of soil and the hardening soil (HS) model to capture the soil dynamic behaviour. Therefore, the Plaxis 3D software is already an established computer program that can capture field situations in static and dynamic cases quite accurately.
Therefore, it is evident from the existing literature that although there are some experimental and numerical studies on pile responses in soft soil, there is no evidence of practical SPC pile load tests and its FE simulation in soft soil layers over a very stiff soil stratum. This study aims to determine the bearing capacity of SPC piles in liquefiable soil located in the Jolshiri Abashon area. After assessing the liquefaction vulnerability of the site, a static pile load test was performed at the research site to investigate the load–settlement behaviour and hence the bearing capacity of the pile at different situations. Finally, a numerical model was developed using the Plaxis 3D software to compare the field and numerical results.
Background and present state of the problem
Bangladesh is a part of the largest deltaic formation; the mighty rivers flow through deposits of a huge volume of silty and sandy sediment each year. The application of those sediments as hydraulic fill for reclamations of low-lying areas is very common in this region. The fill and subsoil to a large depth of this area are mostly saturated loose sandy or silty soils, which are expectedly liquefiable in this earthquake-prone zone during seismic events (Arnob et al., 2023). Previous records of earthquakes also project that Dhaka City is at potential risk of experiencing medium-level earthquakes soon.
The Jolshiri Abashon project site is reclaimed land located at the centre of the eastern side of the Dhaka Metropolitan Development Plan area of Bangladesh. The study site is situated 1.3 km off to the southern side of Purbachal’s new town, and on the east and west, it is surrounded by the Shitalakkhya and Balu Rivers, respectively. Figure 1 shows the pile test location in Jolshiri Abashon area.
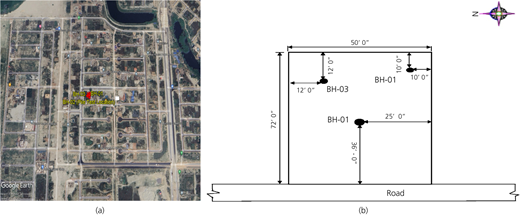
(a) Jolshiri Abashon project borehole location. Retrieved from Google Earth, 20 September 2024. Image © 2024 Maxar Technologies. Image © 2024 Airbus. (b) Borehole layout plan. 1′ = 1 foot = 305 mm; 1″ = 1 inch = 25.4 mm
(a) Jolshiri Abashon project borehole location. Retrieved from Google Earth, 20 September 2024. Image © 2024 Maxar Technologies. Image © 2024 Airbus. (b) Borehole layout plan. 1′ = 1 foot = 305 mm; 1″ = 1 inch = 25.4 mm
This study initially investigated the liquefaction potential of the site following the SPT method. A subsoil investigation was carried out to determine the geotechnical parameters of the soil. The study also used the analytical method proposed by Meyerhof (1976) and the Bangladesh National Building Code (BNBC) guidelines (HBRI, 2020) and the pile load test data to calculate the bearing capacity according to the shape-of-curvature, De Beer (1965) and Davisson (1970) offset methods. Considering the site soil parameters, the pile load test was simulated by the FE-based computer program Plaxis 3D.
Site soil characterisation
The study area is situated east of Natun Bazar, Badda, and south of the Neela market, Purbachal, in Rupganj Upazila, Narayanganj District of Bangladesh (near the capital Dhaka). It is located below the southern fringe of the Madhupur Tract, which is a Pleistocene terrace land consisting of northern Madhupur Garh and southern Bhawal Garh. The site includes anthropogenic fill soil, and recent land use changes have influenced surface geology and ongoing topographic transformations. The top layer of the land is a reclaimed layer consisting of loose sandy soil collected from the nearby river. The reclamation process was started in 2013 and ended in 2020. The original land was at 4.5 m below the current ground level. The consolidation process is still in progress, and some sites are adopting different ground improvement techniques.
Three borehole locations were selected within the area of a typical building site, as indicated in Figure 1. Subsoil investigation was carried out to obtain the subsoil profile of the site. By conducting penetration tests, disturbed and undisturbed soil samples were collected for performing laboratory tests. Figure 2 presents three borehole logs with SPT blow counts at different depths. It shows that the top layer of the soil (up to 4.5 m depth) consists of very loose sand with an SPT value below 15. The groundwater table is 4.8 m below the existing ground level (EGL). The Jolshiri area is surrounded by the Shitalakkhya and the Balu Rivers, so the soil in this site is mostly very soft due to the presence of organic matter. The soil is saturated and susceptible to liquefaction during earthquakes due to pore water pressure generation. All the boreholes suggest that below the top layer, there is an organic soil layer of 3 m followed by a 30 m thick layer of soft clayey silt with sand. A very dense sandy soil stratum is observed beyond a depth of approximately 37.5 m.
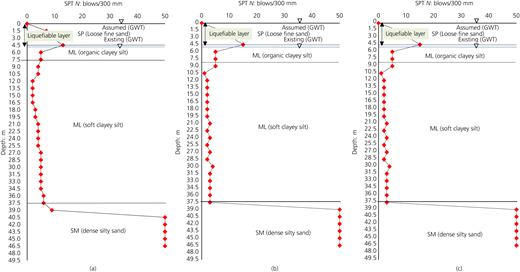
Soil profile with SPT N values of the selected site: (a) BH-01; (b) BH-02; (c) BH-03. GWT, groundwater table
Soil profile with SPT N values of the selected site: (a) BH-01; (b) BH-02; (c) BH-03. GWT, groundwater table
Classification, physical and engineering property tests such as grain size analysis and Atterberg limit, moisture content, organic content, unit weight, direct shear, unconfined compressive strength, consolidated drained triaxial and consolidation tests were performed on the collected soil samples, following the standard test procedures of ASTM, American Association of State Highway and Transportation Officials and BNBC 2020 guidelines. The soil layers were distinguished based on laboratory test results following the Unified Soil Classification System (USCS). Based on the laboratory test results, the grain size distribution curve is presented in Figure 3. The D50 means for loose and medium sands are 0.1850 and 0.3038 mm, respectively, while the fine fractions <0.075 mm are 11 and 9%, respectively. For clayey silt, the D50 mean is 0.0125 mm and fine contents are 95%. For dense silty sand and dense sand, the D50 means are 0.0298 and 0.255 mm and fine contents are 44 and 25%.
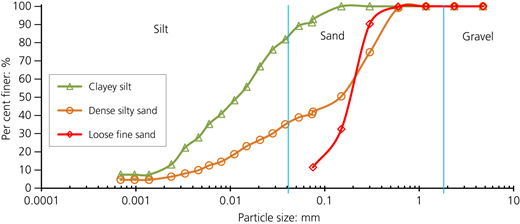
Particle size distribution of the site soil from combined sieve and hydrometer analysis
Particle size distribution of the site soil from combined sieve and hydrometer analysis
The field SPT values, soil classification, selected index and engineering properties are presented in Table 1. It shows that the soil strata contain silt of low plasticity with a liquid limit (LL) of 32–38% and a plasticity index (PI) of 6–12%. Nearly 90–95% of the particles are passing a #200 sieve. The undrained shear strength obtained is 15 kPa. When the depth exceeds 37.5 m, dense silty sand is found with an SPT value of 50 and above. The angle of internal friction of that layer is 36°. The grain size curve shows that the loose sand layer lies in the a–a′ region according to the Tsuchida (1970) curve. The curve indicates that the loose sandy layer of the site is susceptible to the high liquefaction phenomenon.
Soil properties obtained from laboratory tests
| Depth: m | SPT range | USCS | Unit weight, γ: kN/m3 | Saturated unit weight, γsat | Specific gravity, Gs | Moisture content, wn: % | Fines (#200 passing): % | cu: kPa | φ: ° |
|---|---|---|---|---|---|---|---|---|---|
| 0–4.5 | 0–11 | SP | 14 | 15 | 2.61 | 41.7 | 11–15 | — | 28.0 |
| 4.5–7.5 | 4–5 | ML(O) | 15 | 16.5 | 2.61 | 41 | 88–93 | 10 | — |
| 7.5–37.5 | 1–4 | ML | 16 | 17.5 | 2.63 | 35 | 90–95 | 15 | — |
| >37.5 | 30–50 | SM | 18 | 20 | 2.67 | 15 | 25–44 | — | 36.0 |
Dynamic soil properties such as shear-wave velocity (Vs) and small-strain shear modulus (Gmax) were estimated from field SPT N values using JRA (1980) method, as presented in Figures 4(a) and 4(b), respectively. Equations 1 and 2 were used to determine the shear-wave velocities of cohesionless and cohesive soils, respectively. The small-strain shear modulus (Gmax) was determined using Equation 3.
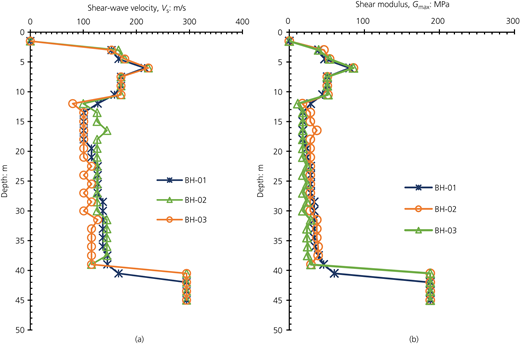
(a) Shear-wave velocity (m/s) and (b) shear modulus, Gmax, plotted against depth (m)
(a) Shear-wave velocity (m/s) and (b) shear modulus, Gmax, plotted against depth (m)
Here, Vs is the shear-wave velocity (m/s) and N is the SPT value.
Here Gmax is the shear modulus and ρ is the soil mass density. A minimum shear-wave velocity of 100–130 m/s was observed in a layer 12.0–37.5 m deep. From Figure 4(a), the maximum shear-wave velocity was observed to be 300 m/s at a depth of 40 m and below. As seen in Figure 4(b), the minimum shear modulus is 18 MPa at a depth of 12.0–37.5 m and the maximum value of G is 200 MPa, which is observed at a depth of 40 m and above.
Assessment of the liquefaction potential
According to the BNBC (HBRI, 2020), the maximum considered earthquake for the seismic design of structures in Bangladesh is an extreme earthquake with a 2% probability of exceedance for a 50-year return period. A few researchers and historical data claim that Bangladesh is prone to experiencing earthquakes with a magnitude of 7.0 or higher in the near future (Rahman et al., 2015a, 2015b). There are four seismic zones according to the BNBC 2020, and Dhaka lies in zone II. The peak ground acceleration (PGA) and the earthquake magnitude of Dhaka have been considered to be 0.20g and 7.5, respectively.
Using the field soil parameters and laboratory test data, a liquefaction analysis was performed to obtain the factor of safety (FS) at different depths. Soil parameters such as SPT N values, fine contents, unit weight, groundwater table and D50 were used in the liquefaction analysis. The groundwater table was considered at the EGL to account for the worst conditions. Seed and Idriss (1971) developed a procedure for determining the liquefaction potential using SPT N values, where the FS is defined as the ratio of cyclic resistance of soil to cyclic stress. The FS is calculated according to the following equation:
where CRR is the cyclic resistance ratio and CSR is the cyclic stress ratio.
According to their method, if the FS value falls below 1.00 for a soil layer, there is a potential for liquefaction during seismic events. Various researchers (Idriss and Boulanger, 2006; Seed et al., 1983; Tokimatsu and Yoshimi, 1983; Youd and Idriss, 2001) have studied the liquefaction phenomenon following the concept of Seed and Idriss (1971) and formulated different methods for estimating the FS. Updated procedures of Seed and Idriss (1971) proposed by other authors (Idriss and Boulanger, 2010) were used in the present study for all three boreholes. The CSR is calculated as
Here, amax is the peak surface acceleration; σ0 is the total overburden pressure; is the effective overburden pressure; g is the acceleration due to gravity; and rd is the stress reduction factor depending on z, which is the depth from the ground surface in metres.
For a magnitude 7.5 earthquake, the CSR can be written as
MSF is the magnitude scaling factor. The MSF can vary according to earthquake magnitude. The MSF can be determined using Equation 7 based on the magnitude (M):
For calculating the CRR, the SPT N value is obtained and N values need to be corrected for the overburden pressure, rod length, hammer efficiency, borehole diameter and sampler lining. After the corrected N60 value, the clean sand correction can be written as
FC is the fine content of the corresponding layer.
The value of CRR was determined from SPT blow count against fine content curve following the method by Seed et al. (1985). The following equation modified after Idriss and Boulanger can be used to calculate CRRM=7.5 for a given (N1)60cs:
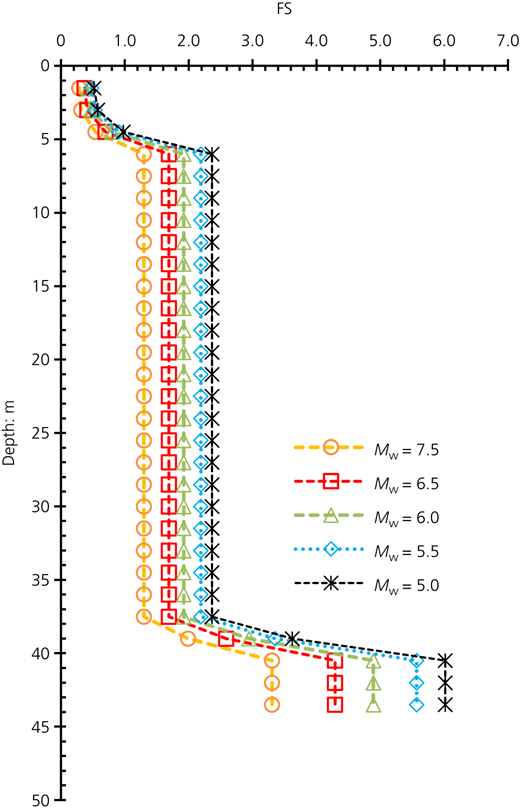
Figure 5 shows the liquefaction potential curves of the three boreholes for earthquakes of different magnitudes of 7.5, 6.5, 6.0, 5.5 and 5.0. Up to a depth of 4.5 m, the FS values are less than 1, which indicates a strong liquefaction probability at the upper layer. The results also show agreement with the existing literature (Islam et al., 2010) on loose sandy or silty soil layer liquefaction analysis.
SPC pile characteristics
The hollow circular geometry of the SPC pile used in the present study is shown in Figure 6(a). The fabricated SPC pile and the long section of the pile with reinforcement are shown in Figures 6(b) and 6(c), respectively. The SPC piles were fabricated through a special arrangement of caging and prestressing followed by the procedure of concrete pouring, rotating, steam curing and so on. According to the information provided by the manufacturing company, high-strength concrete (50 MPa and above) and high-strength strands were used for SPC pile casting. An effective prestress of concrete of 5 MPa was used in these piles to enhance the bending capacity so that the piles could withstand lifting and handling stresses. The pile length was designed to be 42 m consisting of three 12 m segments and one 6 m segment. The 6 m segment was installed last (placed at the top). All pile joints were made through the on-site 10 mm groove welding between the end plates. It is important to note that the weld connections were designed to be at least two times stronger than the sectional capacity of the SPC piles. Based on the geotechnical parameters, it was decided that the toe of the SPC piles would rest at a dense silty sand layer where the SPT value was more than 50. Therefore, the pile had the maximum toe resistance at the dense layer. The basic features and specifications of the SPC piles used in this study are presented in Table 2.
Features and specifications of the SPC pile used in the investigation
| Number | Description | Properties and specifications |
|---|---|---|
| 1 | Pile diameter, d0: mm | 450 |
| 2 | Pile wall thickness, t: mm | 110 |
| 3 | Pile length (segments): m | 42 (3 × 12 and 1 × 6) |
| 4 | Cement | Ordinary Portland cement |
| 5 | Concrete mix ratio | 1:1.25:2.5 |
| Fineness modulus of sand | 2.50 | |
| Max. size of aggregate: mm | 12 | |
| 6 | Material specification | Seven-wire prestressing strand |
| Strands: 9 mm dia. | 1860 MPa | |
| 7 | Spirals | 4 mm mild steel wire at 75 mm centre to centre |
It is important to note that the compressive load-carrying capacity of SPC piles is usually governed by the structural capacity, particularly while they are resting on stiff soil or rock. The allowable vertical axial capacity of SPC piles is suggested by the Precast/Prestressed Concrete Institute guidelines as follows (PCI Prestressed Concrete Piling Committee, 2019):
where Pa is the allowable service level axial load-bearing capacity of the SPC pile; Ag is the gross cross-sectional area of the pile; di and d0 are the inner and outer diameters of the SPC pile, respectively; is the compressive strength of concrete; and fpc is the effective prestress in the pile after losses.
Vertical bearing capacity assessment
A 450 mm uniform hollow circular SPC test pile was installed into the ground using the push-in method to determine the vertical bearing capacity of the pile, as shown in Figure 7. Initially, the bearing capacity of the test pile was estimated using the SPT-based method by Meyerhof (1976). In Figures 8(a) and 8(b), the estimated bearing capacities without and with liquefaction are shown, respectively, with respect to borehole depth where the skin friction of the pile is ignored in liquefiable layers in estimating the bearing capacity of the pile. From Figure 8(c), it is observed that in liquefiable soil, the skin friction of the pile is reduced, although not considerably, by approximately 9.4, 8.7 and 10.2% for boreholes 1, 2 and 3, respectively. A comparison between Figures 8(a) and 8(b) demonstrates that the ultimate bearing capacity is also affected by liquefiable soil characteristics. The ultimate pile capacity decreases by up to 5.0% for three boreholes. Therefore, the influence of liquefaction on the vertical capacity of the pile is nearly insignificant for this site. However, the lateral capacity and susceptibility of lateral spreading to any vulnerable site need to be evaluated to determine the overall bearing capacity for designing a safe foundation system.
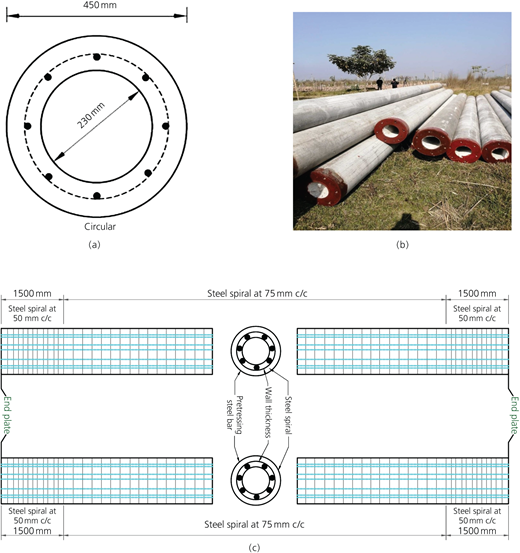
Geometry of the SPC pile: (a) circular hollow cross-section; (b) manufactured SPC pile at the site; (c) long section of SPC piles showing the spiral reinforcement schedule. c/c, centre to centre
Geometry of the SPC pile: (a) circular hollow cross-section; (b) manufactured SPC pile at the site; (c) long section of SPC piles showing the spiral reinforcement schedule. c/c, centre to centre
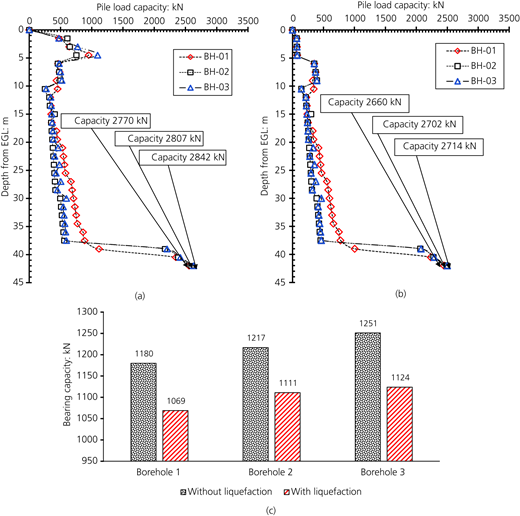
Bearing capacity of the precast pile foundation: (a) without considering liquefaction; (b) considering liquefaction. (c) Comparison of skin frictions with and without liquefaction
Bearing capacity of the precast pile foundation: (a) without considering liquefaction; (b) considering liquefaction. (c) Comparison of skin frictions with and without liquefaction
Pile bearing capacity using the push-in method
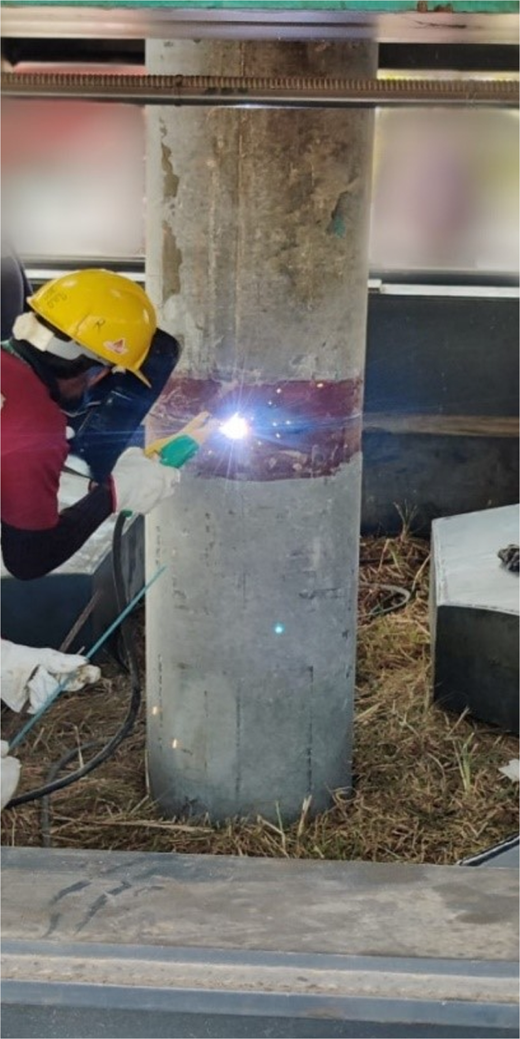
The circular hollow SPC pile was driven through the soft soil stratum where it rested on a dense sand layer at an embedment depth of 42 m. To reach that depth, three 12 m long and one 6 m long SPC piles were required to be connected through welding between the end plates of the piles. The pile grip was readjusted in every 1.5 m push-in. The pile pushing was stopped for 30 min during the welding of end plates. The pile tip was of conical, sharp steel and locked at the end. Therefore, soil plug or material come-out situations did not occur. No heaving was noticed in the process of the pile installation. The pile was inserted using the pile push-in method with a maximum load of 4067 kN.
Pile bearing capacity based on the pile load test
The static pile load test on the SPC pile was performed according to ASTM D 1143 (ASTM, 2020). The load set-up for the counterbalance with concrete blocks is presented in Figure 9. The hydraulic jack, dial gauge and linear variable differential transformers (LVDTs) are also presented in the figure. The data were stored directly to a computer through three LVDTs where load–deformation data with a micrometre precision were recorded and monitored. The dial gauge readings were also monitored by three on-site stand-in engineers.
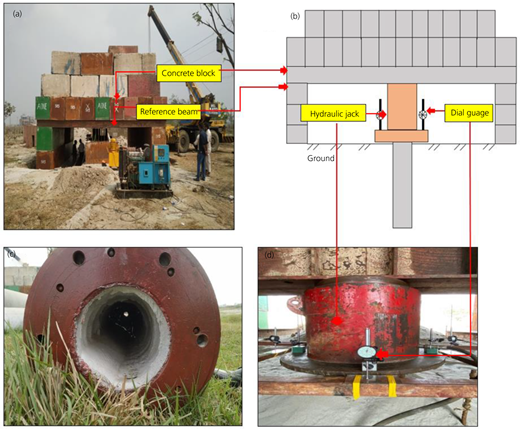
(a) Performance of the static load test; (b) schematic diagram of the static load test; (c) spun pile for driving in soil; (d) hydraulic jack and dial gauge set-up during the test
(a) Performance of the static load test; (b) schematic diagram of the static load test; (c) spun pile for driving in soil; (d) hydraulic jack and dial gauge set-up during the test
The incremental compressive load was applied as 10% of the ultimate load until 2500 kN was reached. The pile was loaded to reach the ultimate load and further loaded until failure through pile push-in. The applied load was maintained for 1 h, and the load was removed in decrements equal to the loading increments. A 20 min in-between gap was provided for decrements. The 50% of the design load was reapplied, allowing for 20 min between increments. The additional loads were applied after reaching the design load and maintained until failure occurred. After the maximum required test load had been applied, the test load was held for hours and removed when the pile failed under the maximum load. At a maximum load of 4280 kN, the pile failed. This was a concrete failure near the loading cap area and not a bearing capacity failure based on preset pile load test criteria (for a maximum settlement of 0.10D).
In Figure 10(a), the load–settlement curve was generated from field test data and the capacity was determined according to BNBC guidelines (HBRI, 2020). The allowable capacity corresponding to a 12 mm settlement was estimated that exhibited conservative results, as shown in Figure 10(a), where the allowable capacity was 1448 kN and the ultimate capacity was found to be 2896 kN. Alternatively, the shape-of-curvature method or tangent method (Olgun et al., 2017) is a widely used practice for determining the ultimate bearing capacity from field test data. The tangent from the initial part of the loading curve and the ending part of the loading part intersect at a point, and that point is considered the ultimate loading capacity of the pile. Figure 10(b) shows that the bearing capacity of the SPC pile is 3463 kN and its corresponding settlement is 24.60 mm in the shape-of-curvature method. The Davisson offset method is another widely accepted method for load capacity interpretation from the pile load test. This offset method defines the failure load. The elastic shortening of the pile is computed and plotted on the load–settlement curve, where the elastic shortening line passes through the origin. The slope of the elastic shortening line is 20°. An offset line is drawn parallel to the elastic line. In this method, the ultimate capacity is estimated to be 3790 kN for a 43.1 mm settlement, as shown in Figure 10(c).
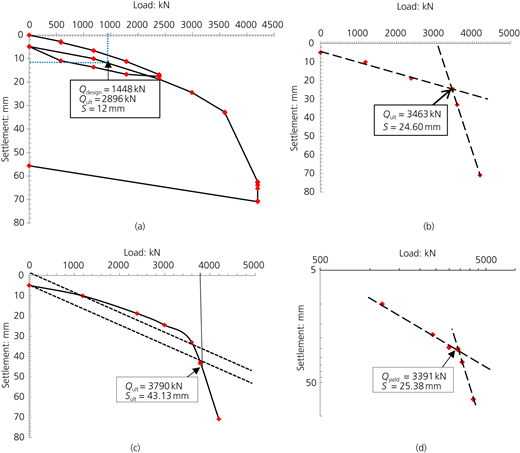
Load–settlement curves derived from the (a) pile load test, (b) shape-of-curvature method, (c) Davisson offset method and (d) De Beer method
Load–settlement curves derived from the (a) pile load test, (b) shape-of-curvature method, (c) Davisson offset method and (d) De Beer method
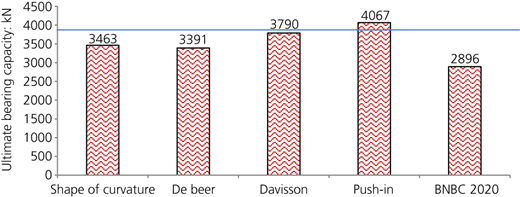
The yield capacity was found by log–log plot of the load–settlement curve using the De Beer method, and it was observed that the yield capacity was 3391 kN with a settlement of 25.4 mm, as shown in Figure 10(d). Among the methods, the shape-of-curvature and De Beer methods showed capacities closer to the pile load test design load capacity. In Figure 11, a comparison was made among different interpretation methods of bearing capacity. It was seen that the average load capacity was 3648 kN. However, the determination of the pile capacity using the aforementioned methods could provide a good range of bearing capacity options for designing the SPC pile for the Jolshiri reclaimed site. It can be observed from the comparison that the Davisson, De Beer and shape-of-curvature methodsxyielded a very close ultimate bearing resistance. The bearing resistance observed from the push-in test was 400 t whereas BNBC 2020 was found to be on the most conservative side.
FE model and validation
A 3D FE model was developed to simulate the actual pile load test using a commercial computer package, Plaxis 3D. A 450 mm dia. pile as installed in the site was placed in a soil domain of 20 × 20 m in both the x and y directions. The total depth of the model was taken as 45 m in the z direction considering a very stiff layer at the bottom, as shown in Figure 12(a). With a view of presenting the actual soil parameters, a borehole was located at the (0, 0, 0) point of the Plaxis model. Ten-noded solid elements for soil were assumed in the analysis process. The SPC pile was modelled as an embedded beam element (line element) in the soil medium accounting for soil–structure interactions. Among the three noded piles, two elements represented the soil element for characterising interaction through the pile skin and the remaining node represented the beam behaviour. After completing the soil and structural modelling, the FE meshes were generated by fine mesh where the number of elements and nodes were 14 505 and 22 879, respectively, as presented in Figure 12(b). It is important to note that the inbuilt fine mesh of the Plaxis 3D software is capable of converging the analysis outcome closer to the exact solution compared with other options such as coarse and medium meshes, although it requires high run time and computer capacity. After conducting the mesh sensitivity analysis, the finer mesh was chosen for accurate estimation of the pile capacity (Haque, 2022).
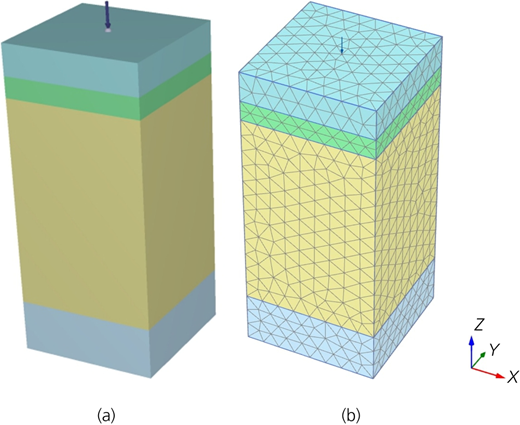
(a) FEM model developed in the Plaxis 3D software; (b) FE model with actual meshing
(a) FEM model developed in the Plaxis 3D software; (b) FE model with actual meshing
The soil properties are determined from SPT N value correlations and laboratory test results. To simulate soil-structure interaction and predicting non-linear stress-dependent soil, HS model shows high accuracy. In addition, the HS model has the capability to capture the stress and strain field of the soil in a non-linear mechanism, which permits the accurate estimation of the actual settlement response of the pile under staged loading conditions. The soil parameters considered in this study are presented in Table 3. The equations used for soil parameters are as follows:
where is the reference stiffness modulus corresponding to the reference stress P ref. is the reference oedometer modulus. is the minor effective principal stress. The amount of stress dependency is given by the power m. Drained analysis was performed using the HS model in the FE simulation. Finally, the axial load was applied as a point load step by step at the top of the pile to determine the load–settlement response of the SPC pile.
Soil layer properties used in the FE model
| Parameter | Unit | Loose sand | Clayey silt (organic) | Clayey silt | Silty sand |
|---|---|---|---|---|---|
| Unsaturated unit weight, γ unsat | kN/m3 | 16 | 15 | 16 | 18 |
| Saturated unit weight, γ sat | kN/m3 | 17 | 16 | 17.5 | 20 |
| Secant stiffness modulus, | kN/m2 | 10 000 | 12 045 | 15 060 | 38 250 |
| Oedometer modulus, | kN/m2 | 12 465 | 15 817 | 18 042 | 45 520 |
| Unloading/reloading stiffness, | kN/m2 | 30 256 | 36 087 | 46 584 | 117 040 |
| Cohesion, c | kPa | 0 | 15 | 15 | 0 |
| Friction angle, φ: ° | 28 | 22 | 25 | 36 | |
| Unloading/reloading Poisson’s ratio, ν ur | 0.2 | 0.2 | 0.25 | 0.25 | |
| Power for stress-level dependency of stiffness, m | 0.5 | 0.6 | 0.6 | 0.5 |
The displacement and the stress contours in the FE software indicate that this distance is sufficient. The load–settlement response obtained from the FE analysis was compared with the pile load test data, as presented in Figure 13. The analysis results show very good agreement with the test data (variations within 5%). This may happen because the HS model captures the stress and strain field of the soil in a non-linear mechanism that allows actual estimation of the load–settlement response of the pile. The validated model can be used to determine the influence of other parameters such as pile diameter, depths, evaluation of water level on pile by changing soil parameters.
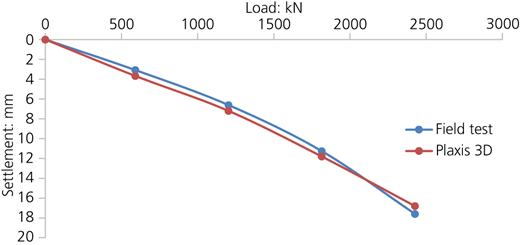
Comparison between test data and FE analysis output using the Plaxis 3D software
Comparison between test data and FE analysis output using the Plaxis 3D software
Conclusion
In a saturated sandy type of soil, the liquefaction potential increases the vulnerability of the foundation, which may lead to the failure of the global structure. Before conducting numerical validation using the Plaxis 3D software, the bearing capacity of the driven SPC pile was determined through pile load tests, where the pile push-in loads were also recorded. The key findings of this study are as follows.
The subsoil investigation suggested that there was a loose sand layer in the study area. A 30 m thick layer of soft clayey silt layer was noticed in all boreholes with a LL in the range 32–38% and a PI of 6–12%. The hard stratum was obtained at a depth of 37.5 m from the EGL, and as such, the toe of the SPC pile was proposed to be rested at 42 m, where the SPT value was more than 50.
Liquefaction assessment was performed for the reclaimed land of Jolshiri Abashon in Dhaka for Mw = 7.5 and PGA = 0.2g. The assessment showed that the site was vulnerable to soil liquefaction during seismic activity. The FS against liquefaction was found less than 1.0 up to a depth of 4.5 m.
The maximum pile push-in load of a 450 mm dia. SPC pile was recorded as 4067 kN. A static pile load test for axial compression was conducted to determine the bearing capacity of the pile. The pile load test was conducted with the proposed ultimate design load of 2500 kN and a maximum test load of 4280 kN, where a local concrete failure was observed at the top of the pile. The ultimate bearing capacities, using the shape-of-curvature, Davisson offset and De Beer methods, were found to be 3463, 3790 and 3391 kN, respectively. Applying the BNBC 2020 code criteria of failure, the ultimate pile capacity was found to be 2896 kN, higher than the design load of 2500 kN. Therefore, the vertical load-carrying capacity of the proposed SPC pile was found to be acceptable and satisfactory.
The analytical investigation showed that the skin friction of SPC piles was reduced by a maximum value of 10%, whereas the ultimate pile capacity decreased by only 4.5% due to the liquefaction effect. However, the bearing capacity determined by the analytical method underestimated the capacity obtained from the pile load test in all methods. The developed FE model showed close agreement with the actual load–settlement response, which ultimately demonstrated the validity of the test results. Therefore, the proposed technique could be a useful tool for predicting the bearing capacity of SPC piles through numerical analysis.
This study is limited to the vertical load-carrying capacity only in liquefiable soil of 4.5 m depth without considering any lateral spreading. Currently, the authors are conducting a series of research that investigates the lateral load-carrying capacity of SPC piles and their performances under seismic excitations where soil liquefaction is predominant.





Acknowledgements
The authors would like to acknowledge the test facilities provided by the Geotechnical Engineering Laboratory of the Department of Civil Engineering of the Military Institute of Science and Technology. The authors also acknowledge the support of the lab technicians during the experimental programme and pile load tests conducted by Bangladesh Machine Tools Factory Limited.

