


Planning a geotechnical site investigation can be a daunting task especially if the scope of works is substantial. Desk studies of available information and geotechnical risk assessments of proposed designs are challenging because the data must be accessed on different media and formats. This requires constant cross-reference to a multitude of applications and meticulous inferences between them. A significant quantum of ground information contained in large volumes of historical reports are difficult to retrieve and manage, leading to a loss of efficiency and coherence. Reliability of the information for use in scoping and design must be carefully assessed. Developing the scope of works requires site inspections to ascertain the feasibility of test points and to confirm accessibility. Explaining the proposed scope to the client for approval is the most critical task in the process and the current practice does not focus on improving the client’s appreciation for geotechnical risks and their buy-in to the proposed scope. This paper presents novel methods to improve the process of planning site investigations. It is based on the successful use of novel methods, powered by GIS, to plan a geotechnical site investigation for a major highway upgrade project in Queensland, Australia.
Introduction
Planning a geotechnical site investigation requires a desk study of available information to be conducted, as a first step, to enable an initial ground model to be developed and to plan the scope of the investigation (BSI, 2015). A desk study involves an office-based assessment of aerial photographs, topography and geology of the site, and historical site investigation reports to understand its geotechnical context (AGS, 2022). Scoping an investigation requires an understanding of project requirements and site restrictions to establish the geotechnical data needs for the project and potential methods available to assess these needs (AASHTO, 2020).
In planning intrusive site investigations, the goal is to establish a cost-effective feasible scope of works that obtains sufficient geotechnical data for the ensuing designs to comply with governing design standards and to mitigate the risks of ground-related hazards (geohazards). Failure to conduct an appropriately scoped investigation results in data gaps that cause undesirable consequences such as remobilising to the site for supplementary testing, overconservative and costly designs, or unconservative and unsafe designs (Sabatini et al., 2002). Desk studies are, therefore, considered an expectation of ordinary care when planning an intrusive site investigation (AGS, 2022).
The efficiency of conducting desk studies and the precision of scoping intrusive site investigations is often faced with the following challenges:
- ▪
Desk study information originates from various sources and must be accessed on different media and formats. The planner must constantly refer to a multitude of applications and make meticulous inferences between them.
- ▪
The reliability of its spatial information must be carefully assessed. Existing ground information resides in various historical reports which are prone to chronological changes in coordinate reference systems and capture methods.
- ▪
The reliability of the geotechnical information for use in the designs at hand must be carefully assessed. It is not unusual for the historical information to be not entirely reliable due to time-dependent changes in ground conditions, alterations to the site in the interim period, improvements in technology, or because the intent of the original investigation was different.
- ▪
Highway agencies typically budget for site investigations using a linear cost per kilometre method; with adjustments made for project specific incidentals estimated using informal engineering judgment (Alolote, 2018). The geotechnical risk assessment process lacks precision and structure. Risks are typically known in the head of the engineer and noted down somewhere in a spreadsheet or attached to reports. As a result, the presentation of risk information is not conspicuous enough to be fully appreciated by clients, stakeholders, or the wider project team. This may result in an inadequately scoped investigation.
- ▪
The feasibility of fieldwork must be confirmed by site inspections. On-site identification of issues and the shifting of proposed test points lead to a reconfiguration of the scope, which is a time-consuming process.
- ▪
Communicating the proposed scope of works to the client for approval is an intricate task. Documenting the approved scope is laborious as it involves the production of numerous layout plans, tables of test points, and guidance notes on accessibility and constraints.
This paper explains how these challenges can be resolved using novel methods, with a particular focus on geographical information system (GIS) mapping. GIS is a technology that is used to create, manage, analyse, and map all types of data (Esri, 2024). This paper was written to assist geotechnical and geospatial practitioners involved in planning site investigations to set up an efficient GIS for desk studies and scoping exercises. It is presumed that the intended reader has a working understanding of the analyses required in planning site investigations and indeed this paper does not replicate nor reiterate technical concepts from other papers. Instead, the reader will be directed to references for methodologies on how to undertake desk studies and scoping of site investigations. It was written from the perspective of a highway upgrade project in Queensland, Australia involving multiple new interchanges and bridges (“Project Gatekeeper”) to be fit for practical use.
GIS mapping in project gatekeeper
Step 1 – Establish WebGIS
While it is possible to jointly process complementary datasets to yield a single subsurface interpretation, this causes a loss of precision and efficiency. A more holistic interpretation is produced if all information is integrated through GIS software (Reynolds, 2012) where each data set can be geo-referenced to a common coordinate system, so that all datasets are summarised into one site plan (Chapman, 2012). Due to its staged design process, Project Gatekeeper adopted a multi-phased investigation approach that is preliminary investigation followed by a subsequent more targeted investigation for the next design phase. The authors recognised the benefits of having a holistic subsurface interpretation across the project lifecycle. Therefore, at the start of the project, a web GIS portal (WebGIS) was developed to facilitate the site investigation planning, and to aid the design and construction processes.
To manage information requirements, a discovery exercise was held with relevant subject matter experts. Reference datasets, such as, concept design, satellite images, topographical and geological maps, and other publicly available information, for example, contaminated ground, linear referencing systems and statutory environmental layers, were sourced from various information custodians. Table 1 shows eight different native formats of the key information used. This means that constant cross-reference to a multiple of applications, and spatial and engineering inferences between them are required. To improve efficiency and accuracy, a GIS-enabled web application interface (WebApp) was developed that superimposed the desk study information making them viewable on a single site plan.
Key desk study information used in planning the geotechnical site investigation for Project Gatekeeper
| Information | Native format | Viewer |
|---|---|---|
| Concept design | Federated Design or Computer-Assisted Design (CAD) Model | WebApp |
| Historical reports | Portable Document Format (PDF) | WebApp / PDF |
| Geological maps | Queensland (QLD) Department of Resources Spatial Database | WebApp |
| Environmental maps | QLD Department of Environment and Science Spatial Database | WebApp |
| Elevation database | Australia Elevation Information System (ELVIS) Spatial Database | WebApp |
| Aerial photographs | Proprietary Spatial Databases and Services | WebApp |
| 3D Ground model | 3D Ground Modelling Software | WebApp |
| Street-view | 360 camera footage (png, jpeg, or gif) | WebApp |
An important aspect of developing the WebGIS was identifying where and how the Single Point of Truth (SPOT) for data is managed. At the outset of Project Gatekeeper, the overall project information standards and data pipelines between systems were established and confirmed (Figure 1). This involved identifying and establishing the SPOT for various datasets. For instance, the concept design SPOT was in a computer-aided design (CAD) model managed by highway engineers, but viewable through the WebApp as a representation of this external SPOT. Similarly, ground information extracted from historical site investigation reports were stored in a central Ground Data Management System (DMS), managed by data engineers, which served as its SPOT (Step 2). In the WebApp, this ground information was shown as points that represented individual geotechnical logs and were linked to containers of the extracted information. However, data pipelines may be more subtle. For instance, the 3D ground model developed from Ground DMS information relied on engineering analysis and modelling and as such its SPOT was in the ground model, managed by geotechnical engineers, and not in the Ground DMS. Centralising all the information in the WebGIS to establish a Common Data Environment (CDE) was essential for coherent viewing and sharing of the various SPOT. Further guidance on establishing CDE can be found in ISO 19650 (ISO, 2019).
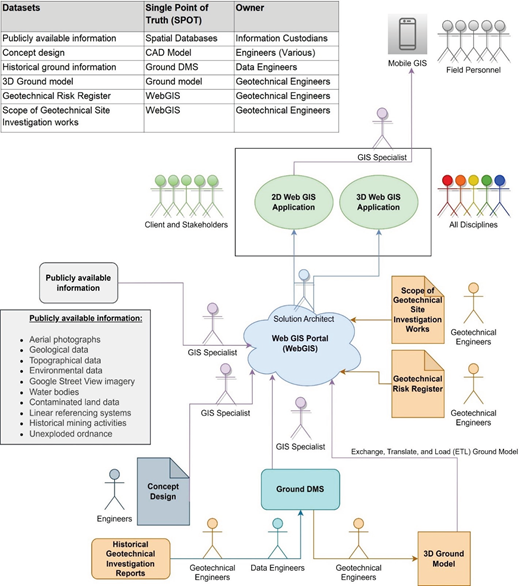
Data and information flows that enabled the WebGIS and WebApp to serve as a single site plan for the desk study and scoping process
Data and information flows that enabled the WebGIS and WebApp to serve as a single site plan for the desk study and scoping process
As data pipelines are confirmed, the methods by which information would be extracted, transformed, and loaded into the WebGIS (and associated WebApp) were defined. This helped established a common understanding between all stakeholders as to how and what information would be represented in the WebApp from the individual SPOT’s. A projected coordinate system was chosen as the first step. The data was then converted to this consistent projected coordinate system and formatted for publishing into the WebGIS as individual layers using geoprocessing and Extract, Translate and Load (ETL) tools. The data was then themed and customised in the WebApp to suit the audience for each discipline. For the desk study and scoping, interrogating each data layer and adjusting their transparencies and order enabled accurate review of the proposed design against the engineering context of the site (Figure 2).
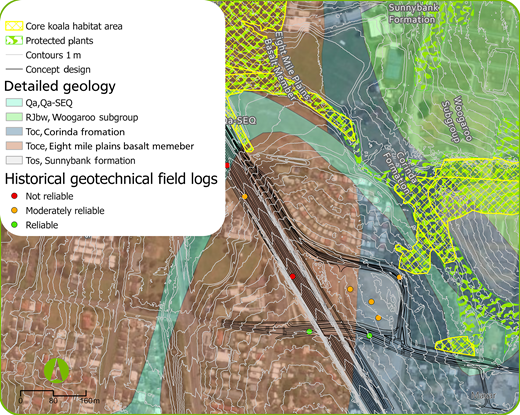
Layers of Project Gatekeeper's data in the WebGIS, superimposed and visualised in the WebApp on one site plan
Layers of Project Gatekeeper's data in the WebGIS, superimposed and visualised in the WebApp on one site plan
Having all the information on one site plan improved the visibility of geohazards. For example, from Figure 2 it can easily be observed that new infrastructure is proposed over varying surface geologies, that is, alluvial deposits (Qa) overlying residual soil of two possible geologies, that is, Eight Mile Plains Basalt Member (Toce) and Corinda formation (Toc). Differential settlement of fill embankments may be an issue at the interfaces between alluvium and residual soil. Piled foundations may encounter soft soils within alluvium and have to be designed to resist negative skin friction whereas those in residual soil need not. New pavements designed over residual soils of the Toce/Toc geological formations should consider the risk of expansive soils as both of these geologies are known to weather into “Black Earth” soil (derived from moderately weathered basalt) containing high contents of expansive clay minerals, for example, montmonllonites (Beckmann, 1967; Beckmann et al., 1987). The improved visibility of geohazards and design elements enhanced the accuracy of the geotechnical risk assessment (Step 3) and the precision of the scoping processes (Step 4).
Step 2 – Assess historical ground information
Geotechnical database
In Project Gatekeeper, ground information from historical geotechnical logs were digitised and stored in a geotechnical database. Due to the large quantum of logs dispersed across numerous archived locations and project folders, manual retrieval and reprocessing of the data required significant resources. To optimise the effort, a text extraction tool was developed and implemented which efficiently captured data from logs and organised it into a predefined structure, with specific emphasis on geomaterial classification by depth, coordinates, geology, and lithology. The extraction process integrated computer vision techniques to enhance document quality and analyse the structure of logs. Optical Character Recognition was utilised for text recognition and Large Language Models (LLM) aided in information retrieval, contributing to the recognition and categorisation of extracted text into predefined fields.
This novel method resulted in at least 64% labour costs savings for the data extraction task. The potential savings is dependent on how efficiently the following main challenges are managed. Refer to Appendix 1 for further information regarding the use of the text extraction tool, as well as calculations of savings in Project Gatekeeper.
- ▪
The format and quality of the historical logs varied significantly between organisations. A machine-learning model was introduced into the tool which enabled it to successfully identify and locate distinct report sections and categorise the extracted text into the AGS format.
- ▪
The accuracy of the machine learning model is critical as any errors or biases in the training data could lead to inaccuracies in the extracted data. This should be mitigated by classifying the reports according to format and structure to enable streamlined training for the model.
- ▪
There is always a risk of errors or inconsistencies in the extracted data. As such, this process should be accompanied with manual review of the extracted data by geotechnical engineers/geologists.
Once the data was extracted, reviewed and approved, it was directly committed to a singular aggregated source. In Project Gatekeeper, a cloud-based database with real-time data synchronisation, that is, Ground DMS was used. The Ground DMS was dynamic as the data could be updated, queried and accessed in real time by multiple users simultaneously, which promoted collaboration. The outcome was a secure digital repository from which datasets could be extracted in formats compatible with other proprietary software, for example, ground modelling and GIS software. This method of managing ground information was much more effective than the typical practice of using static files, for example, spreadsheets. Ultimately, users can have confidence that all the outputs represent the latest complete set of information available. Use of spreadsheets for data transfer and management is discouraged because of its unstructured nature, inability to enforce integrity or schemas, and interoperability issues (BSI, 2014). The Association of Geotechnical and Geoenvironmental Specialists (AGS) Data Format and the AGS Data Dictionary was used as the baseline schema to define the structure of the tables and fields in the Ground DMS (AGS, 1999). A relational database model was developed and implemented that linked tables and columns of data with one another, to ensure referential integrity throughout the database, which saved significant resources in information configuration management
Spatial data
A total of 81 historical site investigation reports in PDF files containing 1785 logs were supplied by the client to facilitate scoping of the geotechnical investigations. The reports were prepared by various consultants and agencies over the last 50 years and the spatial information varied in quality, for example, basic hand drawn mud maps, marked up engineering drawings, well described coordinate reference systems and local grids with no associated coordinate reference system described. An exercise to discover the location of each log was undertaken which categorised the data into four spatial reliability levels (Table 2). Ultimately, only 784 of the logs were deemed spatially reliable and incorporated into the WebGIS as points, that is, Levels A and B. The data was projected utilising the correct transformations to the common coordinate system, that is, GDA 2020 MGA 56. Spatial data from Level C logs could be extracted from the marked up engineering drawings by georeferencing each drawing, and manually digitising and determining a reliable spatial location; however, budget constraints prevented this. Level D logs could not be accurately located.
Summary of the spatial reliability levels of the 1785 historical geotechnical logs provided in Project Gatekeeper.
| Spatial reliability level | Description of spatial information | No. of test points |
|---|---|---|
| A | X and Y coordinates are provided with global position coordinate reference systems. | 128 |
| B | X and Y coordinates are provided in the log with local position coordinate reference systems. Uncertainties about the precise the coordinate reference system, were resolved using basic geospatial and engineering judgement. | 656 |
| C | X and Y coordinates are not provided and there is no coordinate reference system. Logs are referenced according to local chainages on site plans - without coordinates. | 604 |
| D | X and Y coordinates are not provided and there is no coordinate reference system. Logs are not referenced to anything. | 397 |
| Total: | 1785 | |
For design elements where spatial accuracy was critical, the capture methods of reported coordinates were carefully assessed for proximity to the design and representativeness of ground conditions. For example, the geotechnical standard for Queensland’s Department of Transport and Main Roads (TMR) requires boreholes for design purposes to be within 10 metres of bridge piers (TMR, 2020). Where capture methods or spatial accuracies were unclear, the data was carefully assessed as to whether it should be included as a reliable source to aid in scoping or design. Capture methods ranged from the use of consumer grade handheld GPS’s and smart phones, to digitised locations based on geographic information like aerial imagery, mud maps and sketches. The methods have varied degrees of accuracies, and a moderately conservative approach tempered with engineering judgement was applied in the assessment.
Geotechnical data
Reliability assessment
Although historical reports may provide useful data, the information should be used with caution. Reliability must be scrutinised by evaluating the consistency of the information and the overall quality of the report (Sabatini et al., 2002). The following examples are illustrative. Thirty year old reports of compressibility parameters for soft soils cannot be directly used as it requires consideration of the chronological changes in stress history and overconsolidation ratio. Reports older than 20 years tend to provide mechanical cone penetration test (CPT) data that is without pore water pressure measurements, which do not match the current conventional soil behaviour indices based on piezocone CPT. Pavement investigation test data tend to be shallow and focused on basic material classification tests which may not be adequate for designing ground treatment of soft soils.
In Project Gatekeeper, a semi-automated process for conducting reliability assessment of the historical geotechnical data was developed based on a scripted geoprocessing approach in the WebGIS. The assessment used GIS tools and Python codes to undertake a spatial variability analysis and multi criteria assessment of the historical data in relation to the geohazards mapped in WebGIS as polygons (Step 3). A reliability assessment framework was defined by geotechnical engineers and scripted by GIS specialists to undertake the assessment rapidly. Materiality assessment of the criteria concluded that the quality of the geotechnical design parameters was of paramount importance as it dictated the level of confidence in design and was thus allocated a 50% weighting. Proximity of the data in relation to the design element(s) and complexity of the underlying geology was also considered important to account for spatial variability. As such, a 40% weighting was allocated to these two criteria. A project-specific decision was made to allocate a 10% weighting to the age of the data. This accounted for the lower levels of confidence when using older data, due to chronological changes in geotechnical logging terminology and descriptions, technological changes in testing, and terrain changes (caused by developments) along the highway. In summary, the assessment applied the following criteria.
- ▪
Age of Information (Materiality = 10%). The more recent the information, the more likely it is to be representative of in-situ conditions and based on more refined equipment and was thus given a higher score.
- ▪
Geologic Context (Materiality = 10%). Increasing complexity in surface geology implies increased spatial variability where the historical data is less likely to be representative of ground conditions. Data in simple or homogeneous surface geology was thus given a higher score.
- ▪
Horizonal Spatial Relevance (Materiality = 30%). Reliability of the historical data for use in design will depend considerably on proximity of the data in relation to the design structures. Data closer to the design contained less spatial variance, was deemed more reliable and given a higher score.
- ▪
Geotechnical Design Parameters (materiality = 50%). The adequacy of the depth of ground explored and the relevance of the reported geotechnical parameters were deemed the most significant factors governing reliability. The more adequate and relevant the data, in relation to the design at hand, the higher it was scored.
Using Python and Esri Arcpy libraries, the GIS scripts scored each historical field log against the pre-defined criteria for Age of Information, Geological Context, and Horizontal Spatial Relevance. Geotechnical engineers assessed the Geotechnical Design Parameters from the reports and input scores into the framework in relation to the designs at hand. All scores were combined into a single reliability rating for each field log, and the points were colour coded accordingly in the WebApp (Figure 2). This enabled easy visualisation of reliable design ground information across the site. This aided the ground modelling and made the geotechnical risk assessment (Step 3) and the scoping (Step 4) processes more robust. Ultimately, the use of this novel method to conduct the geotechnical reliability assessment created significant labour savings of approximately 54%. This calculation is presented in Appendix 2.
Ground modelling
Since the information in the Ground DMS was sourced over time from various projects and consultancies, the reported geological interpretations contained variability in their definition of geotechnical units. This was resolved by ground modelling. An experienced geotechnical professional harmonised the geotechnical units through the development of a 3D ground model and ensured that inconsistent data were reviewed, altered, or ignored when evidence allowed.
The 3D ground model was created in a step-by-step process using specialist ground modelling software. The local topography and geologies were studied from incorporated maps to gain a geological understanding of the site. Data points representing each spatially reliable borehole were imported from the WebGIS into the ground modelling software and placed into the 3D model which was configured to the same coordinate reference system. Viewing the borehole data points on top of geological maps and topographical surfaces, the geotechnical professional classified the ground profile for each borehole into a pre-defined harmonised system of geotechnical units, for example, fill, alluvium, residual and bedrock, with the units from all the existing reports grouped as subunits. The geotechnical professional then interpolated between the borehole ground profiles to establish the surfaces of each geological layer in the model (Figure 3). With the proposed development superimposed, the 3D ground model had the added benefit of reducing workflows, as ground profiles and cross-sections could be readily produced and analysed.
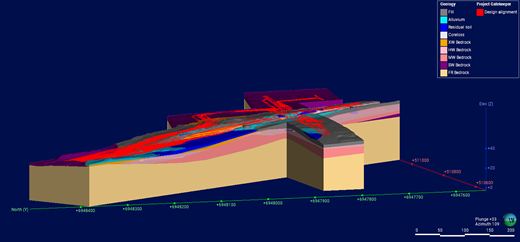
Spatial variability analysis in the 3D ground model using the default variogram model with manual adjustment
Spatial variability analysis in the 3D ground model using the default variogram model with manual adjustment
The interpolation combined conceptual modelling based on geological concepts (e.g. modifying alluvium layers by reviewing base maps to trace the historical geomorphology of creeks) with observational modelling based on observations and measurements (e.g. interpreting rock mass defects and strength from borehole data and applying classifications to the bedrock layers). The observational model was used to prove the conceptual model and highlight inconsistencies which needed to be reinterpreted and amended, if required.
In a 3D ground model, the information closer to boreholes are generally more reliable as they are based on an observational model. Information farther from boreholes are considered less reliable as they are based on a conceptual model and are susceptible to uncertainties caused by a lack of data, and/or bias of the model developer. Designers attempting to rely on the model information from the space between boreholes must appreciate that this represents a higher risk that the actual ground may be more onerous than presumed, leading to latent conditions which cause delays and cost overruns, or unconservative and unsafe designs. To manage this risk effectively, the level of risk involved should be assessed at the outset. The main drivers in this decision are the criticality of the design, and geological complexity in the vicinity. Therefore, it is considered an essential task in 3D ground modelling that the model developer(s) informs all potential downstream users of how the model was made (e.g. conceptual or observational), the input information that was used (e.g. basic or detailed quantum of ground data) and the degree of confidence across the model (e.g. higher confidence closer to the observational model and lower confidence at areas of solely conceptual model). Users of the model information would then have a greater appreciation of the model’s limitations and would be more equipped to assess their own level of confidence and adapt their reliance on the information accordingly.
Depending on the level of risk involved, the following mitigation measures may be applied:
- ▪
If the risk is low to moderate, then consider the use of geophysical techniques, for example, seismic refraction, to assess the spatial variability between boreholes. If this is not viable, consider additional intrusive investigation. One should only consider transferring this risk to the construction phase as a last resort, that is, when all options have been exhausted.
- ▪
If the risk is high to critical, then seriously consider undertaking additional intrusive investigation.
Step 3 – Geotechnical risk assessment
Despite significant developments in the geotechnical industry over the last 50 years, major difficulties still regularly occur which cause costly delays to projects, damage to adjacent infrastructure and injuries or deaths (O’Brien and Burland, 2012). The main contributing factor is the lack of a coherent and systematic approach to ground risk management. Recent studies of cost overruns in highway projects found that poor ground risk management is still currently ongoing to various degrees in highway organisations and can have a significant financial impact on project completion cost (Alolote, 2018). It is, therefore, of paramount importance to appreciate that site investigations can be significantly improved via a continuing risk management process that starts early enough (i.e. in desk studies) to establish cost-effective solutions (Clayton and Smith, 2013).
In Project Gatekeeper, the WebGIS superimposed desk study information onto one site plan which significantly aided geotechnical engineers to identify geohazards and quantify risk. For instance, the implementation of a fill embankment over soft soils is a geohazard that may result in bearing capacity failures or differential settlement issues. Using the WebApp, the extent of these geohazards and their perceived risks were visually gauged using maps of geological data combined with well-winnowed experience, for example, soft soils were almost certain/likely in Holocene alluvium, likely/possible in Pleistocene alluvium and unlikely/rare in residual soil.
The WebApp enabled users to map the extent of geohazards as polygons. Once a polygon was mapped, users were prompted to provide the corresponding risk information according to a predefined data schema that included hazard likelihood, descriptions of consequence, potential mitigation strategies/design solutions and the required ground data. This systematically compelled and guided the user to undertake a coherent geotechnical risk analysis. Once the risk information was detailed, the polygons were automatically assigned a Risk identifier (ID) for reference purposes. The outcome was a GIS layer of risk ID polygons colour coded according to risk classification (Figure 4). This enabled the project team to visualise the ground risks associated with the design, with the risk information accessible by a click of the button. The polygons and risk information were stored in the WebGIS as the SPOT. Changes were easily made to the data, through a WebApp editing widget, which updated the SPOT. As a result, the latest dataset of geohazards and risk information was accessible in real-time, with the option to extract a risk register spreadsheet.
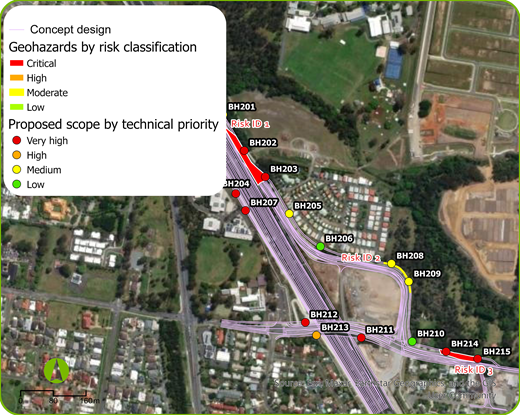
The WebApp showing geotechnical risks mapped polygons and proposed field test locations mapped as points
The WebApp showing geotechnical risks mapped polygons and proposed field test locations mapped as points
Step 4 – Scoping
In Project Gatekeeper, gap analyses were undertaken to identify data gaps for the geotechnical designs. The scope of site investigation works was subsequently developed by stipulating fieldwork and laboratory tests that would minimise data gaps in relation to design solutions for geohazards (e.g. ground treatment for soft or expansive soils) and the requirements of governing design standards for design elements (e.g. piles for bridges or settlement criteria for embankments). The WebApp enabled users to map data points to represent the proposed test locations (Figure 4). Given the ability to visualise the risk polygons and all other desk study information, this was executed with “pinpoint” precision.
Once a proposed test point was mapped, users were prompted to provide specific testing details according to a predefined data schema that included fields such as exploration type, nominated depth and required laboratory tests. A logic tree was developed to determine the Testing Intensity Level required for each geohazard and the Technical Priority Class of each test point based on geotechnical risk level and the availability of reliable design information (Figure 5). Testing Intensity Levels were defined as follows:
- ▪
Detailed – Propose a preliminary round of drilling and tests to obtain data for the full extent of the area of concern. This is followed by a second round of drilling and tests that are targeted at residual concerns. Advanced in situ or laboratory tests are used to determine the design parameters for each design element.
- ▪
Extensive – Propose drilling and tests to obtain data for the full extent of the area of concern. Advanced in situ or laboratory tests are used to determine the design parameters for each design element.
- ▪
Basic – Propose drilling and tests to obtain data for the base extent of the area of concern. Standard in situ or laboratory testing are proposed, combined with the use of well-winnowed correlations, to determine the design parameters.
- ▪
Nominal – Propose drilling and tests that are sufficient to fill the identified data gaps to a nominal level.
- ▪
None – No investigation required.
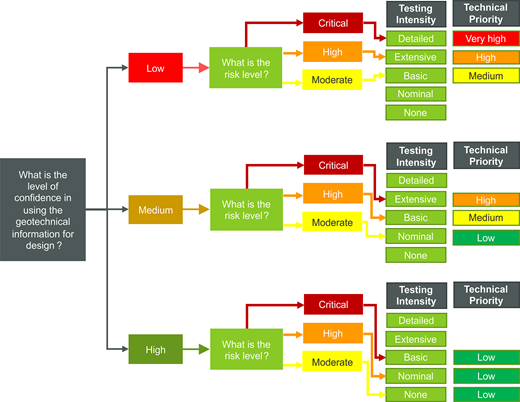
The logic tree used to determine the Testing Intensity Level required for each geohazard and the Technical Priority Class of each proposed test point
The logic tree used to determine the Testing Intensity Level required for each geohazard and the Technical Priority Class of each proposed test point
In the WebApp, the test data points were colour coded according to Technical Priority Class which was highly beneficial for value engineering the scope (Figure 4). This exercise compelled and guided the user to provide essential information for executing the field test thereby ensuring rigour and quality of the scope.
Information associated with the proposed test data points were stored in the WebGIS as the SPOT and was viewable in real time by the project team via the WebApp. This enabled the different disciplines of the project to “co-create” the scope of geotechnical test data points with minimal impacts and maximum efficiency. For example, it allowed the environmental teams to assess the viability and impacts of proposed test data points and to comment on ecological requirements. The use of topographical 1 metre surface contours enabled test data points to avoid sloping ground and minimise the necessity of working platforms. For illustration, in Figure 6, the 1 metre surface contours show that executing a borehole at Location Y requires the construction of a working platform to mitigate sloping ground. It also shows encroachment of protected plants and a core koala habitat which would require an ecological study. Two alternate locations to obtain similar data without encountering these restrictions are Location X1 and Location X2. Executing at Location X1 would require traffic management while executing at Location X2 would require vegetation clearance. Ultimately, Location X2 was preferred due to lower cost and it being more representative that is greenfield like Location Y. This type of analysis reduced the site inspections, to a point where “site verification” was a more apt term for the exercise. Furthermore, the data was made directly available to field personnel through mobile GIS applications (Figure 1). If an issue was identified during site verification that was missed in the desktop scoping exercise, then it could be adjusted, real-time, in the field.
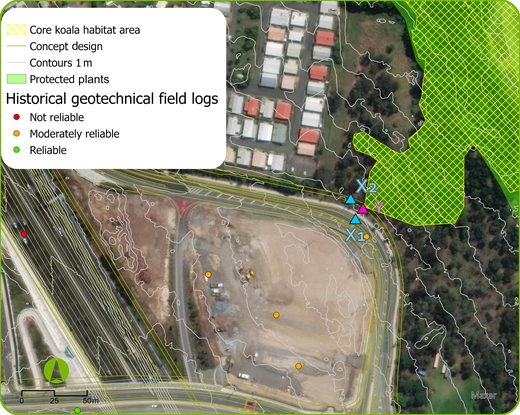
The WebApp showing some of the known site constraints in Project Gatekeeper which improved the scoping process and minimised the site inspections
The WebApp showing some of the known site constraints in Project Gatekeeper which improved the scoping process and minimised the site inspections
One of the key lessons learnt in Project Gatekeeper was that managing the data and the information correctly enables easy delivery of the products in a rapid and organised fashion, which can significantly reduce labour costs. For instance, the proposed test data points could be moved through a WebApp editing widget, which updated the SPOT upon saving. This enabled the team to deliver vivid presentations to the client, allowing them to comment on and adjust test data points. When test data points were scrutinised, the authors explained the rationale based on geohazards and risks using the different layers in the WebApp. This increased the client’s appreciation for the geotechnical aspects of the project, and ultimately facilitated involuntary buy-in to the proposed scope.
Once the gap analysis and scoping exercises were completed, the SPOT enabled the efficient map production and exporting of tabular information by a GIS professional utilising desktop GIS software with very minimal data engineering and data sourcing required to produce maps. These maps and tables pinpointed the location of all test data points, provided the specification (e.g. nominated drill depth and laboratory testing) and described site-specific requirements (access and traffic management requirements). This produced considerable savings in the production of reports. Access to a controlled version of the WebApp could be given to tenderers and the awarded contractor for the works. This leads to better collaboration and understanding of the scope by all parties, and ultimately lower bids and prices. Once the site investigation works are completed, the factual data can be uploaded into the Ground DMS easily as the data points are already in the pre-defined format and referenced to the project’s single coordinate reference system. This enables an organised and efficient update of the WebGIS, the 3D ground model, the geotechnical risk register and the proposed scope for the next design stage.
Costs and benefits
The WebGIS described in this paper is a powerful tool for spatial collaboration, that is, multiple disciplines working on the same database/SPOT via the same web mechanism. For example, when editing a word document in a modern content engine like SharePoint, many users can edit and collaborate on the same file, whereas in the past there would be numerous word documents with numerous versions which needs to be compiled leading to significant inefficiencies, quality and version control issues. A web-based spatial interface configured correctly is like a word document in SharePoint. The location of geotechnical boreholes can be visualised, assessed and confirmed by various disciplines. This may ensure getting the optimal balance between the engineering requirements, environmental approvals and associated contaminated land assessments to ensure the best location for the borehole and obtain client buy-in. Spatial collaboration enables significant advantages in scoping geotechnical investigations such as a more cost-effective scoping process, significantly increased accuracy, a more robust geotechnical risk assessment, increased client buy-in and ultimately a more appropriate scope of works.
However, at present, establishing a corporate web-based interface like the one described in this paper requires large upfront expenditure. The potential value of this technology increases as the need for spatial collaboration increases. Therefore, this technology is very valuable in mega projects due to the need for complex spatial collaboration and less valuable in smaller-scale projects, for example, a residential building footing or a commercial building. Practising engineers are likely to have observed that systems like the WebGIS described in this paper are becoming more widely used and indeed, most Tier 1 engineering consultants and major clients in Australia already possess a well-established web-based GIS. For such organisations, leveraging these technologies in small-scale projects is scalable. Smaller companies that cannot leverage the economies of scale to afford the upfront cost can explore open-source tools, mobile applications associated with government and other third-party stakeholders (e.g. QGIS and Queensland Globe) to perform a similar function and achieve similar sorts of efficiency – albeit without the full benefits of spatial collaboration.
The software processes and digital tools to be used in a project are typically considered in the planning phase. This should include a cost-benefit analysis of whether to implement a web-based GIS. At present, cost-benefit analyses used to decide the implementation of this technology is typically conducted in qualitative terms but once efficiencies are better established the analysis could shift to become more quantitative. Going forward, the cost of these technologies is likely to decrease. This means that the barrier to entry would shift from upfront expenditure to training geotechnical engineers to have a fundamental and more comprehensive understanding of GIS and the requisite data management skills.
In Project Gatekeeper, use of the text extraction tool (Step 2) provided at least 64% labour savings ( Appendix 1) while use of the semi-automated geotechnical reliability assessment provided approximately 54% labour savings ( Appendix 2). It was not useful to quantify the labour savings involved in the spatial analysis, geotechnical risk assessment (Step 3), and scoping (Step 4) due to significant differences between the methods described in this paper and conventional methods. However, it appears evident to the authors that in a large multi-stage project with numerous rounds of testing and design changes that the use of these methods would be significantly more efficient. Furthermore, use of these methods will significantly improve the quality of the final scope and greatly enhance the client and stakeholder experiences.
Research and development
Ground model and building information modelling
Ground modelling can be done in numerous GIS packages. However, it is more efficient to execute the work using specialist ground modelling tools because the processes have been optimised to build the model in the most efficient way. Once the 3D ground model is completed, it is best displayed for the project team and stakeholders through the WebGIS in a 3D WebApp (Figure 1). By transforming the ground model into the WebGIS, users can immediately see the model without knowledge of how to operate specialist software. This transformation involves the creation of a representation of that ground model using ETL tools, for example, Feature Manipulation Engine (FME).
As Building Information Modelling (BIM) will be required by the client in the next design stage of Project Gatekeeper, a solution architect is currently developing the WebGIS capability to import the 3D ground model, from specialist software, so that it can be visually superimposed with the BIM of the superstructures and made viewable on the WebApp in a single model. For efficiency, an information pipeline process and a FME server function is currently being developed that will allow the 3D ground modeller to trigger the function which automatically updates the server and the WebGIS.
Automation
Research from highway projects shows that when expenditure on site investigations is less than 1% of the total project cost, cost overruns were found to be as high as 100%, while expenditure of around 6% appeared to limit the risk of overspend to less than 10% (Simons et al., 2002). In practice, the scope of works is almost exclusively governed by how much the client is willing to spend and not by what is needed to characterise the subsurface conditions appropriately (Jaksa et al., 2005). It is, therefore, of paramount importance to ensure that the desk study and scoping processes are designed to help clients appreciate the geohazards and geotechnical risks associated with their project, so that an appropriate level of expenditure is budgeted for the investigation. In Project Gatekeeper, it was very apparent that novel methods enabled by modern technologies and powered by GIS can be leveraged to achieve these goals. Additionally, it was recognised that the planning process could be optimised to provide significant cost and time savings. Consequently, the authors are currently developing a digital tool that automates large parts of the desk study and scoping processes for Project Gatekeeper (Figure 7). The main limiting factor to the functionality of such a tool is the lack of standardisation of tasks and products in the geotechnical industry.
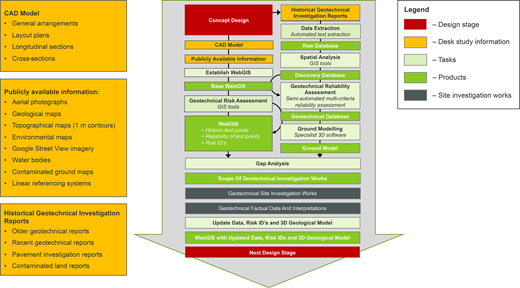
Summary of the process of planning Project Gatekeeper’s geotechnical site investigation
Summary of the process of planning Project Gatekeeper’s geotechnical site investigation
Standardization
Modern technologies allow geotechnical information to be managed as an asset in digital form, whereas in the past the focus was on hardcopy deliverables. However, geotechnical practice has not evolved as much as software and technologies have, and the industry is still focused on traditional report based outputs. To plan geotechnical site investigations more accurately and efficiently, a paradigm shift is required for the management of geotechnical information and associated spatial data in standardised interoperable formats.
The custodians of geotechnical reports should manage all ground data and information holistically. To facilitate this, geotechnical engineers must ensure that standard conventions, data specifications, schemas, and report structures are defined and maintained throughout the project delivery cycle. Ideally, all geotechnical information should be managed and transferred in a singular, industry-specified, agnostic, open and interoperable digital file format. This would make test points more discoverable to a broader audience, as it would minimise the need for geospatial professionals to interpret, decipher and cleanse the information prior to use. An example of this is the AGS Data Format, which is accepted by many in the ground engineering industry as being appropriate for the electronic data transfer and management of ground information (AGS, 1999).
Spatial information must be captured, maintained, and published. Site or local grid reference systems are not preferred, as the parameters are often not published publicly. This was accepted in the past when CAD software was not as geographically sophisticated and aware as it is today. However, it is exponentially more difficult to locate local coordinates in the real world when the coordinate system parameters are unknown or undiscoverable. Spatial data of geotechnical information must contain the following to be discoverable:
- ▪
Every data point must reference the coordinates and the associated recognised projected coordinate system, both vertically and horizontally.
- ▪
The vertical reference plane for depth measurements must be stated and captured as part of the metadata (typically, this is the existing ground level).
- ▪
Capture methods and associated accuracies of every data point must be captured as part of the metadata.
Conclusions
Novel methods, powered by GIS, can resolve many of the main challenges in planning intrusive site investigations, as exemplified in Project Gatekeeper. Project information in different media and formats were loaded into the WebGIS and summarised into a single site plan, enabling a more holistic interpretation of subsurface conditions and a more accurate review of the proposed design against the engineering context of the site. Historical geotechnical information from site investigation reports were retrieved using an automated text extraction tool that leveraged computer vision techniques, optical character recognition, LLM’s and machine learning models to produce more than 60% savings in overall labour costs compared to manual extraction. The information was directly committed to a cloud-based database with real-time data synchronisation which promoted collaboration and ensured that the right people have the right information at the right time. A spatial-based multi-criteria reliability assessment of the historical geotechnical information was undertaken. For efficiency, large parts of the process were automated using a scripted geoprocessing approach and Python codes to perform spatial variability analysis.
The WebApp enabled users to undertake a structured geotechnical risk assessment with improved accuracy and efficiency. It enabled users to scope the site investigation from a more informed position, and with greater precision and referential integrity. The dynamic nature of the WebApp enhanced the collaboration with the project team and reduced the site inspections. It enabled interactive scoping exercises with the client, promoting their buy-in to the final scope.
The authors recognise that modern technologies can be leveraged to establish an efficient desk study, risk assessment and scoping process that is designed to help the client appreciate the project’s geohazards and geotechnical risks. The goal is to strike an optimal balance so that an appropriately scoped and cost-effective investigation is executed. As such, the authors are currently developing the following:
- ▪
A digital tool that will automate many aspects of the planning of geotechnical site investigations.
- ▪
Capability in the WebGIS to harmonise 3D ground models with BIM.
Acknowledgements
The authors would like to acknowledge Aurecon Australasia Pty Ltd, and the contributions of Ha Tran and Caitlin Hanrahan in Step 2.
Appendix 1 – Data extraction of existing ground information
The format and quality of the data on historic logs varied significantly between organisations, which challenged the text extraction process. To resolve this, a machine learning model was developed that accurately identified and located distinct sections within the primary content of the log. This approach involved a comprehensive analysis of logs from various organisations, identifying recurring patterns and features across diverse datasets. This enabled the disentanglement of the complex structure of geotechnical logs into 2 primary processes.
Extraction of pertinent information from headers encompassed various details such as borehole identifiers, project names, geographic locations and spatial information. Advanced LLM’s were leveraged to enable the tool the flexibility to seamlessly adapt to diverse variations and produced accurate and consistent retrieval.
Extraction of core information from the body. Data exists in a tabular format with headers for each element, for example, material descriptions, in situ test details, weathering, consistency and stratum information. Aligning and estimating their corresponding depth information, the tool exceled in accurately identifying and locating the pivotal elements by leveraging both header information and contextual content, navigating various log formats adeptly to capture crucial data nuances.
The process possesses the following inherent risks that need to be managed efficiently to achieve maximum savings in resources.
- ▪
The accuracy of the machine learning model is critical as any errors or biases in the training data could lead to inaccuracies in the extracted data. This should be mitigated at the outset by classifying the reports according to format and structure to enable streamlined training for the model.
- ▪
There is always a risk of errors or inconsistencies in the extracted data. As such, this process should be accompanied with manual review of the extracted data by geotechnical engineers / geologists. This should be performed as soon as the extracted data becomes available so that the errors or inconsistencies can be corrected in the model.
Manual extraction and digitisation of a borehole log took around 20 min. In Project Gatekeeper, the automated extraction tool required less than 2 min per log, depending on the volume of information contained on the page. The classification of reports took an average of not more than 2 min per log; however, this depends on the number of logs per report. Classification becomes more efficient with reports containing many logs and becomes less efficient with many reports containing few logs. Manual review of the extracted data, including the correction of discrepancies, took an average of 4 min per log. It was assumed that review of manually extracted data would still be required, albeit taking half the amount of time than that required to review the automated text extracted data. Ultimately, this method resulted in more than 64% labour costs savings for the data extraction task (Table 3).
Comparison of person hours spent between manual extraction and automated text extraction based on 784 logs
| Task | Manual retrieval and reprocessing of pertinent geotechnical data [h] | Automated retrieval and reprocessing of pertinent geotechnical data | |
|---|---|---|---|
| Extraction [h] | Review [h] | ||
| Classify reports | — | — | 26 |
| Extract data | 261 | 26 | — |
| Review extracted data | 26 | — | 52 |
| Total hours spent: | 287 | 104 | |
| Savings | — | 64% | |
Appendix 2 – Cost-efficiency of the semi-automated geotechnical reliability assessment
In Project Gatekeeper, a total of 81 historical site investigation reports in PDF files were supplied by the client to facilitate scoping of the geotechnical investigations. Using the automated text extraction tool, the data was quickly imported into the WebGIS and was then used by geotechnical professionals to conduct a semi-automated geotechnical reliability assessment. The total person hours required for the assessment is presented in Table 4, that is, a total of 74 h.
Semi-automated geotechnical reliability assessment person hours based on 81 historical site investigation reports
| Task | Hours |
|---|---|
| Develop reliability assessment framework | 2 |
| GIS scripting with Python and Esri Arcpy libraries | 1 |
| Run the automated part of the assessment | 0.08 |
| Geotechnical professionals read and analyse all project data in the WebGIS to estimate Geotechnical Design Parameters reliability and then key it in to complete the assessment | 71 |
| Subtotal: | 74 |
Based on resource data from other projects, the estimated person hours likely to be required by geotechnical professionals to conduct a conventional geotechnical reliability assessment of the same 81 historical site investigation reports is presented in Table 5, i.e., a total of 162 h. Therefore, the use of this semi-automated geotechnical reliability assessment in Project Gatekeeper saved approximately 54% of the person hours required for this task.
Conventional geotechnical reliability assessment estimated person hours based on 81 historical site investigation reports
| Task | Hours |
|---|---|
| Review the design drawings in CAD software | 20.25 |
| Review aerial photographs on proprietary spatial databases | 40.50 |
| Look at street-view on 360 camera footage | 20.25 |
| Review geological and topographical maps on public spatial databases | 40.50 |
| Geotechnical professionals read and analyse data in the PDF file to estimate its reliability and then write it down in a Word document | 40.50 |
| Subtotal: | 162.0 |

