

In 2022, the International Civil Aviation Organization (ICAO) introduced the Aircraft Classification Rating – Pavement Classification Rating (ACR-PCR) system, replacing the globally adopted Aircraft Classification Number – Pavement Classification Number (ACN-PCN) system for airfield pavement rating. This paper examines the performance of airfield rigid pavements using Federal Aviation Administration methodologies, analysing two airports with rigid pavements as case studies in the published literature. The study compares results from the ACR-PCR and ACN-PCN methods across 36 types of aircraft. The ACN and ACR values of various aircraft were calculated using different subgrade categories. For a single rigid pavement layer, varying thickness was considered to determine the PCN and PCR values. The results reveal that the ACN-PCN method produces more moderate outcomes than the ACR-PCR method. In addition, rigid pavement thickness significantly influences PCN values compared with PCR. These findings can assist airport administrators in preparing for the transition from the ACN-PCN system to the ACR-PCR system.
Introduction
Airfield pavement is an essential component of airport infrastructure (Sun et al., 2024), and its design is crucial for ensuring the safe operation of aircraft (White, 2018). As modern aircraft have grown heavier, the strength requirements for airfield pavement have increased accordingly. When airfield pavements deteriorate because of inadequate load-bearing capacity, extensive maintenance is often required, leading to disruptions in runway operations. Therefore, assessing the load capacity of airport pavement is crucial for ensuring the safety and efficiency of airport operations.
The airport construction industry has been using the Aircraft Classification Number - Pavement Classification Number (ACN-PCN) method – established by the International Civil Aviation Organization (ICAO) in 1981 – to measure the performance of airfield pavement. However, with advancements in aircraft and pavement technology, the ACN-PCN method has begun to reveal some limitations (Armeni and Loizos, 2022). This method relies on empirical techniques and does not incorporate the advanced pavement analysis theories developed over recent decades. These modern analysis methods have matured significantly in practice, highlighting the need to incorporate them into a new system for reporting airfield pavement performance. Therefore, the ICAO was scheduled to implement the Aircraft Classification Rating – Pavement Classification Rating (ACR-PCR) method in November 2024 (Sun et al., 2024).
ACR-PCR aligns with established pavement classification practices by focusing on the pavement’s structural load-bearing capacity. Like the ACN-PCN system it succeeds, ACR-PCR is essentially a standardised rating of a pavement’s bearing strength for unrestricted aircraft operations, rather than a holistic measure of pavement performance. This emphasis on structural capacity is consistent with international standards – such as those set by ICAO and Federal Aviation Administration (FAA) – that mandate uniform reporting of pavement strength. Accordingly, ACR-PCR complements, rather than replaces, other pavement evaluation metrics; it provides a unified strength classification, while separate indices, such as surface condition ratings, continue to assess overall pavement life cycle performance.
The ICAO has mandated a gradual transition to the comprehensive use of the ACR-PCR method, allowing for a transition period of approximately 2 years to address any emerging issues. Although both methods provide clear and detailed assessment steps, comparative analysis needs to be improved regarding their calculated results. Recent studies have analysed the performance of flexible pavements using both methods. One study indicated differences in the results of these methods in calculations for flexible pavements (Armeni and Loizos, 2022). Another study examined the correlations between specific discrepancies caused by these two methods, such as the relationship between the required cover layer thickness for calculating ACN and ACR values for a specific aircraft (Senseney and Sagisi, 2023).
In summary, it has been confirmed that the differing calculation methods of these two systems produce significantly different results, and currently, there is no recognised correlation between them. This lack of comparative analysis raises concerns among airport authorities and engineers. Furthermore, airports that do not have a basis for their current strength ratings or are unable to locate historical pavement composition and subgrade bearing strength data may face extremely high transition costs for upgrading or reconstructing pavements (White, 2021b).
The ACR-PCR method considers a broader range of factors, offering significant advantages in assessing pavements at large and complex airports, particularly major international ones in central cities. In addition, research indicates that these airports, which handle heavier aircraft and more frequent flights, often prefer rigid pavements because of their lower maintenance costs and longer service life (Wang et al., 2024; White, 2021a). Furthermore, the strength of materials used in rigid pavements has been continuously improved (Liu et al., 2022, 2023). Many researchers have highlighted the need for comparative analyses of rigid pavements to create a more comprehensive theoretical framework during the transition period for updating methods (Armeni and Loizos, 2022; de Castro and de Oliveira, 2024; Senseney and Sagisi, 2023).
Therefore, this paper examines the correlation between the ACN-PCN and ACR-PCR methods for rigid pavements through numerical analysis. This study enhances the understanding of the implications of the transition from ACN-PCN to ACR-PCR by analysing previously published literature on flexible pavements.
Methodology
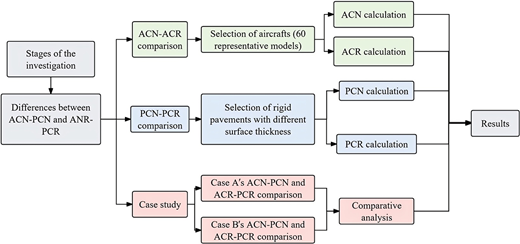
The research approach is illustrated in Figure 1, which compares the principles of the ACN-PCN and ACR-PCR methods. Sixty mainstream aircraft models were selected from the FAA database, and their ACN and ACR values were calculated. An airfield rigid pavement was chosen, and the PCN and PCR values were determined under various surface layer thickness conditions to investigate the correlation between the two methods. The two rating systems were applied to two rigid airfield pavements, providing insights into their effectiveness in real-world scenarios. Finally, ACN and ACR values for a broad range of aircraft were calculated, allowing for a comparison of the two methods in assessing airfield rigid pavements.
ACN-PCN method
The ACN-PCN method is a rating system used for airfield pavement management implemented by ICAO in 1981 (Sun et al., 2024).
ACN calculation
The ACN was a numerical value that indicated the relative impact of a specific aircraft type on the pavement structure, considering the aircraft’s weight and a specified standard subgrade strength. For rigid pavements, the first step in determining the ACN was to identify the standard support conditions. Rigid pavement subgrade conditions were categorised into four distinct categories, as detailed in Table 1.
Standard subgrade support conditions for rigid pavement ACN calculation
| Subgrade strength category | Subgrade support k-value | Represents | Code designation |
|---|---|---|---|
| High | 150 MN/m3 (552.6 pci) | k ≧ 120 MN/m3 (≧ 442 pci) | A |
| Medium | 80 MN/m3 (294.7 pci) | 60 MN/m3 < k < 120 MN/m3 (221 pci < k < 442 pci) | B |
| Low | 40 MN/m3 (147.4 pci) | 25 MN/m3 < k ≦ 60 MN/m3 (92 pci < k ≦ 221 pci) | C |
| Ultra Low | 20 MN/m3 (73.7 pci) | k ≦ 25 MN/m3 (k ≦ 92 pci) | D |
For rigid pavements, the ACN was determined using the Westergaard solution, which modelled a loaded elastic plate on a Winkler foundation under an interior load case scenario. This method assumed a concrete working stress of 2.75 MPa (399 psi). The process involved calculating the aircraft’s landing gear flotation requirements, where the derived single wheel load (DSWL) was treated as having equal stress distribution across the pavement structure. This calculation eliminated the need to specify pavement thickness by equating the thickness necessary for the landing gear with that required for a standard single wheel load at a tyre pressure of 1.25 MPa (181 psi). Consequently, the ACN was defined as twice the DSWL, expressed in kilograms.
PCN calculation
The PCN was a five-character code consisting of a number followed by four letters, indicating the bearing capacity of a pavement. The four letters in the code represented the pavement type, subgrade strength category, maximum allowable tyre pressure and evaluation method. The PCN value was determined by the allowable rated load value, as defined during pavement design, while also considering the frequency of operations. The ACN-PCN method allowed a pavement with a specific PCN value to support unlimited operations of aircraft with ACN values that are less than or equal to the PCN value, making it a practical and effective tool. However, the method for determining PCN is not standardised across airport authorities worldwide, as the ICAO has not issued guidelines for determining PCN values (Loizos et al., 2017). Consequently, the PCN determination procedure developed by the FAA has become widely adopted by many countries.
This study utilised the ACN-PCN method as published by the FAA. To standardise ACN calculations, FAA regulations specify that ACN values be determined based on a frequency of 10 000 coverages. For determining PCN values, the FAA introduced the concept of equivalent annual departures, which consolidates traffic mixtures into equivalent annual departures of one representative aircraft. To achieve this, the FAA employs the cumulative damage factor (CDF) concept (Sun et al., 2023), derived from Miner’s rule. This rule suggests that pavement damage is proportional to the number of applied load repetitions divided by the number of load applications before failure. The CDF represents the cumulative fatigue damage of the pavement under the repeated takeoff and landing cycles of various aircraft. It is calculated by determining, for each type of aircraft, the ratio of its actual usage on the pavement to the maximum allowable usage the pavement can sustain for that aircraft, and then summing the damage contributions of all aircraft to obtain the overall damage level of the pavement. When the CDF exceeds 1, it indicates that the pavement has surpassed its service life and requires repair or reconstruction. Consequently, to reflect the long-term bearing capacity of airport pavements, the PCN is defined such that the CDF of all anticipated aircraft, as computed in the process, does not exceed 1 – thereby ensuring that the pavement does not fail prematurely within its expected service life. It is crucial to note that in airfield pavement design and evaluation, load applications are considered from a coverage perspective. To streamline the procedures of the FAA method, the FAA developed a software programme called COMFAA 3.0, which assisted in the calculation of the ACN-PCN method.
ACR-PCR method
The construction logic of the ACR-PCR method closely resembled that of the ACN-PCN method. In this approach, the ACR was a unique number that represented the impact of an individual aircraft on various types of pavements. Factors affecting the ACN values included the aircraft’s weight, configuration (such as tyre pressure and gear geometry), the type of pavement (rigid or flexible), and subgrade strength.
Conversely, the PCR was a unique number that represented the pavement’s load-bearing capacity and was independent of specific aircraft parameters or details of the pavement structure. Within the same technical framework, a pavement with a specific PCR value could support the operation of aircraft with ACR values that are less than or equal to that PCR value. In addition, the classification of subgrade strength is illustrated in Table 2.
Standard subgrade condition for the ACR-PCR method
| Subgrade strength category | Subgrade support E (elastic modulus): MPa | Represents E (elastic modulus): MPa | Code designation |
|---|---|---|---|
| High | 200 | E ≥150 | A |
| Medium | 120 | 100 ≤ E < 150 | B |
| Low | 80 | 60 ≤ E < 100 | C |
| Ultra Low | 50 | E < 60 | D |
ACR calculation
Appendix 2 of the ICAO Aerodrome Design Manual Part 3: Pavements (ICAO, 2022) outlines the methods for determining ACR values. In this study, the calculation of ACR for rigid pavements followed the standardised methods prescribed by ICAO and the FAA. The calculation process utilised the layer elastic analysis (LEA) model to simulate the elastic response of pavement structures under different loading conditions. To determine the reference pavement thickness (t), the analysis began with pavement requirement data provided by the aircraft manufacturer, along with a standard concrete stress of 2.75 MPa (399 psi) and the elastic modulus (E-value) of the subgrade. The LEA model was essential in this process; it accurately simulated the stress distribution across the pavement layers under the applied loads. The relevant cross-sectional information is presented in Table 3.
The LEA model was used to identify stress evaluation points located at the bottom of the pavement layer, directly beneath each wheel. The pavement thickness was adjusted using the LEA model until the maximum horizontal stress at these evaluation points equalled 2.75 MPa (399 psi). Once the reference thickness was established, the DSWL was calculated for the selected subgrade under a constant tyre pressure of 1.50 MPa (218 psi). The magnitude of the single wheel load was then adjusted until the maximum horizontal stress at the bottom of the top layer equalled the standard concrete stress.
For lightweight aircraft, where the theoretical thickness required to achieve the maximum stress of 2.75 MPa (399 psi) was less than the minimum allowable thickness of 50.8 mm (2 in), the LEA model was employed in modified calculations to determine the DSWL. Finally, the ACR value was determined as twice the DSWL, expressed in hundreds of kilograms, and was rounded to the nearest multiple of ten for reporting purposes. The application of the LEA model ensured the scientific accuracy and reliability of the ACR determination process, providing a solid foundation for evaluating and designing rigid pavements.
PCR calculation
The ICAO allows member states to determine PCR values using their own methods. In this study, the calculation of PCR followed the methodology outlined by the FAA. First, the aircraft in the aircraft fleet that contributed the highest ACR to the pavement was identified. Next, the CDF for the entire aircraft mix was calculated using a damage/failure model consistent with the pavement design procedure. The aircraft with the highest contribution to the maximum CDF was selected as the critical aircraft, and all other aircraft were removed from the traffic list. The annual departures of the critical aircraft were then adjusted until the maximum CDF equalled the previously computed CDF for the entire mix. The adjusted annual departures were recorded, and the weight of the critical aircraft was modified to achieve a maximum CDF of 1.0 for the recorded number of annual departures. This determined the maximum allowable gross weight (MAGW) for the critical aircraft (FAA, 2022).
After the CDF for the entire aircraft mix is computed and the aircraft contributing most to pavement damage is identified, that aircraft is designated as the initial ‘critical aircraft’. All other aircrafts are then removed from the traffic list, and the critical aircraft’s departures are scaled until its damage alone equals the total CDF for the full mix. Next, the weight of this aircraft is increased until the pavement’s CDF reaches 1.0, defining its MAGW. The ACR at this MAGW serves as the candidate PCR for that iteration.
If this critical aircraft is already the one with the highest ACR in the mix, the process concludes. Otherwise, the critical aircraft is removed from consideration, and the CDF is recalculated for the remaining aircraft to identify a new critical aircraft. By repeating the steps of equivalent-departure scaling and MAGW adjustment, additional candidate PCR values are obtained. Once no aircraft in the mix demands a higher rating, the pavement’s PCR is finalised as the maximum of all candidate values. This approach ensures that both high-frequency damage contributors and heavier single-load demands are accommodated, preventing either factor from unduly governing the pavement rating.
Difference between ACN-PCN and ACR-PCR method
The differences between the ACN-PCN and ACR-PCR methods for assessing rigid airport pavement have been analysed, focusing on their applicability to modern aircraft and complex pavement conditions. The ACN-PCN method used subgrade support k-values (pci, MN/m3) to represent subgrade strength, while the ACR-PCR method utilised elastic modulus E-values (psi, MPa). The use of k-values in the ACN-PCN method provided a straightforward approach to evaluating subgrade strength because of traditional practices. In contrast, the ACR-PCR method’s reliance on E-values allowed for a more detailed and accurate assessment of subgrade stiffness, which was crucial for understanding pavement performance under varying aircraft loads. This approach better accommodated modern aircraft designs that exerted different stresses on pavement structures and aligned well with certain modelling methods (Patil et al., 2013).
Regarding stress calculation, the ACN-PCN method was based on the Westergaard solution (Wesołowski and Blacha, 2014), which assumed a concrete working stress of 2.75 MPa (399 psi) and a standard tyre pressure of 1.25 MPa (181 psi). This method simplified the analysis by utilising established parameters, making it easier to implement. In contrast, the ACR-PCR method employed the LEA model (Alves and Fontul, 2024), which accounted for the complexity of multi-layer pavement structures and adjusted for a higher tyre pressure of 1.50 MPa (218 psi). The LEA model’s advantage lay in its ability to simulate real-world conditions more accurately, particularly for pavements subjected to the heavy loads of modern aircraft. This resulted in a more precise determination of pavement stress distribution, enhancing the reliability of pavement design and maintenance decisions.
Concerning pavement thickness, the ACN-PCN method did not require specifying pavement thickness. Instead, it derived the ACN value by comparing the stress from a single wheel load to that of the actual aircraft. While this practical approach is useful for general applications, it may overlook specific structural details that could influence pavement performance. Conversely, the ACR-PCR method required detailed input on pavement layer thicknesses and a minimum allowable concrete layer thickness of 50.8 mm (2 in). This requirement ensured the pavement structure was adequately designed to support the anticipated loads, particularly for lightweight aircraft where the theoretical thickness might fall below the minimum allowable. In such cases, the calculation method was adjusted to derive a modified DSWL. By considering these details, the ACR-PCR method provided a more robust and comprehensive evaluation of pavement strength, ensuring long-term durability and safety.
Overall, while the ACN-PCN method is widely adopted, it relies on traditional design assumptions that may not fully meet the demands of contemporary aircraft and complex subgrade conditions. In contrast, the ACR-PCR method offers a more precise evaluation of pavement strength through advanced analytical tools and modern assumptions. This precision is especially beneficial in scenarios involving high loads and complex subgrade conditions, making the ACR-PCR method a more suitable choice for modern airfield pavement management. It is anticipated that the enhanced accuracy of the ACR-PCR method will lead to better-informed decisions regarding pavement design, maintenance and rehabilitation, ultimately contributing to safer and more cost-effective airport operations.
Results and discussion
ACN-PCN comparison
A sample of 60 representative aircraft from the aviation industry was selected from the FAA database to explore the potential relationship between ACN and ACR. The ACN values of the aircraft were calculated using FAA’s COMFAA 3.0 pavement calculation tool under four subgrade strength categories: A, B, C and D. The same aircraft types were then assigned identical parameters, including gross taxi weight and tyre pressure, to calculate their ACR values in the airport design software FAARFIELD 2.1. Figure 2 illustrates the numerical relationship between ACN and ACR values for aircraft of the same model and parameters under identical subgrade category conditions. Furthermore, the linear relationship between ACN and ACR values was determined for each subgrade condition. The results revealed a strong linear correlation between ACN and ACR values at the same subgrade strength level, including R2 values ranging from 0.95 to 0.99. Notably, this linear relationship becomes even stronger as the subgrade strength decreases.
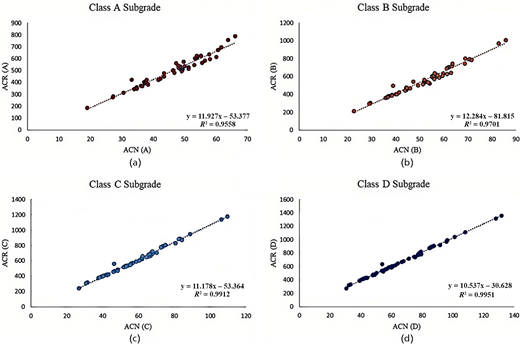
Numerical relationship between ACN and ACR for subgrade category: (a) A, (b) B, (c) C and (d) D
Numerical relationship between ACN and ACR for subgrade category: (a) A, (b) B, (c) C and (d) D
PCN-PCR comparison
The thickness of the rigid pavement surface layer significantly affected the pavement’s bearing capacity and service life. Therefore, typical rigid airfield pavement cross-sections were designed, varying the surface layer thicknesses as shown in Table 4. By calculating the PCN and PCR values for pavements with different surface thicknesses under the same subgrade and base conditions, the relationship between PCN and PCR was investigated. The aircraft traffic mix used to calculate PCN and PCR is listed in Tables 4 and 5, along with relevant information sourced from the FAA’s aircraft library.
Pavement cross-section used for PCN-PCR comparison
| P501 PCC surface | 370, 375, 380, 385, 390, 395, 400, 410, 420 mm thickness |
|---|---|
| P-304 cement-treated upper base | 200 mm thickness |
| P-304 cement-treated lower base | 200 mm thickness |
| Subgrade | k = 46.2 MN/m3 |
Aircraft fleet for PCN-PCR comparison
| Aircraft | Annualdepartures | Gross taxiweight: kg | Tyrepressure: kPa |
|---|---|---|---|
| B737-300 | 523 | 63 503 | 1385.85 |
| B737-700 | 468 | 70 307 | 1358.27 |
| B737-800 | 10 628 | 79 242 | 1406.53 |
| A319-100 std | 1054 | 64 400 | 1192.79 |
| A321-200 std | 2626 | 89 400 | 1461.69 |
| A320-200 twin std | 6322 | 73 900 | 1378.95 |
By calculating the PCN and PCR values of pavements with different surface layer thicknesses, it was observed that both values increased linearly with greater thickness. Specifically, for every 10 mm increase in the thickness of the P-501 PCC surface, the PCR value increased by approximately ten units, while the PCN value increased by two to three units. The trend lines of the scatter plots for both reveal that the slope of the PCN method was steeper than that of the PCR trend line. This indicates that the ACN-PCN method was slightly more sensitive to the surface layer thickness of rigid pavement. The R2 value approaching 1 (see Figure 3) confirms that surface layer thickness was a critical factor in the calculation of both PCN and PCR for rigid pavements.
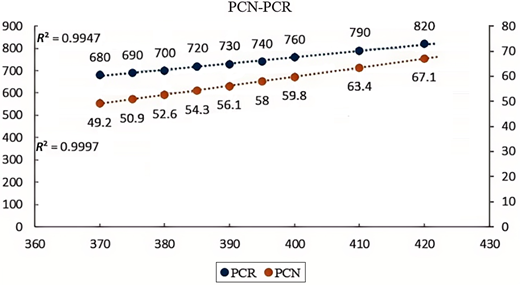
Comparison of PCN and PCR values for different rigid pavement surface thicknesses
Comparison of PCN and PCR values for different rigid pavement surface thicknesses
Case study analysis
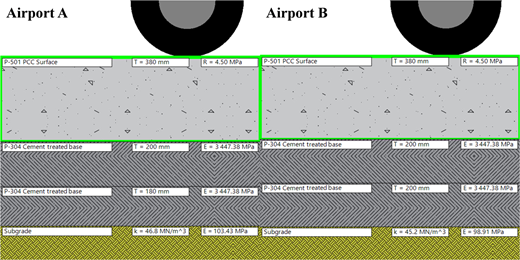
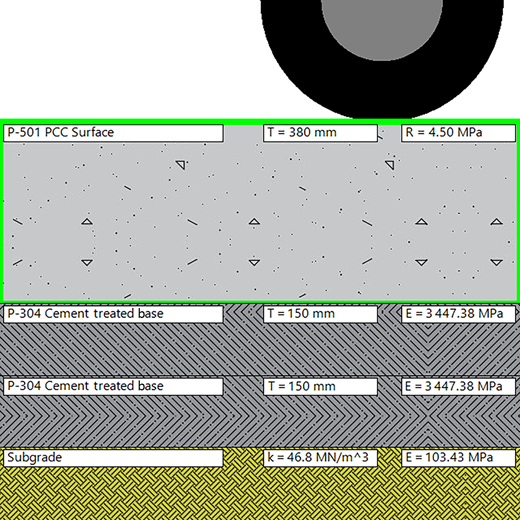
To evaluate the impact of the updated ACR-PCR system on the reporting of rigid pavements at actual airports, rigid runway pavements of two 4D international regional airports, located in a central-southern province (indicated as Airport A) and an eastern coastal province of China (Airport B), were selected for the application of these methods. Pavement information data, including the number of layers, composition materials and subgrade elastic moduli (see Figure 4), as well as traffic volume data, including aircraft models and annual departures (see Table 6). The rigid pavement runway designs for Airports A and B are based on the ‘Specifications for Airport Cement Concrete Pavement MH/T5004-2010’ (CAAC, 2010) from China. According to these specifications, the concrete slab thickness for pavements in airfield area class II-C, II-D, II-E and II-F must be at least 240 mm. For 4D-class airports, the typical concrete pavement thickness is designed to be 380 mm. Consequently, the surface layers at the two airports are quite similar, and the materials used for the upper and lower base layers are also cement treated. The primary differences in the data analysed between the two airports lie in the base layer thickness, subgrade properties and traffic volume data. Regarding materials, the specifications for each pavement structure layer are closely aligned with the requirements for standard rigid pavements. Therefore, they were converted into the standard rigid pavement cross-sections shown in the Figure 4, following FAA procedures.
Case study of airport traffic data
| Airport | Aircraft | Annualdepartures | Gross taxiweight: kg | Tyrepressure:kPa |
|---|---|---|---|---|
| A | A319-100 std | 603 | 64 400 | 1192.79 |
| A320-200 std | 2994 | 73 900 | 1378.95 | |
| A321-200 std | 1065 | 89 400 | 1461.69 | |
| B737-300 | 658 | 65 503 | 1385.85 | |
| ERJ-190(A318-100 std) | 638 | 56 400 | 1310 | |
| ERJ-135 | 145 | 19 100 | 923.9 | |
| CRJ700 | 287 | 33 112 | 979.06 | |
| B | B737-800 | 2855 | 79 242 | 1406.53 |
| A321-200 std | 415 | 89 400 | 1461.69 | |
| ARJ21 (CRJ900) | 57 | 38 555 | 1116.95 | |
| A320-200 std | 6951 | 73 900 | 1378.95 | |
| A320 neo | 637 | 70 400 | 1220.37 |
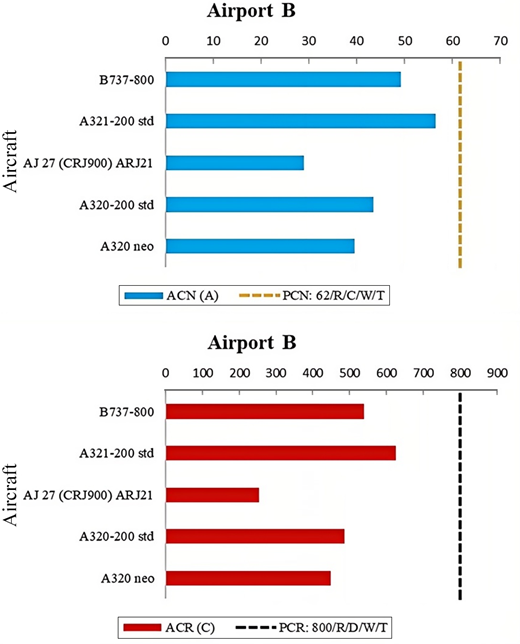
The subgrade k-values for the two runways are 46.8 and 45.2 MN/m3, respectively. According to the ACN-PCN method, these subgrades are classified as Category C, while the ACR-PCR method categorises them as Category D subgrades. Owing to the converted pavement information and the traffic volume data, COMFAA 3.0 determined that the PCN for Airport A’s pavement is 65/R/C/W/T, whereas for Airport B, it is 62/R/C/W/T. In addition, using FAARFIELD 2.1 and the technical evaluation procedures outlined in AC 5335-5D, the PCR for Airport A and Airport B was calculated to be 730/R/D/W/T and 800/R/D/W/T, respectively.
Figure 5 illustrates the relationship between the various indicator values calculated using the ACN-PCN and ACR-PCR methods for Airport A, based on the runway pavement and its traffic volume information. From Figure 5, it is evident that, regardless of the evaluation method used, the runway at Airport A can safely accommodate the load of each departing aircraft without the risk of overloading. This confirms that the pavement operates within a safe range. However, the comparison of values in Figure 5 indicates that the margins of safety between the ACR values of all aircraft and the pavement’s PCR values under the ACR-PCR evaluation method are slightly more generous than those between the ACN values and the pavement’s PCN values under the ACN-PCN evaluation method.
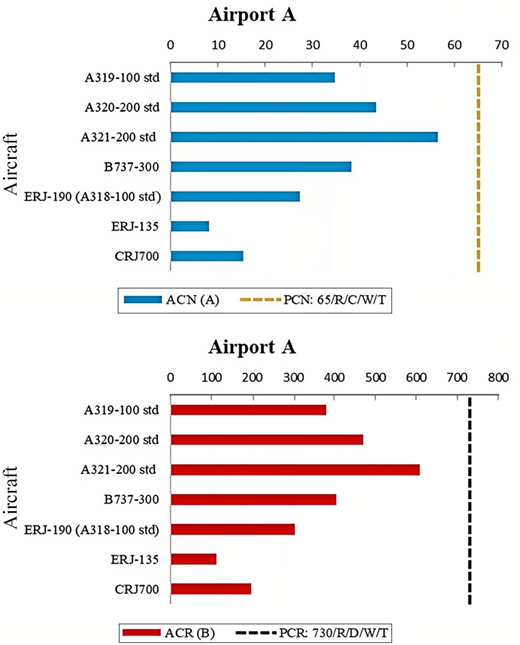
Figure 6 shows the numerical relationships of various metrics calculated for Airport B using two different methods. From Figure 6, the pavement design of Airport B can also accommodate the operation of various aircraft models under both assessment methods. Furthermore, the results of the ACN-PCN method are more moderate than the results calculated from the ACR-PCR method.
Adapting ACR-PCR method
The surface thickness of rigid pavements is crucial in assessment outcomes and – given the high costs associated with these surfaces – it is essential to explore methods that can reduce expenses. From the case studies of Airports A and B, it is evident that the ACR-PCR method is more cost-effective than the ACN-PCN method. However, a more comprehensive analysis of the variations in both methods is needed to reach more accurate conclusions.
Data on expected traffic for a strategically important regional airport in South-east Europe were obtained (Armeni and Loizos, 2022), as illustrated in Table 7. Using the data, a typical rigid pavement was designed that complies with FAA specifications and meets the requirements for aircraft takeoff under the ACR-PCR assessment method, despite having low bearing capacity. The pavement structure is displayed in Figure 7.
Acclimation assessment expected traffic data (Armeni and Loizos, 2022)
| Aircraft | Annualdepartures | Gross taxiweight: kg | Tyrepressure: kPa |
|---|---|---|---|
| B737-300 | 1522 | 63 503 | 1385.85 |
| B737-700 | 3520 | 70 307 | 1358.27 |
| B737-800 | 15 232 | 79 242 | 1406.53 |
| A319-100 std | 5522 | 64 400 | 1192.79 |
| A321-200 std | 3251 | 89 400 | 1461.69 |
| A320-200 twin std | 19 583 | 73 900 | 1378.95 |
Cross-section of runway pavement at airport for acclimation assessment (Armeni and Loizos, 2022)
Cross-section of runway pavement at airport for acclimation assessment (Armeni and Loizos, 2022)
The assessment results and their numerical relationships, obtained using the ACN-PCN and ACR-PCR methods, are presented in Figure 8. From Figure 8, it is evident that under the ACR-PCR assessment method, the pavement conditions meet the operation requirements for all aircraft models. However, under the ACN-PCN assessment, the pavement conditions do not meet the operation requirements for the B737-800 and A321-200 standard models, both of which are heavy aircraft with gross taxi weights exceeding 75 tonnes.
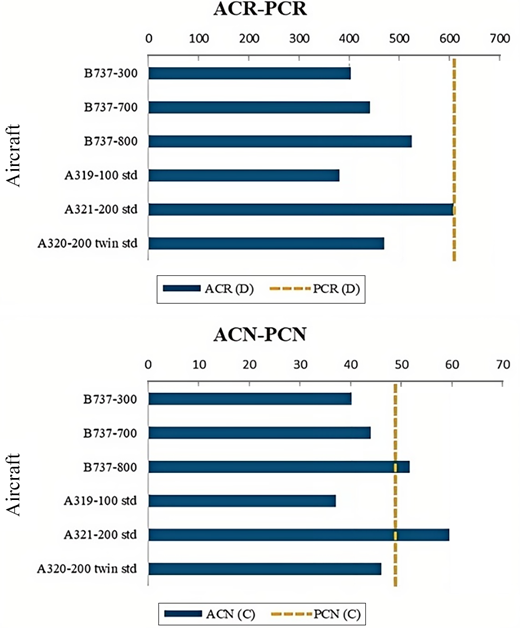
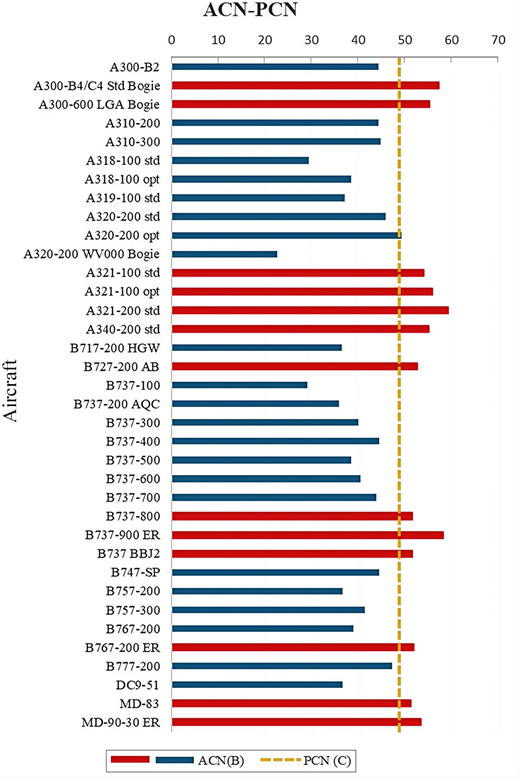
Under the specified pavement conditions (with a PCN of 49 and a PCR of 610), the ACR values of over 90 widely used aircraft models from the FAA database were calculated. Among these, 36 models had ACR values lower than the pavement’s PCR value, indicating that this pavement can support the operations of these 36 aircraft models according to the ACR-PCR method. The results are illustrated in Figure 9.
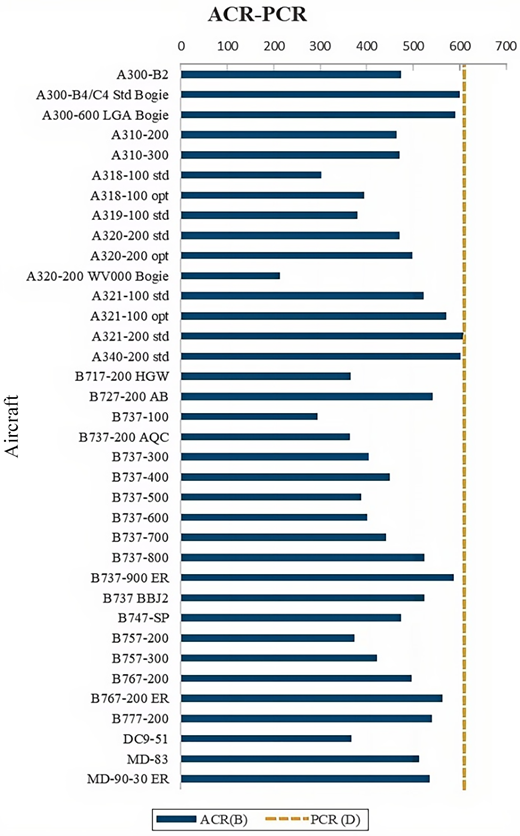
For these 36 aircraft models, uniform parameters such as gross taxi weight and tyre pressure were set, and the ACN-PCN method was adopted. The results, shown in Figure 10, reveal that 13 of these models exceeded the pavement’s PCN limit. Although all the 36 aircraft models meet the operational requirements outlined by the ACR-PCR method for the airfield’s rigid pavement (refer to Figure 7), 13 of them exceeded the pavement’s operational conditions assessed by the ACN-PCN method. This suggests that the ACN-PCN method yields more conservative results compared with the ACR-PCR method. These findings are further supported by case studies and a comprehensive analysis of the 36 aircraft types. In addition, the outcomes align with conclusions from related studies on airfield flexible pavements (Armeni and Loizos, 2022; de Castro and de Oliveira, 2024; Senseney and Sagisi, 2023; Sun et al., 2025).
Conclusions
The ICAO recommends implementing the ACR-PCR assessment method in November 2024, replacing the previous ACN-PCN method. Relevant literature on flexible airfield pavements indicates that pavements assessed under the ACN-PCN method can still perform adequately within the ACR-PCR framework. This alleviates airport operators’ concerns about needing immediate adjustments caused by the implementation of the new system. This paper analysed the performance of airfield rigid pavement through a detailed comparative analysis of both the ACN-PCN and ACR-PCR methods. The results highlight the benefits of the ACR-PCR method, including more precise assessments of pavement life. The following conclusions have been observed:
For the same aircraft models, there is a linear relationship between ACN and ACR values across four subgrade strength categories, including R2 values ranging from 0.95 to 0.99.
The surface layer thickness of rigid pavement significantly affects the results of both assessment methods. Changes in surface thickness influence the PCN more sensitively than the PCR.
Both assessment methods were applied to evaluate two airports with rigid pavements. It was found that the ACR-PCR method is equally applicable for assessing these pavements without conflicting with the previous ACN-PCN method. The results indicate that the ACR-PCR method provides acceptable assessment results.
The analysis involving 36 different aircraft models indicates that the ACN-PCN method yields more moderate results compared with the ACR-PCR method.
Author’s contributions
All authors contributed to the study conception and design. The first draft of the manuscript was written by Yupeng Zhang, who performed the literature search, investigation, methodology and writing-original draft. The funding acquisition, project administration, resource, supervision, writing-review and editing were done by Junyu Sun. The writing-review and editing were done by Zeping Yang. The conceptualisation, supervision, writing-review and editing were performed by Erwin Oh. The supervision and writing-review were performed by Gary Chai. The supervision was overseen by Dominic E.L. Ong. The resource and supervision were provided by Phil Bell.
Acknowledgements
The authors gratefully acknowledge the valuable suggestions and support provided by the relevant staff at Griffith University and China University of Mining and Technology. We also extend our sincere appreciation to the Airport Consultancy Group (ACG), Australia, for their technical guidance.
