Geosynthetic reinforcement has been increasingly used over voids or piles in soft soil to support embankments and minimise differential settlement. Due to differential settlement, soil arching is formed and less pressure is applied onto the reinforcement. This problem is often simulated using trapdoor tests. The reinforcement effect on displacement and soil arching has not been fully understood. In real applications, multiple voids or multiple spans of piles exist under embankments. The effects of multiple voids or spans of piles on displacement and soil arching have not been well investigated. This paper reports a series of two-dimensional trapdoor tests conducted to investigate soil displacements above single and double trapdoors without or with reinforcement. Analogical soil, made of aluminium bars, was used as embankment fill. Paper was used as reinforcement. Two different embankment heights were investigated. The experimental tests showed that both embankment height and reinforcement reduced the vertical displacement on the top of the embankment, and higher embankment caused more soil failure at the edge of the stationary support but reduced the vertical stress on the reinforcement. The maximum tensile strain happened at the edges of the trapdoor. Trapdoors spaced at twice the trapdoor width did not cause much interaction between each other.
Notation
Introduction
Geosynthetics have been successfully used in pile-supported embankments as a basal reinforcement to improve the load transfer mechanism to the piles (Han, 2015). This construction technique has been referred to as the geosynthetic-reinforced pile-supported (GRPS) embankments technique (Han and Gabr, 2002). GRPS embankments are an economic and effective solution to solve total and differential settlement problems encountered in the construction of earth structures over a compressible soil when limited construction time is available and limited deformation is permissible (Han and Gabr, 2002). Reid and Buchanan (1984) reported the early construction of a GRPS embankment using a single layer of geomembrane for a bridge approach embankment in Scotland in 1983. The geosynthetic reinforcement helped minimise the differential settlement and prevented the formation of a bump between the embankment and the bridge. The success of the earlier projects led to a widespread use of GRPS embankments in Europe, the USA, Asia, Australia and South America (e.g. Almeida et al., 2007; Chen et al., 2008; Filz et al., 2012; Han and Gabr, 2002; King et al., 2017; Van Eekelen et al., 2003).
This construction technique is equally useful for addressing the challenges posed by existing large sinkholes using piles under a proposed highway alignment (Wang et al., 2009). Geosynthetic reinforcement has also been used to bridge over voids without piles (e.g. Giroud et al., 1990; Villard et al., 2000).
In both applications discussed earlier, geosynthetic reinforcement is used to support embankments and minimise differential settlement. Soil arching and the tension in the geosynthetic caused by the differential settlement are the key mechanisms for load transfer in the system. At a macroscopic scale, soil arching is the transfer of stress from a yielding area onto adjoining stationary support areas through the development of shear stresses in the soil. This concept was proposed by Terzaghi (1936) based on his observation in a trapdoor experiment. In Terzaghi’s study, a trapdoor (73 mm wide and 463 mm long) was mounted on the base of a bin containing a layer of sand of approximately 310 mm thick. The test results indicated that the shear stress induced by soil arching increased with an increase in the displacement. When the soil layer was thick enough, a plane of equal settlement developed at the height of 1·5–2·5 times the width of the trapdoor. The pressure on the trapdoor became constant when the displacement reached 10% the width of the trapdoor.
McNulty (1965) performed similar trapdoor experiments in an axisymmetric arrangement. In addition to the self-weight of sand, air pressure was applied on the surface of the dry sand over the trapdoor. These results indicated that with an axisymmetric arrangement, a lower height of the plane of equal settlement was required. The height of the plane of equal settlement varied between 1·0 and 1·5 times the diameter of the trapdoor. No soil arching or reduction of vertical stresses above this plane was observed. Also, the pressure on the trapdoor became constant at a lower percentage (approximately 3%) of trapdoor displacement. McNulty (1965) defined a soil arching ratio as the ratio of the pressure on the trapdoor to that far away from the trapdoor (equal to an overburden stress), and he found that the soil arching ratio decreased with an increase of the ratio of the fill thickness (H) to the trapdoor diameter (B). In many geotechnical engineering applications, soil arching is a ubiquitous phenomenon and has been studied for the past eight decades since Terzaghi (1936).
Jenck et al. (2007) conducted two-dimensional (2D) physical and numerical modelling of a pile-supported earth platform over soft soil. In the study by Jenck et al. (2007), a soft and compressible foam was used to allow the development of differential settlement between piles, and an analogical soil of steel rods was used as the backfill. This study concluded that the backfill shear strength had the most important influence on the load transfer onto the piles and the surface settlement reduction. Bhandari (2010) investigated the development of soil arching and the effects of geosynthetic reinforcement and cyclic loading on soil arching using 2D physical models and the discrete element method (DEM). Van Eekelen et al. (2012) conducted three-dimensional (3D) physical model tests in laboratory to investigate the load transfer in geosynthetic-reinforced pile-supported embankments. Through these tests, Van Eekelen et al. (2012) suggested the distribution of the vertical load in three parts: PA (arching) directly to the piles, PB by way of the geosynthetic reinforcement to the piles and PC to the soft subsoil between the piles. Iglesia et al. (2014) conducted centrifuge tests to investigate the evolution of soil arching with the displacement of the trapdoor and proposed a ground reaction curve (GRC), which is divided into four stages: initial soil arching, maximum soil arching (i.e. the minimum stress on the trapdoor), stress recovery and ultimate state. Han et al. (2017) simplified the GRC into three linear lines and found that Terzaghi’s solution (Terzaghi, 1943) predicted the ultimate state well at the trapdoor displacement equal to 10% the trapdoor width. Rui et al. (2016) investigated the evolution of soil arching in sand using 2D physical models and found that the patterns of soil arching depended on fill height, trapdoor width and trapdoor displacement. Al-Naddaf et al. (2017) investigated the stability of soil arching under surface loading using trapdoor model tests. They found that soil arching degraded during localised surface loading.
Soil arching can also be studied at microscale using photoelastic discrete simulation (PDS) and or the DEM simulation. To observe the soil arching at a microlevel, PDSs were successfully used in a laboratory (Tien, 2001). Tien (2001) concluded that soil arching develops at a small movement (2 mm) of the trapdoor, and particle translations contribute to the soil arching formation more than particle rotations. Han et al. (2012) conducted DEM analysis of stresses and deformations of geogrid-reinforced embankments over piles and found that the coefficient of lateral earth pressure within the embankment fill at the middle of the pile span varied from the coefficient at rest to that of passive earth pressure with the development of soil arching.
In addition to soil arching, there have been a few studies on the tensioned membrane effect by geosynthetic reinforcement. For example, Giroud et al. (1990) developed a theoretical solution for estimating the tension in geosynthetic reinforcement over voids subjected to fill loading. Han and Gabr (2002) found that the maximum tension in single geosynthetic reinforcement above pile caps developed at the edges of pile caps. Shen et al. (2018) found that the maximum tensile forces occurred at the corners of the square pile caps, followed by those at the edges of the pile caps, and the tensile force–strain compatibility method reasonably estimated the measured maximum tensile forces at the edges of the pile caps.
Most of the studies discussed above used a single trapdoor or a unit cell of pile arrangements to investigate displacement, soil arching and tensioned membrane. In real applications, however, multiple voids may exist, or multiple spans of piles exist under embankments. The effects of multiple voids or spans of piles on displacement, soil arching and tensioned membrane have not been well investigated. Even though there have been some studies on the effect of geosynthetic reinforcement on soil arching and fill displacements, its effect, particularly under multiple trapdoor conditions, has not been fully understood.
This paper presents a series of 2D trapdoor tests conducted to investigate soil displacements above single and double trapdoors without or with reinforcement. Analogical soil, made of aluminium bars of three diameters, was used as embankment fill. Unreinforced and reinforced embankments with two different embankment heights were investigated. Paper was used as geosynthetic reinforcement. Embankment displacements and reinforcement strains were monitored during displacements of the trapdoor(s).
Material properties
Analogical soil
The behaviour of granular media is often studied using 2D analogical soil in model tests (Jenck et al., 2007; Matsuoka and Yamamoto, 1994; Misra and Jiang, 1997; Shahin et al., 2004). In this approach, biaxial experiments with differently sized rods are conducted to determine the properties of granular materials. The calibration of these biaxial experiments results in the determination of the relevant parameters that can be used for the numerical simulations of different geotechnical problems. For example, Shahin et al. (2004) and Jenck et al. (2007) reported the biaxial tests along with the calibrations to determine the parameters for the continuum-based numerical simulations.
Biaxial tests were conducted by Shahin et al. (2004) on aluminium bars with two diameters of 1·6 and 3·0 mm mixed at a ratio of 3:2. Shahin et al. (2004) found that the friction angle of analogical soil formed by aluminium bars was approximately 23°. The aluminium bars used in this study had three diameters: 5·6, 12·7 and 19·0 mm. The gravimetric composition in the mix of the 5·6, 12·7 and 19·0 mm dia. bars were 81, 10 and 9%, respectively. The unit weight of the fill was approximately 20·6 kN/m3. It is expected that the properties of the analogical soil used in this study were similar to those in the Shahin et al. (2004) study.
Paper reinforcement
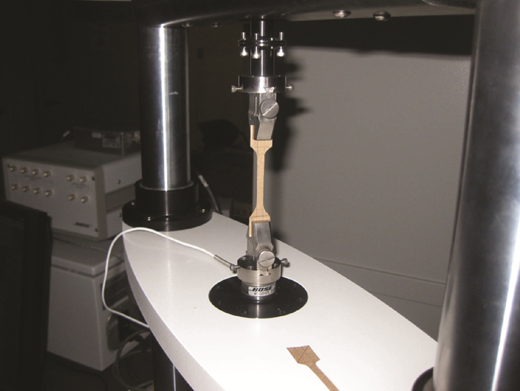
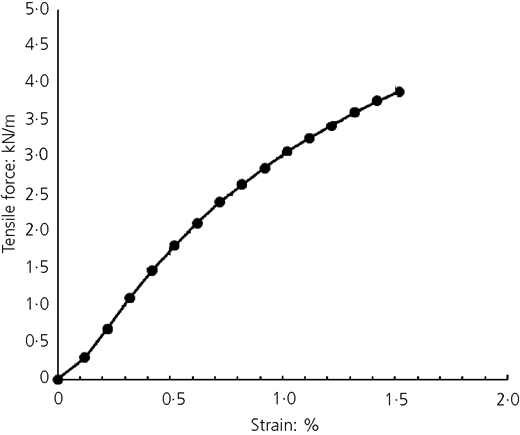
Paper was used as a reinforcement in the trapdoor experiment due to the reduced scale. Tension tests of the paper were conducted using the ElectroForce machine (Figure 1). Four specimens were prepared from two locations of the paper. In each test, a paper specimen of 5 mm wide and 50 mm long was subjected to a monotonically increasing load at a displacement rate of 1 mm/min. Throughout the test, the load and the displacement were recorded using a data logger. The machine was programmed to scan the data at every 5 s. In each scan, 30 data points were recorded. The tests were terminated on the tensile failure of the specimens. Figure 2 shows the average tensile force plotted against the strain.
Equipment design and test procedure
Figure 3 shows a model for the trapdoor experiment. The model was 900 mm long, 50 mm wide and 350 mm high. The model was fabricated with an aluminium frame and poly(methyl methacrylate) (PMMA) on its front and rear walls. The transparent PMMA allowed visual observations and pictorial records for further analysis. The model was equipped with seven wooden blocks (127 mm wide), which are moveable as trapdoors independent of each other. Hereafter in this paper, these wooden blocks are referred to as trapdoors and the trapdoors are numbered from one to seven.
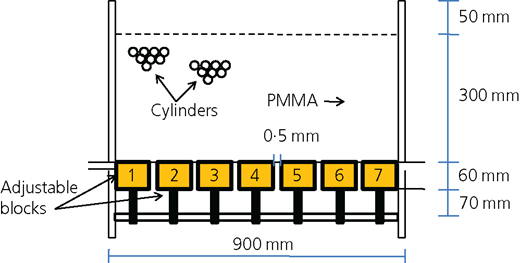
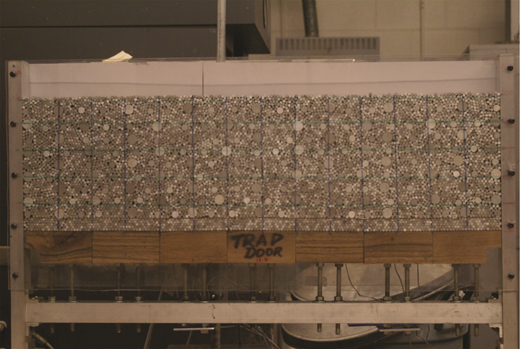
On top of the trapdoors, analogical soil (aluminium bars) was filled. The aluminium bars were placed manually. First, the larger-diameter bars were placed as desired to obtain the required gradation; the gaps between the larger-diameter bars would then be filled using the smaller-diameter bars. There was a small gap between the aluminium bars and the PMMA; therefore, there was no vertical friction issue. Different heights of embankments (H/B = 1·4 and H/B = 2·0) were prepared in this study. The embankment height-to-trapdoor width ratio of 1·4 was selected based on the recommendation by BSI (2010) for the full mobilisation of soil arching and equal settlement plane. For the reinforced cases, paper reinforcement was placed at a height of 25 mm above the trapdoor to support the embankment. Due to the limited space, large particles (12·7 and 19 mm) would generate non-uniform contact between reinforcement and underlying soil; therefore, 5·6 mm dia. aluminium bars were used as fill between the paper reinforcement and the trapdoor. Strain gauges were glued on the paper reinforcement to measure the strains along the paper. The trapdoor was lowered down manually by approximately 2 mm for each movement. A digital-still camera was used to take the picture of the model at each stage of the trapdoor movement. These pictures were analysed using Autocad software to measure the positions and displacements of aluminium bars at the predefined locations. Suitable grids were drawn on the model to aid this image analysis process (Figure 4). Based on the image analysis, the initial porosity of the fill was approximately 0·16. The automatic data acquisition system was used to record the displacements of the trapdoor and the strains in the reinforcement whenever paper reinforcement was used. The details of the experiments are provided in Table 1.
Experimental results
For the unreinforced embankments, the displacement measurements are presented. For the reinforced embankments, the displacement and strain measurements of the trapdoor experiments are presented. In most of the experiments, only the maximum vertical displacements were measured. For the trapdoor tests of soil arching interactions, the displacement profiles were also measured.
Unreinforced embankments
Unreinforced embankments of two heights (185 and 260 mm), which correspond to H/B = 1·4 and 2·0, were constructed. The displacements in the embankments at different stages of trapdoor number 4 displacement were analysed using the Autocad software. First, the picture of the embankment taken before lowering the trapdoor was imported to the Autocad, and the grids were drawn in the same pattern as were marked in the picture to create a template file. The pictures taken during subsequent trapdoor displacements were imported into the template file. The measurement of the perpendicular distances between the template grids and the picture grids obtained the displacements at different heights in the embankment. Note that a minimum displacement of 0·5 mm could be adequately measured using this technique. Any displacement smaller than 0·5 mm was difficult to be accurately measured but insignificant for this particular problem involving large displacements in the embankment.
Figures 5 and 6 show the maximum vertical displacements in the embankments of the H/B ratios at 1·4 and 2·0, respectively. For the embankment of the H/B ratio at 1·4, the vertical displacements of the aluminium bars were measureable above the central trapdoor (number 4) throughout the embankment height even at a 2 mm displacement of the trapdoor. For the embankment of the H/B ratio at 2·0, the vertical displacements of the aluminium bars were measureable below a height of 200 mm at a 2 mm displacement of the trapdoor. No displacement of the aluminium bars was measured at the top of the embankment at a 2 mm displacement of the trapdoor. The vertical displacement at the top of the embankment slowly increased with an increase of the trapdoor displacement until the trapdoor was lowered by 10 mm. After the 10 mm displacement of the trapdoor, the vertical displacement at the top of the embankment increased rapidly. For the given trapdoor displacement, the maximum vertical displacements at the top of the embankment were smaller for the embankment with the H/B ratio at 2·0 than those for the embankment with the H/B ratio at 1·4. Both Figures 5 and 6 show that within the height of 40% the trapdoor width (i.e. 55 mm), the displacement in the fill was almost the same as that in the trapdoor. These figures also show that at the same height of the fill (e.g. 105 mm), the displacements for the H/B ratio at 2·0 were smaller than those for the H/B ratio at 1·4. This comparison indicates that the embankment with the H/B ratio at 2·0 had more stable soil arching than that with the H/B ratio at 1·4. At the maximum trapdoor displacement, the displacements at the top of the embankments was approximately 44% for the H/B ratio at 1·4 but 30% for the H/B ratio at 2·0; therefore, an increase of the embankment height reduced the displacement reflected to the top of the embankment. However, Han et al. (2017) found that the ultimate soil arching happened at the trapdoor displacement equal to approximately 10% the trapdoor width – that is, 13 mm. At this trapdoor displacement, the displacements at the top of the embankments were approximately 42% for the H/B ratio at 1·4 but 20% for the H/B ratio at 2·0.
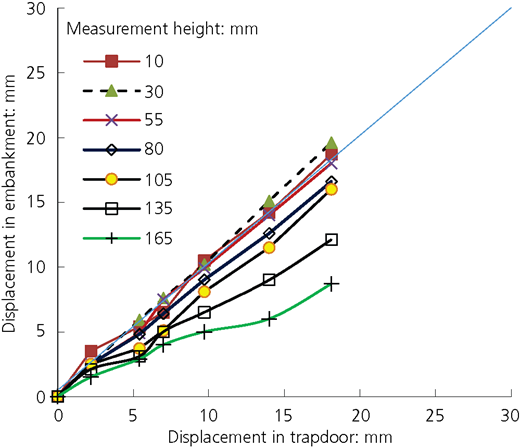
Maximum vertical displacement in the unreinforced embankment plotted against displacement of trapdoor number 4 (H/B = 1·4)
Maximum vertical displacement in the unreinforced embankment plotted against displacement of trapdoor number 4 (H/B = 1·4)
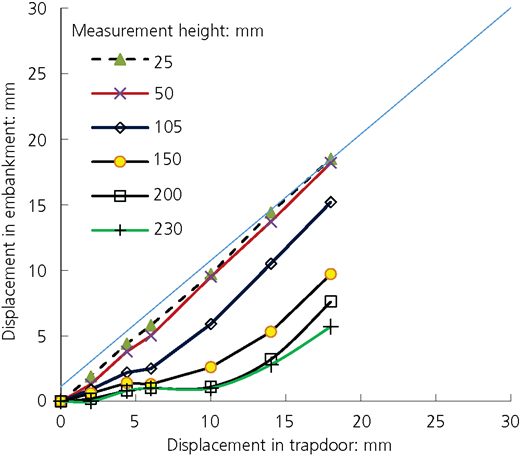
Maximum vertical displacement in the unreinforced embankment plotted against displacement of trapdoor number 4 (H/B = 2·0)
Maximum vertical displacement in the unreinforced embankment plotted against displacement of trapdoor number 4 (H/B = 2·0)
Reinforced embankments
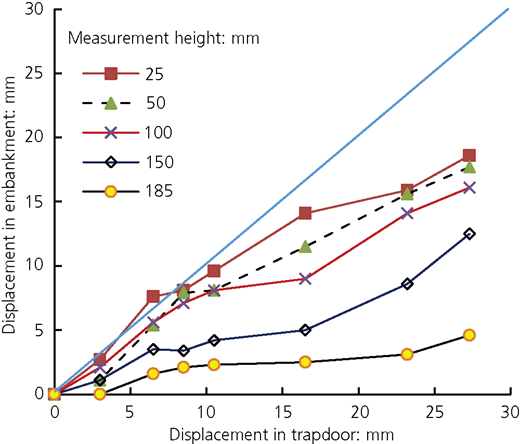
Reinforced embankments of two heights (185 and 260 mm) were constructed. The paper reinforcement was placed at 25 mm above the trapdoor. For the 185 mm high embankment (H/B = 1·4), the vertical displacements were measured above the trapdoor at the following heights: 25, 50, 100, 150 and 185 mm. At the heights of 150 and 185 mm, the vertical displacements in the embankment were measurable only after a 3 mm displacement of the trapdoor (Figure 7). The vertical displacement at the height of 185 mm stabilised after the trapdoor displacement of 20 mm. At other intermediate heights (25, 50, 100 and 150 mm), the vertical displacements in the embankments increased with an increase of the displacement of the trapdoor.
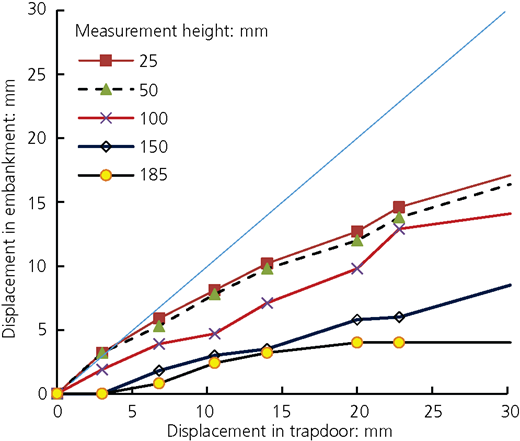
Maximum vertical displacement in the reinforced embankment plotted against displacement of trapdoor number 4 (H/B = 1·4)
Maximum vertical displacement in the reinforced embankment plotted against displacement of trapdoor number 4 (H/B = 1·4)
Using the grids drawn on the aluminium bars, the displacement patterns were traced. At a 3 mm displacement of the trapdoor, the region of movement of the aluminium bars could be delineated by a triangle from the rest of the embankment (Figure 8(a)). Therefore, the shape of the soil arch was triangular at this stage. The picture taken at a 14 mm displacement of the trapdoor (i.e. approximately 10% the trapdoor width) clearly shows a gap between the paper reinforcement and the underlying aluminium bars above the trapdoor (Figure 8(b)). The further displacement of the trapdoor increased the gap between the paper and the aluminium bars but caused some disturbance to the embankment. It is interesting to note the change in the shape of the displacement region of aluminium bars when the displacement of the trapdoor increased from 3 to 14 mm. The triangular arch opened wider and extended higher to the top of the embankment with a trapezoid displacement pattern. Therefore, soil arching formed at different stages with different displacement patterns and changed with the displacement of the trapdoor. In the centrifuge tests, Costa et al. (2009) observed similar patterns of soil arching and characterised the soil arching at a small displacement as an internal failure and that at a large displacement as an external failure. The evolution of the displacement patterns with the displacement of the trapdoor is similar to what Rui et al. (2016) observed in their trapdoor study with sand.
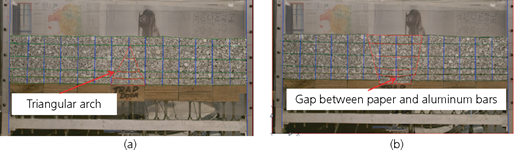
Reinforced embankments at (a) 3 and (b) 14 mm displacements of trapdoor number 4 (H/B = 1·4)
Reinforced embankments at (a) 3 and (b) 14 mm displacements of trapdoor number 4 (H/B = 1·4)
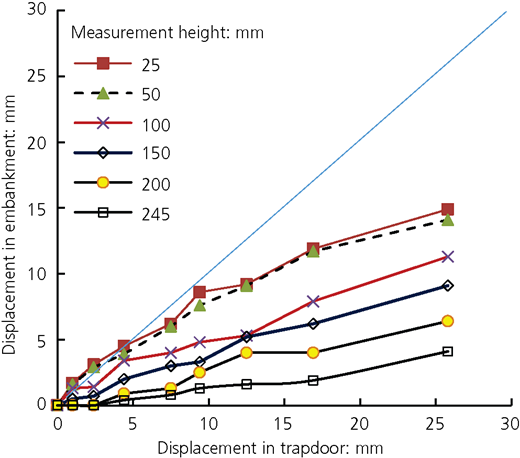
Figure 9 shows the maximum vertical displacements in the reinforced embankment at different stages of the trapdoor displacement in the fourth test (H/B = 2·0) listed in Table 1. The maximum vertical displacements were measured above the trapdoor at the following heights: 25, 50, 100, 150, 200 and 245 mm. With the onset of trapdoor displacement, the vertical displacements in the embankment were measurable at and smaller than 150 mm. A 2·5 mm displacement of the trapdoor was necessary to induce the vertical displacement in the embankment at a height of 200 mm above the trapdoor. Similar to the third test, the soil arch was triangular in shape at a small displacement and opened wider and extended higher with an increase of the displacement of the trapdoor.
Maximum vertical displacement in the reinforced embankment plotted against displacement of trapdoor number 4 (H/B = 2·0)
Maximum vertical displacement in the reinforced embankment plotted against displacement of trapdoor number 4 (H/B = 2·0)
Both Figures 7 and 9 show that the maximum vertical displacements within the height of 40% the trapdoor width (i.e. 50 mm) were smaller than those of the trapdoor. This phenomenon is different from that for unreinforced embankments. Clearly, the reinforcement minimised the displacements of the fill above the reinforcement. For both cases, a gap started to develop below the reinforcement when the displacement of the trapdoor was approximately 14 mm. The further increase in the displacement in the fill was due to the lateral movement of the aluminium bars below the reinforcement close to the edges of the stationary blocks. Overall, the maximum vertical displacements at the same heights for these two cases before their gaps were developed were similar. However, the maximum vertical displacements in the reinforced embankment with H/B = 2·0 were larger than those with H/B = 1·4. The reason is that under the higher embankment, more load would be transferred to the edges of the stationary support and likely caused more lateral movement (failure) of the aluminium bars. As a result, more displacements developed at the same heights of the higher embankment. At the moment of the gap developed below the reinforcement, the maximum vertical displacements on the top of the reinforced embankments were 23% for H/B = 1·4 and 13% for H/B = 2·0, which are approximately half of those for the unreinforced embankments. This comparison demonstrates the benefit of reinforcement in reducing the maximum vertical displacement on the top of the embankment.
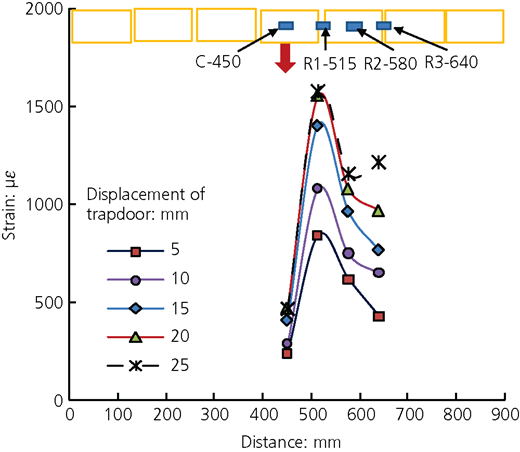
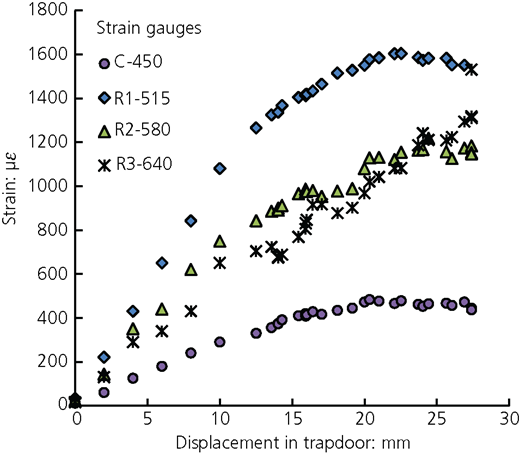
In the third test (H/B = 1·4), four strain gauges were glued to the paper reinforcement and marked as C-450, R1-515, R2-580 and R3-640; the numbers indicated the location of strain gauges (in mm) measured from the left end of the test box and the letters indicated the position of the strain gauges relative to the trapdoor being lowered (C = central; R = right). The strain gauge (C-450) located over the centre of the trapdoor measured the lowest strain. On the other hand, the strain gauge (R1-515) located over the edge of the trapdoor measured the highest strain (Figure 10), which is consistent with the finding by Han and Gabr (2002). Figure 11 shows the strain development in the paper reinforcement at different stages of trapdoor displacement. The strains in the paper reinforcement increased almost linearly up to a 14 mm displacement of the trapdoor. Thereafter, the strains in the paper reinforcement stabilised or increased slowly except R3-640. At this stage of the trapdoor displacement (a gap developed below the reinforcement), the redistribution of stresses in the embankment completed. However, a lateral movement of the aluminium bars below the paper reinforcement was observed. This lateral movement of the aluminium bars must have contributed to an additional strain in the reinforcement after the formation of the gap between the paper reinforcement and the underlying aluminium bars above the trapdoor.
Development of strains along the paper reinforcement with the displacement of trapdoor number 4 (H/B = 1·4)
Development of strains along the paper reinforcement with the displacement of trapdoor number 4 (H/B = 1·4)
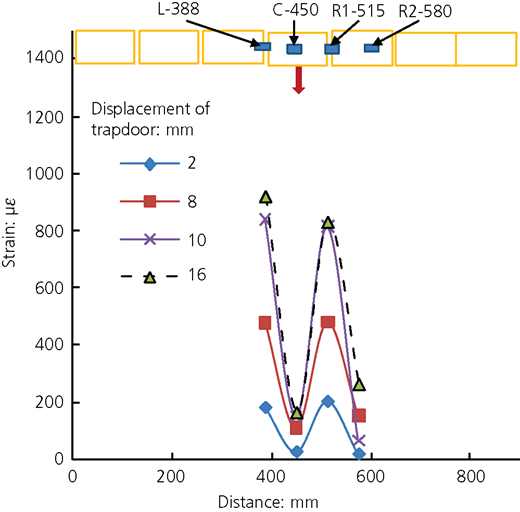
Similar to the third test, four strain gauges were used in the fourth test (H/B = 2·0), but the strain gauges were glued at different locations. Accordingly, the strain gauges were named as L-388, C-450, R1-515 and R2-580 and are shown in Figure 12. The locations of strain gauges were deliberately changed in this experiment to maximise the information using the least possible strain gauges. Figure 12 shows the strain development along the paper reinforcement at different stages of the trapdoor displacement. Similar to the third test, the maximum strain developed next to the trapdoor edge and the minimum strain developed over the centre of the trapdoor. The strain gauges installed on the paper reinforcement over both edges of the trapdoor measured similar strains since the trapdoor number 4, lowered in this test, was located at the centre of the model. The strains in the paper reinforcement stabilised after a 10 mm displacement of the trapdoor.
Development of strains along the paper reinforcement with the displacement of trapdoor number 4 (H/B = 2·0)
Development of strains along the paper reinforcement with the displacement of trapdoor number 4 (H/B = 2·0)
Smaller strains developed in the paper reinforcement for the embankment at H/B ratio of 2·0 than those for the embankment at H/B ratio of 1·4. Also, smaller trapdoor displacement was required for the fourth test (H/B = 2·0) to achieve stable strains along the paper reinforcement compared to the third test (H/B = 1·4). For a same level of displacement of the aluminium bars, higher shear stress develops at the yielding (arch) zone for the embankment at H/B ratio of 2·0 than that for the embankment at H/B ratio of 1·4, which may be the reason for a stable strain at a smaller trapdoor for the fourth test (H/B = 2·0). Based on the study by Han et al. (2017), the minimum soil arching ratios at the soil friction angle of 23° are 0·43 for H/B = 1·4 and 0·27 for H/B = 2·0, respectively. Considering that the unit weight of the fill was 20·6 kN/m3, the vertical stresses applied on the paper reinforcement were 1·64 kPa for H/B = 1·4 and 1·45 kPa for H/B = 2·0. Therefore, the paper reinforcement under the reinforced embankment with H/B = 1·4 was subjected to a higher vertical stress than that with H/B = 2·0. This result can explain why the paper reinforcement under the reinforced embankment with H/B = 1·4 developed larger strains than that with H/B = 2·0.
Interaction of soil arching
As demonstrated in the previous section, at a large trapdoor displacement, the region of displacement in the embankment extended beyond the vertical plane of the trapdoor. When two or more trapdoors are spaced closely and lowered, they may induce interaction between the neighbouring regions of displacement. This interaction was evaluated for the two embankments at different heights (H/B = 1·4 and 2·0). To investigate this interaction, trapdoor numbers 3 and 6 were chosen. Note that trapdoors numbers 3 and 6 were located asymmetrical to the vertical centreline of the embankment. In these interaction tests, trapdoor number 3 was lowered first and then followed by lowering trapdoor number 6. Subsequently, the interaction test involving the trapdoor number 3 was called part 1 trapdoor test and the interaction test involving trapdoor number 6 was called part 2 trapdoor test. Tests 5-1 and 5-2 listed in Table 1 were one interaction test, while tests 6-1 and 6-2 were another interaction test.
Figures 13 and 14 show the maximum vertical displacements in the embankment at different stages of the interaction test for the embankment with H/B = 1·4. Similar to the previous observations for a single trapdoor test, the displacement at the top of the embankment was measurable after a 3 mm displacement of the trapdoor and stabilised when the trapdoor displacement was between 10 and 15 mm. At other measurement heights, the displacements in the embankment increased with an increase of the trapdoor displacement. After a trapdoor displacement of 15 mm, partial collapse (lateral movement) of the aluminium bars between the paper reinforcement and the trapdoor was observed and the bars filled the voids, causing the increased vertical displacement throughout the embankment.
Maximum vertical displacement in the embankments plotted against displacement of trapdoor number 3 in test 5-1 (H/B = 1·4)
Maximum vertical displacement in the embankments plotted against displacement of trapdoor number 3 in test 5-1 (H/B = 1·4)
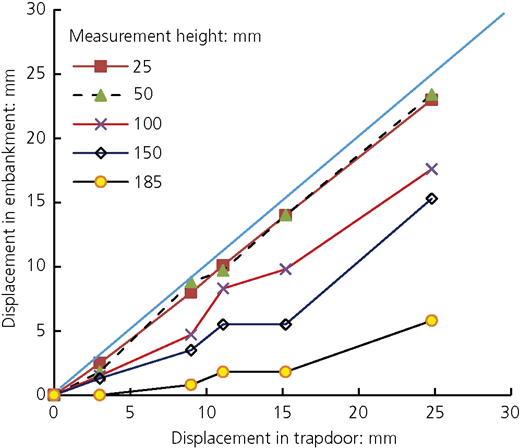
Maximum vertical displacement in the embankments plotted against displacement of trapdoor number 6 in test 5-2 (H/B = 1·4)
Maximum vertical displacement in the embankments plotted against displacement of trapdoor number 6 in test 5-2 (H/B = 1·4)
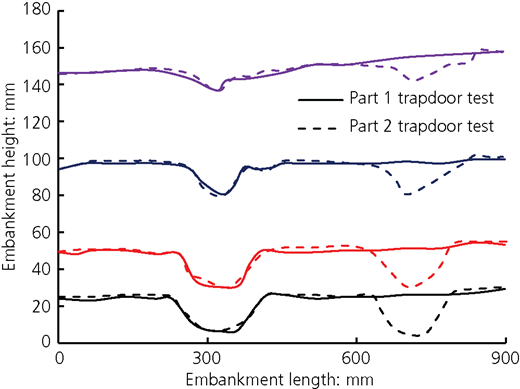
Figure 15 shows the displacement profiles at different heights in the embankment during parts 1 and 2 trapdoor test for the embankment at the H/B ratio of 1·4. The displacement profile shows that the embankment displacements in the part 1 trapdoor test (i.e. the trapdoor test 5-1) were not affected by the displacements of the part 2 trapdoor test (i.e. the trapdoor test 5-2).
Figures 16 and 17 show the displacements in the embankment (H/B = 2·0) at different stages of the trapdoor interaction test including trapdoor tests 6-1 and 6-2. A 3 mm trapdoor displacement was required to cause any displacement at the top of the embankments, which stabilised after reaching 5–10 mm.
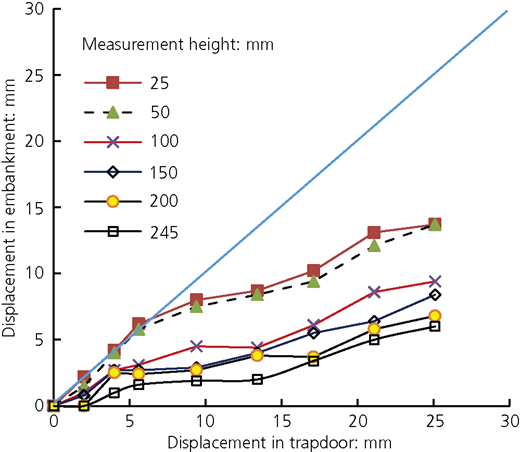
Displacement in the embankment plotted against displacement of trapdoor number 3 in test 6-1 (H/B = 2·0)
Displacement in the embankment plotted against displacement of trapdoor number 3 in test 6-1 (H/B = 2·0)
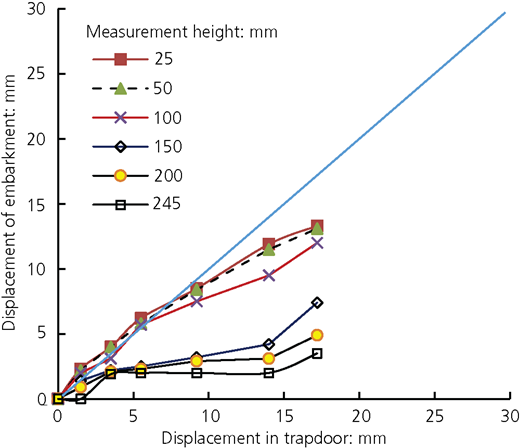
Maximum vertical displacement in the embankment plotted against displacement of trapdoor number 6 in test 6-2 (H/B = 2·0)
Maximum vertical displacement in the embankment plotted against displacement of trapdoor number 6 in test 6-2 (H/B = 2·0)
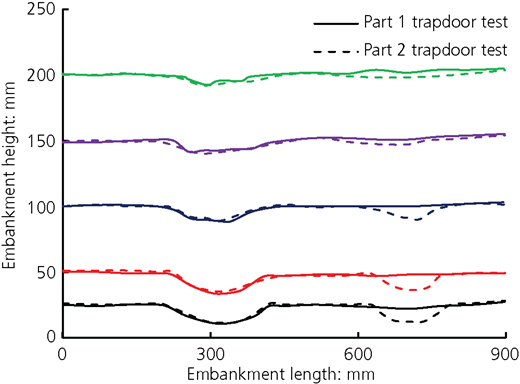
Figure 18 shows the displacement profiles at different heights in the embankment during parts 1 and 2 trapdoor tests for the embankment at the H/B ratio of 2·0. The embankment displacements in the part 1 trapdoor test (i.e. test 6-1) were not affected by the displacements of the Part 2 trapdoor test (i.e. test 6-2). In these tests, the width of the trapdoor was 127 mm and the spacing between the third and sixth trapdoors was 254 mm. Therefore, it can be concluded that the formations of soil arching as the consequences of the displacements of trapdoor numbers 3 and 6 were not interacting.
Figures 19 and 20 show the development of strain in the paper reinforcement with the trapdoor displacement in test 5-1 for the reinforced embankment at H/B ratio of 1·4. Six strain gauges were glued on the paper reinforcement at the distances of 320, 380, 440, 570, 630 and 700 mm from the left end of the test box. The strains in the paper reinforcement stabilised after 10 mm trapdoor displacement. A minimum strain of 466 μϵ developed in the paper reinforcement over the centre of the trapdoor when the trapdoor displacement reached 8 mm and larger. A maximum strain of 1760 μϵ developed in the paper reinforcement next to trapdoor number 3 edge. The minimum and maximum strains were 17 and 10% higher than the corresponding measurements in the third test. Higher strains in this test were justified based on the location of the trapdoor. Had there been the strain gauges on the left side of trapdoor number 3, smaller strains would be recorded since a shorter anchorage length was available on the left side of trapdoor number 3.
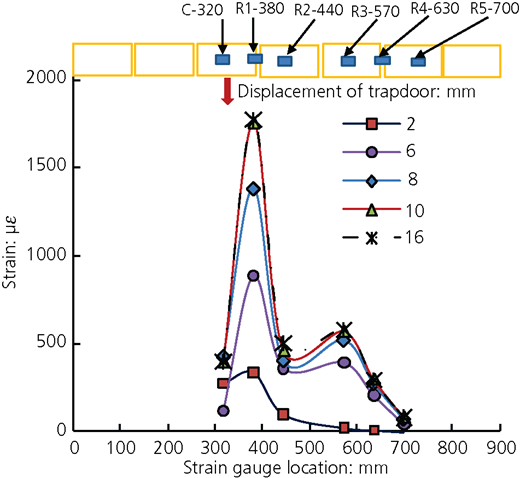
Development of strain along the paper reinforcement with the displacement of trapdoor number 3 in test 5-1 (H/B = 1·4)
Development of strain along the paper reinforcement with the displacement of trapdoor number 3 in test 5-1 (H/B = 1·4)
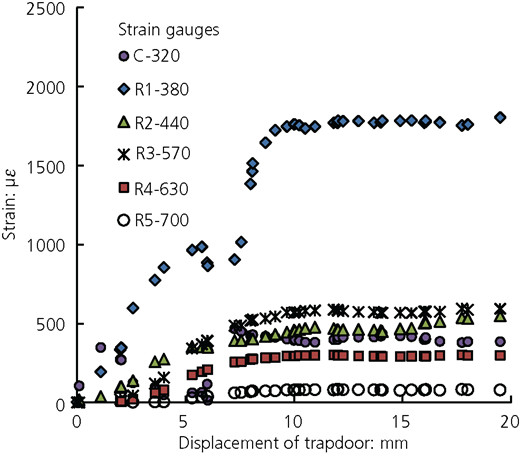
Strain in the paper reinforcement plotted against displacement of trapdoor number 3 in test 5-1 (H/B = 1·4)
Strain in the paper reinforcement plotted against displacement of trapdoor number 3 in test 5-1 (H/B = 1·4)
Figures 21 and 22 show the development of strains in the paper reinforcement in test 5-2 for the embankment at the H/B ratio of 1·4. Strains remained practically constant in gauges C-320, R1-380 and R2-440 when trapdoor number 6 was lowered. Significant strains developed next to the lowered trapdoor (number 6) edge (gauge R4-630). The level of the strain in the paper reinforcement depended on the pullout capacity of the paper, which was limited on the right side of trapdoor number 6 because of a short anchorage length. Therefore, a significant strain developed in the paper reinforcement over the left edge due to load transfer. The strain was released with further displacement of trapdoor number 6, which led to a complete anchorage failure from the right side of the embankment. Gauges R3-570 and R5-700 also experienced strain changes when trapdoor number 6 was lowered, albeit at a slow pace. The strain gauge measurements in Figures 21 and 22 suggested that the displacement of trapdoor number 6 had a marginal effect on the strains in the paper reinforcement above trapdoor number 3.
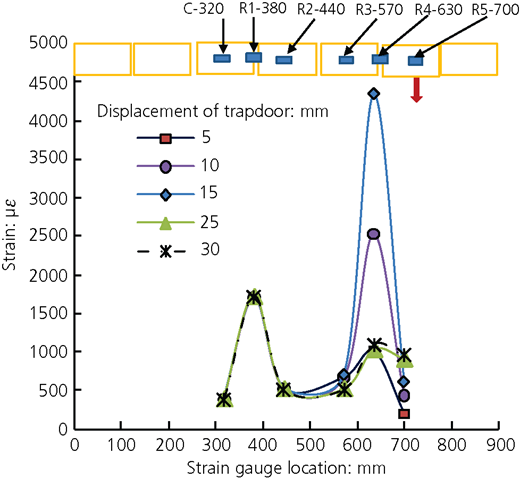
Development of strain along the reinforcement with the displacement of trapdoor number 6 in the sixth trapdoor test (H/B = 1·4)
Development of strain along the reinforcement with the displacement of trapdoor number 6 in the sixth trapdoor test (H/B = 1·4)
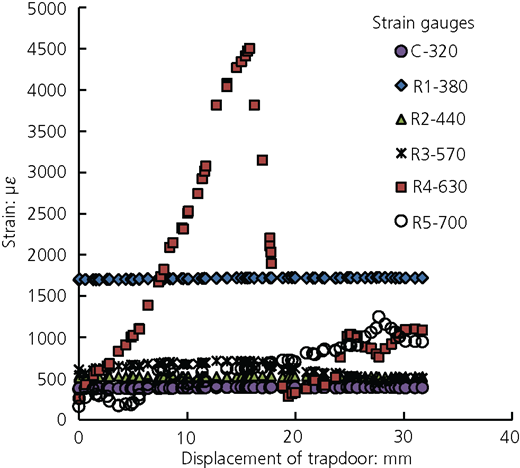
Strain in the paper reinforcement plotted against displacement of trapdoor number 6 in the sixth trapdoor test (H/B = 1·4)
Strain in the paper reinforcement plotted against displacement of trapdoor number 6 in the sixth trapdoor test (H/B = 1·4)
Figures 23 and 24 show the development of strain in the paper reinforcement with the trapdoor displacement in test 6-1 for the embankment at the H/B ratio of 2·0. Six strain gauges were glued on the paper reinforcement at the distances of 320, 380, 440, 570, 630 and 700 mm from the left end. The strains in the paper reinforcement stabilised after a 7 mm trapdoor displacement. A minimum strain of 320 μϵ developed in the paper reinforcement over the centre of the trapdoor when the trapdoor moved 8 mm and more. A maximum strain of 1110 μϵ developed in the paper reinforcement next to the trapdoor edge. The minimum and maximum strains were higher than the corresponding measurements in the fourth trapdoor test. The differences in the available anchorage lengths of the paper reinforcement on the left side of the lowered trapdoors were the reason behind these strain variations. The maximum strain in this test (H/B = 2·0) was 63% of the maximum strain in test 5-1 (H/B = 1·4).
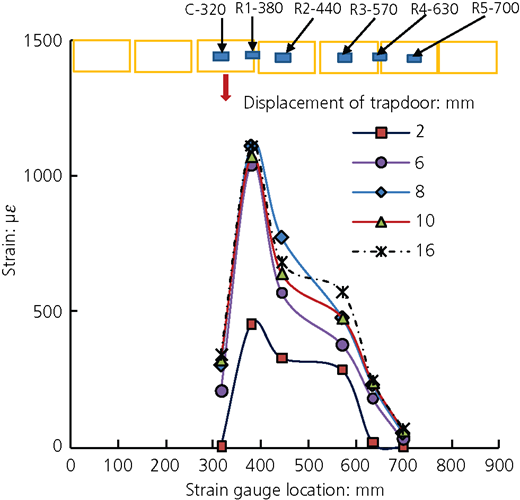
Development of strain along the reinforcement with the displacement of trapdoor number 3 in the seventh trapdoor test (H/B = 2·0)
Development of strain along the reinforcement with the displacement of trapdoor number 3 in the seventh trapdoor test (H/B = 2·0)
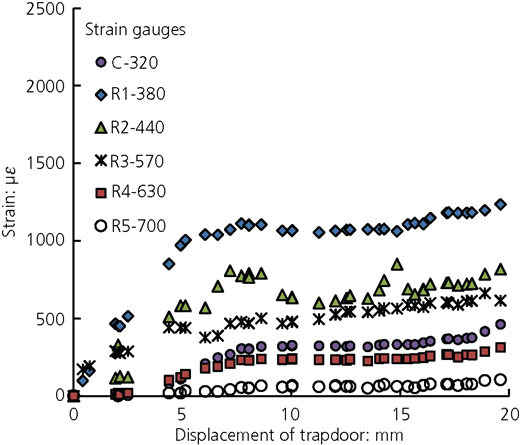
Strain in the paper reinforcement against displacement of trapdoor number 3 in the seventh trapdoor test (H/B = 2·0)
Strain in the paper reinforcement against displacement of trapdoor number 3 in the seventh trapdoor test (H/B = 2·0)
Figures 25 and 26 show the development of strain in the paper reinforcement in test 6-2 for the embankment at H/B ratio of 2·0. The strains in the paper reinforcement remained practically constant in gauges R1-380 and R2-440 when trapdoor number 6 was lowered. A peak strain developed next to the trapdoor edge on the left side (gauge R4-630) when trapdoor number 6 was lowered down by 7 mm. It is worth noting the difference in the peak strains in this trapdoor test (H/B = 2·0) and test 5-2 (H/B = 1·4). Although the anchorage lengths were same for these two tests, the overburden stresses were different due to different embankments heights. For a given material and its interface properties, the pullout capacity of a reinforcement is a function of the overburden stress. Higher pullout capacity of the paper reinforcement available on the right part of the trapdoor number 6 governed the peak strain on the paper reinforcement. The peak strain released with further displacement of the trapdoor because of the anchorage failure from the right side of the embankment. Gauges R3-570 and R5-700 also experienced strain changes when trapdoor number 6 was lowered, albeit at a slow pace. The strain gauge measurements in Figures 25 and 26 suggested that the displacement of trapdoor number 6 had a marginal effect on the strains in the paper reinforcement above trapdoor number 3.
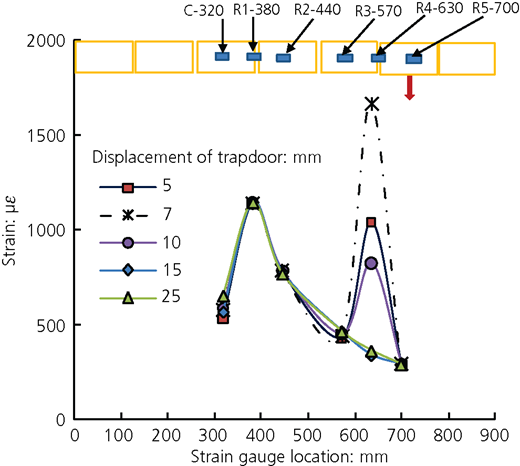
Development of strain along the reinforcement with the displacement of trapdoor number 6 in the eighth trapdoor test (H/B = 2·0)
Development of strain along the reinforcement with the displacement of trapdoor number 6 in the eighth trapdoor test (H/B = 2·0)
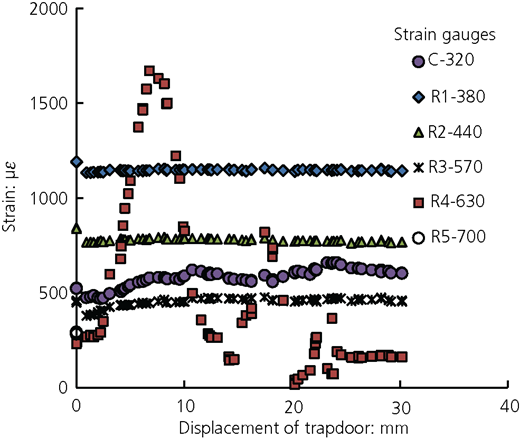
Strain in the paper reinforcement against displacement of trapdoor number 6 in the eighth trapdoor test (H/B = 2·0)
Strain in the paper reinforcement against displacement of trapdoor number 6 in the eighth trapdoor test (H/B = 2·0)
It should be pointed out that the spacing between two trapdoors used in this study was twice the width of the trapdoor, which was relatively larger. If smaller spacing between two trapdoors had been used, their interaction might have been more significant. This expectation should be verified in the future study.
Limitations
This study was conducted to illustrate the development of soil arching and the interaction of double trapdoor movements and form a basis for 2D discrete element method analysis. Since this study used 2D reduced models, there are some limitations: (a) this study was conducted under a 2D condition, while most pile-supported embankments in the field are 3D, and therefore, the soil arching phenomena observed in the model tests may be different from those in the field; (b) soil particle shape and sizes are different from those encountered in the field; (c) the similarity of particle size and reinforcement in terms of scale effect is not strictly followed (this effect can be corrected in numerical analysis); and (d) pullout of reinforcement occurring in the model may not happen in the field.
Conclusions
This paper presents a series of 2D trapdoor tests using an analogical soil to investigate the displacements of the fill in unreinforced and reinforced embankments and the strains in paper reinforcement in reinforced embankments subjected to single and double trapdoor movements. The following conclusions can be made from this experimental study.
Soil arching is essentially a meta-stable condition and changes with the extent as well as the shape of arch with a displacement of the trapdoor. In the 2D model studies conducted in this study, a plane of equal settlement was not observed up to the experimented range of the H/B (the embankment height divided by the trapdoor width) ratio of 2·0.
The height of the embankment had an obvious effect on the vertical displacements of the fill and the strains in the reinforcement. In both unreinforced and reinforced embankments, the higher embankments had smaller ratios of the vertical displacement on the top of the embankment to that of the trapdoor. However, after a gap below the reinforcement was developed in the reinforced embankments, the vertical displacements of the fill continued increasing due to the lateral movement (collapse) of the fill at the edges of the stationary support. The higher embankment resulted in larger vertical displacements since higher load was transferred by soil arching to the edges of the stationary support. On the other hand, less load was carried by the reinforcement in the higher embankment than that in the lower embankment; therefore, smaller strains developed in the reinforcement in the higher embankment.
The inclusion of reinforcement in the embankments minimised the total as well as differential settlements measured on the top of the embankments. A significant strain developed in the paper reinforcement and extended in the lateral direction beyond the vertical plane of the trapdoor. The lateral extent of the strain implies a relative movement between the embankment fill and reinforcement beyond the vertical plane of the trapdoor. The location of a peak strain in the paper reinforcement was governed by the fill thickness between the reinforcement and the trapdoor. In general, the location of the peak strain in the paper reinforcement shifted laterally outwards by a distance equal to the fill thickness between the reinforcement and the trapdoor due to the lateral movement of the fill, the lateral shift distance being measured from the edge of the trapdoor.
In the 2D trapdoor tests, the formation of soil arching due to the displacements of two trapdoors did not interact with each other in a kinematic sense when the trapdoors were separated by a distance equal to twice the width of the trapdoor for the embankment fill of a low friction angle. On the other hand, the displacement of the second-lowered trapdoor separated by the same distance had marginal effects on the development of strains in the reinforcement within the influence zone of the first-lowered trapdoor. The anchorage failure of the reinforcement also controlled the development of the peak strain particularly in the low embankments and should be considered in the design.