

Contribution by Armin W. Stuedlein
The authors have written a technical paper describing the prediction of the capacity of a single stone column, or aggregate pier, embedded within soft, plastic fine-grained soil, a topic that continues to receive a large amount of attention due to the need to satisfactorily predict the bearing performance of improved ground. The authors are to be commended for their approach, which seeks to accommodate the complex plastic strain field around an expanding cylinder to improve the accuracy of the ultimate resistance, qu, of a single column. Their effort is important, as improving the fundamental understanding of the governing processes will ultimately yield more accurate design tools. The purpose of this discussion is to clarify an equation, inquire about the authors' opinion on modelling decisions, and to make some comparisons of the accuracy of the authors' model to other recently developed capacity predictions.
Equation 25 in the paper appears to contain a typographical error: is it possible that this equation should be expressed as
where β = 3·1 in Equation 25? Assuming this to be the case, then the term β is analogous to the cavity expansion factor, kp, described by Stuedlein and Holtz (2013). As described by the authors, the cavity expansion factor theoretically varies as a function of elastic parameters, such as the undrained Young's modulus, E, and Poisson's ratio, n. However, in the discusser's experience, it is very difficult, and perhaps inappropriate, to estimate E for soils near a state of plastic equilibrium. In an alternative approach, Stuedlein and Holtz (2013) found that kp was highly correlated to the undrained shear strength, cu, and given by
owing to its role governing the undrained passive resistance (i.e. confining stress), and therefore the effective friction angle, φ′, of the stone column at failure. Interestingly, using an independent database, the average value of kp back-calculated by Stuedlein and Holtz (2013) was 3·0, in agreement with the authors' back-calculation of β. Nonetheless, the discusser feels that use of a single value of kp or β is not appropriate.
The loading test data by Bergado and Lam (1987) and used by the authors to calibrate several cavity expansion models represent one of the few case histories where a friction angle was reported. Unfortunately, the range in normal stresses in the direct shear test results used by Bergado and Lam (1987) was not reported, nor was the dilation angle of the aggregates; therefore, there is some potential for uncertainty in the evaluation of the accuracy of the strength-normalised capacity, qu/cu, versus φ′ relationships (e.g. see Figures 3 and 6 in the original paper). Stuedlein and Holtz (2012) and Newton (2014) demonstrated that the crushed aggregates commonly used for stone column construction in Europe and North America exhibit high rates of dilation, generally exhibiting a reduction in the friction angle of 9–14° per logarithmic cycle of atmospheric pressure-normalised confining stress. Thus, the use of Equation 25 or its variants could pose some difficulty owing to the selection of an appropriate friction angle and elastic soil constants. The discusser would appreciate the authors' comments on these points.
The discusser also notes that the value of cu used by Bergado and Lam (1987), and also by the authors, was probably of the order of 30 kPa. This is consistent with the value of cu selected by Stuedlein and Holtz (2013, 2014) for the same soil profile. Note that the database used by Stuedlein and Holtz (2013, 2014) did not include the loading tests reported by Bergado and Lam (1987), owing to the potential for the inclusion of small-diameter stone columns, which are not common in North America or Europe, to affect the empirically based analyses. However, the loading tests reported by Bergado et al. (1987) were included, to capture the effects of intermediate area replacement ratios. In those cases where a relatively uniform soil profile existed in the Stuedlein and Holtz (2013, 2014) database, a geometric average of cu over twice the height of yielding, hy, was assumed, where hy = dp tan(φ′) and dp is the diameter of the pier (Brauns, 1978). For the friction angles of the aggregates tested by Bergado and Lam (1987), the height of yielding can be estimated to range from 0·47 to 0·82 m, with an average of 0·62 m, consistent with the depth selected for the computation of p0 by the authors. After further consideration, the discusser wonders whether this depth is appropriate for computing the limit pressure, and hence qu, of the expanding stone column in soil profiles that are characterised by overconsolidated crusts overlying soft clay.
Figure 7 shows the profile of the undrained shear strength and the total radial pressure at failure, σrf = p0 + kpcu, with depth as reported by Bergado et al. (1987) for the same test site as that used by Bergado and Lam (1987). Equation 2 in this discussion was used to calculate σrf to avoid the selection of an appropriate friction angle, dilation angle and Young's modulus. The profile in Figure 7 is typical of surficial clay deposits, with a desiccated, overconsolidated crust of approximately 2 m overlying a thick layer of very soft clay. It is not unrealistic to assume that bulging would occur deeper than the typical height of yielding in such a soil profile. Thus, the following questions are prompted: which depth is appropriate for the selection of the bulging depth, and which undrained shear strength is most appropriate? It is tempting to select the depth corresponding to the minimum undrained shear strength, 3·15 m, as the controlling depth of plastic failure. However, inspection of Figure 7 shows that the minimum total radial stress at failure is approximately 2·5 diameters above this depth, higher in the profile owing to the competing increases in the radial stress (associated with the geostatic and hydrostatic stress components) with the non-linear profile of cu. Corresponding to the minimum magnitude of σrf, the depth of 2·45 m is probably the most appropriate depth of column yielding in soils exhibiting the soil profile shown in Figure 7. The undrained shear strength in the vicinity of 2·45 m is equal to about 18 kPa.
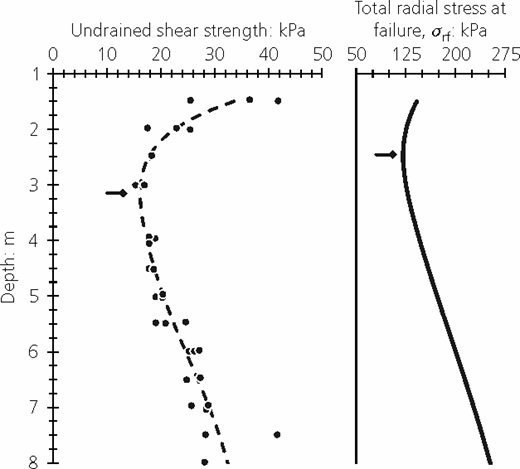
Profiles of the undrained shear strength and the total radial stress with depth for the Bangkok, Thailand, test site. Minimum values of cu and σrf are indicated by arrows
Profiles of the undrained shear strength and the total radial stress with depth for the Bangkok, Thailand, test site. Minimum values of cu and σrf are indicated by arrows
Owing to the importance of assessing engineering design models, it is of significant interest to evaluate the accuracy of ultimate limit state models for stone-column-improved ground. The authors' cavity expansion model predicts the strength-normalised capacity with an average bias (equal to the ratio of the measured capacity to the predicted capacity) of 0·94 and a coefficient of variation in the bias of 13% for the data used to calibrate their model (Table 3). This represents an accurate model, with a slight overprediction of capacity and low variability. Table 3 also presents the performance of the capacity models recently proposed by Stuedlein and Holtz (2013), which consist of the modified Mitchell method, the modified Hughes and Withers method and the multiple linear regression model recently incorporated into a reliability-based design approach by Stuedlein et al. (2014). The reader is referred to Stuedlein and Holtz (2013) and Stuedlein et al. (2014) for the formulation of these methods. The multiple linear regression model requires various geometrical factors such as the slenderness ratio, the depth of embedment and the area replacement ratio; in addition, each of these methods requires an estimate of the undrained shear strength. Based on the previous discussion (and Figure 7), a representative value of cu = 18 kPa was assumed for these comparisons. The relatively simple, one-parameter modified Mitchell method overestimated the observed capacity by 33%, on average, and exhibited an uncertainty of nearly 18%. On the other hand, the more theoretically robust modified Hughes and Withers method produced a mean and COV for the bias of 0·99 and 13%, indicating excellent overall prediction performance. Finally, the multiple linear regression model proposed by Stuedlein and Holtz (2013) yielded a mean and COV for the bias of 0·91 and 18%. The accuracy of these three models is remarkable because the loading test data evaluated (i.e. Bergado and Lam, 1987) was not included in their source database.
Comparison of the accuracy of various bearing capacity models for footings on single stone columns
| Designation | Observed load test data (Bergado and Lam, 1987) | Frikha and Bouassida (2014) | Modified Mitchell method | Modified Hughes and Withers method | Multiple linear regression model | ||||||||||
|---|---|---|---|---|---|---|---|---|---|---|---|---|---|---|---|
| Friction angle, φ′: deg | qu /cu | qu: kPaa | qu: kPa | Biasb | qu: kPa | Bias | qu: kPa | Bias | qu: kPa | Bias | |||||
| G1 | 39·1 | 15·3 | 435 | 416 | 1·05 | 501 | 0·87 | 393 | 1·11 | 470 | 1·05 | ||||
| G2 | 38·4 | 14·3 | 404 | 404 | 1·00 | 501 | 0·81 | 380 | 1·06 | 470 | 0·98 | ||||
| G3 | 37·2 | 14·3 | 404 | 384 | 1·05 | 501 | 0·81 | 359 | 1·12 | 470 | 0·98 | ||||
| G4 | 37·0 | 14·3 | 404 | 381 | 1·06 | 501 | 0·81 | 356 | 1·13 | 470 | 0·98 | ||||
| G5 | 36·0 | 13·1 | 373 | 365 | 1·02 | 501 | 0·74 | 340 | 1·10 | 470 | 0·90 | ||||
| G6 | 37·6 | 13·1 | 373 | 391 | 0·95 | 501 | 0·74 | 366 | 1·02 | 470 | 0·90 | ||||
| G7 | 35·1 | 10·0 | 280 | 351 | 0·80 | 501 | 0·56 | 326 | 0·86 | 470 | 0·68 | ||||
| G8 | 36·2 | 10·0 | 280 | 368 | 0·76 | 501 | 0·56 | 343 | 0·82 | 470 | 0·68 | ||||
| G9 | 35·6 | 8·7 | 249 | 359 | 0·69 | 501 | 0·50 | 334 | 0·74 | 470 | 0·60 | ||||
| G10 | 37·4 | 14·2 | 404 | 388 | 1·04 | 501 | 0·81 | 363 | 1·11 | 470 | 0·98 | ||||
| G11 | 37·9 | 14·0 | 373 | 396 | 0·94 | 501 | 0·74 | 371 | 1·01 | 470 | 0·90 | ||||
| G12 | 42·5 | 15·3 | 435 | 481 | 0·90 | 501 | 0·87 | 464 | 0·94 | 470 | 1·05 | ||||
| G13 | 44·7 | 16·5 | 466 | 528 | 0·88 | 501 | 0·93 | 520 | 0·90 | 470 | 1·13 | ||||
| Mean | 0·94 | 0·75 | 0·99 | 0·91 | |||||||||||
| COV: %c | 13·00 | 17·70 | 13·20 | 17·70 | |||||||||||
a Assuming dp = 32 cm (Bergado and Lam, 1987).
b Defined as the ratio of the measured capacity and the predicted capacity.
c Coefficient of variation: defined as the ratio of the standard deviation of the point bias and the mean bias.
This discussion raises several points regarding the use of cavity-expansion-based capacity models for stone-column-improved ground. The authors have developed a suitable and accurate tool for use by practising engineers, and it is a welcome addition to the toolbox. Active discussion of its advantages and disadvantages would help to illustrate its intended application, and the discusser looks forward to the opinions of the authors.
Authors' reply
The authors thank the discusser for his interest in their recent paper. First, as noted in the discussion, there was a mistake in Equation 25, which derived directly from Equation 17. The correct equation is
as given by the discusser. The elastic parameter used in the equation for the expansion cavity can be directly derived from pressuremeter tests that give the undrained deformation modulus and the limit pressure of the tested soil. The correlation by Stuedlein and Holtz (2013) can also be adopted (as for other correlations from expansion cavity theories) to determine the coefficient kp (or β) from the undrained shear strength. The authors agree with the discusser that the use of a single value for kp or β is insufficient. More importantly, the design of foundations on reinforced soil by columns can be addressed using more recent modelling, such as the group of columns model, and novel methodology applicable to all types of columnar techniques (Bouassida and Carter, 2014).
Also, several other parameters can be considered for the calculation, especially for the improvement of initial soil properties due to the installation method for stone columns (undrained shear strength and deformation modulus), as demonstrated in Frikha et al., 2013.
The increase in the undrained shear strength is pronounced mostly at low consolidation stresses and high cavity expansion ratios (Frikha et al., 2013).
As reported by the discusser, several details are not presented satisfactorily in the experimental work of Bergado and Lam (1987). Regarding the dilation of columns, however, not considered in the present work, the authors are of the opinion that the applied load increases the density of column material that behaves as contracting soil and, hence, the residual friction angle increases. For the case of the present study, the dilation of crushed aggregates is not important because the depth of the assumed failure is taken as just below the ground surface (0·2–0·3 m).
The undrained shear strength considered in the paper is 32·4 kPa, which is almost the same value presented by Stuedlein and Holtz (2013, 2014) for the same soil profile. This value is calculated from the presented results of Bergado and Lam (1987) for the measured load on the head of a stone column and the presented ratio of σ/cu in Figure 9 in Bergado and Lam (1987) using the appropriate column diameter (0·3 m). From an estimation of cu, the value used by Bergado and Lam ranged between 31 and 33 kPa.
The considered value for the undrained shear strength is justified by the installation procedure, which improves the initial shear strength of reinforced clayey soil as explained in Frikha et al. (2013) and Frikha et al. (2014).
The prediction of the failure depth is assumed to occur in the first metre (0·2–0·3 m below the ground surface) in the top of the column, which corresponds to the expansion of the column presented by Bergado and Lam (1987) after the loading test (see Figure 9 in Bergado and Lam (1987)). The bulge occurs as observed by Bergado and Lam (1987) close to the ground surface. The profile reported by the discusser should be compared with that used by Bergado and Lam (1987). However, it is relevant that the profile (presented by the discusser) does not show the first metre below the ground surface and starts from almost 1·5 m. In addition, there is no significant decrease in the radial stress between the depth of 1·5 and 2·45 m. From the figure reported by the discusser, there is only a reduction of 16% (σrf = 150 kPa (z = 1·5m) and σrf = 125 kPa (z = 2·45 m)).
Figure 8 shows the profiles of undrained shear strength with depth for the Bangkok, Thailand, test site. cu = 32 kPa can then be considered.
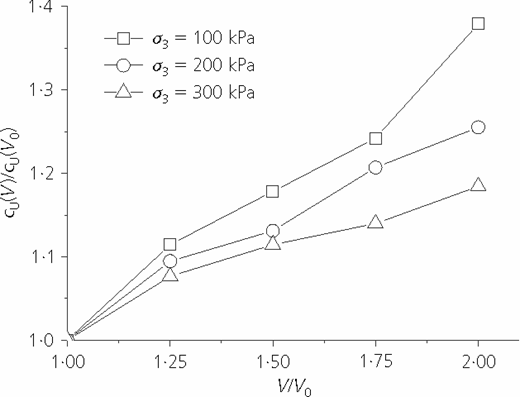
Gain in the undrained shear strength plotted against the cavity expansion factor (Frikha et al., 2013). V, cavity volume; V0, initial cavity volume; V/V0, cavity expansion ratio
Gain in the undrained shear strength plotted against the cavity expansion factor (Frikha et al., 2013). V, cavity volume; V0, initial cavity volume; V/V0, cavity expansion ratio
As reported by Bergado and Lam (1987), for each 10 cm of excavation, the diameter of each pile was measured down to a depth of 1·20 m. The averaged deformed shape is plotted in Figure 9 in Bergado and Lam (1987). It was observed that the maximum bulge occurred near the top of the pile and ranged from 10 to 30 cm below the ground surface. Compared with the initial pile diameter of 30 cm, the measurements are in close agreement with the observations of Hughes et al. (1975) that the maximum bulge occurred near the ground surface equal to one-half to one granular pile's diameter.
The calculation performed by the discusser (using the authors' approach) for a depth of 2·45 m gives good results, and can be compared with the calculation for the depth of the first metre. The authors thank the discusser, and suggest carrying out the calculation for different depths and using the evolution of the undrained shear strength.
The comparison between the results of the multiple linear regression model developed by Stuedlein and Holtz (2013) and Stuedlein et al. (2014), Mitchell, and Hughes and Withers is also very interesting, highlighting the accuracy of the authors' approach. Discussion of the validity of these models by considering other experimental results available in the literature would be a useful next step.

