An understanding of the “AS-IS” stage of a relief operation is the basis for further action in humanitarian supply chain management. The purpose of this paper is to develop a toolbox called the Humanitarian Supply Chain Assessment Tool (HumSCAT). This toolbox is comprised of a set of basic tools which can be classified into each phase of disaster relief.
The HumSCAT is proposed by paralleling frequently used tools in commercial supply chains with the objectives and characteristics of relief phases. A case study was used to validate the HumSCAT along with six tools provided in the preparation phase.
The HumSCAT consists of seven tools in the preparation phase, nine tools in the response phase and ten tools in the recovery phase. The case study illustrates how to use the HumSCAT and the six tools. The latter were found to be useful for improving the relief chain.
The list of tools is not exclusive. Other tools might be applicable as long as they meet the objectives and characteristics of the phase. A tool should be adjusted accordingly to the contexts. Tools in other phases should be validated in future research.
The HumSCAT may serve as a reference toolbox for practitioners. Its output can be used for further designing of the “TO-BE” status of humanitarian relief chains.
The HumSCAT is proposed as a toolbox for academics and practitioners involved in humanitarian supply chains.
1. Introduction
Humanitarian relief has been the focus of logistics, supply chain academics and practitioners over the years. Supply chain management is a key issue in relief operations (Van Wassenhove, 2006; Tomasini and Van Wassenhove, 2009). In businesses, supply chain management encompasses all activities that link the sources of supply (suppliers) to the owners of demand (end customers) and aims at delivering the right supplies in the right quantities to the right locations at the right time (Christopher and Peck, 2004; Ballou, 2007). Similarly, the goal of humanitarian relief management is to deliver the right supplies through relief supply chains to the right end users (beneficiaries) at the right time and place (Van Wassenhove, 2006; Oloruntoba and Gray, 2006; Kovács and Spens, 2007). Many studies advocate that knowledge from commercial supply chain management can be used in the studies related to humanitarian supply chains (Beamon and Balcik, 2008; Pettit and Beresford, 2009; Cozzolino et al., 2012).
Not all characteristics of the humanitarian supply chains are similar to those in commercial supply chains. A relief chain operating in an area damaged by natural disasters is complex and requires various interventions (Van Wassenhove, 2006). Demand for goods in the chain is also rarely predictable (Kovács and Spens, 2007; Beamon and Balcik, 2008). Having many actors in relief chains is another challenge. Distinct organizational strategic goals and conflicting interests among actors can increase the complexity of relief operations as well as make the relief chains become more unstable (Oloruntoba and Gray, 2006; Kovács and Spens, 2007; Beamon and Balcik, 2008; Oloruntoba and Kovács, 2015). From the perspective of supply chain management, acquiring and allocating resources are always confronted with problems such as the quality of resources and the efficiency and effectiveness of resources used (Kovács and Spens, 2007; Beamon and Balcik, 2008; Cozzolino et al., 2012; Oloruntoba and Kovács, 2015). Therefore, the humanitarian supply chain management has to meet donors’ objectives, manage all actors involved in the chains, maximize efficiency at minimum costs by making efficient use of donated supplies, reduce suffering and save lives within limited time (Van Wassenhove, 2006; Kovács and Spens, 2007; Oloruntoba and Gray, 2009; Balcik et al., 2010; Cozzolino et al., 2012).
In order to have an effective and efficient humanitarian supply chain under such complexities, it is necessary to understand issues and problems related to the supply chains (Pettit and Beresford, 2009). To have a clear understanding of supply chains is fundamentally to have a clear understanding of the existing network structure, processes and configurations of the supply chains (Lambert et al., 1998; Christopher and Peck, 2004). In the humanitarian relief context, the literature indicates that current studies seem to focus on various topics such as optimization, collaboration, risk management and performance measurement (see e.g. Kunz and Reiner, 2012; Banomyong et al., 2017; Behl and Dutta, 2018). However, the literature does not provide a toolbox or a set of basic tools that could assist academics and practitioners to understand the existing status of humanitarian relief chains. On the other hand, assessment tools developed by practitioners – e.g., the International Federation of Red Cross and Red Crescent Societies (IFRC, 2008) and the United Nations Development Programme (UNDP, 2013) – are based on particular organizational contexts and are focused on particular disasters. Based on these facts, there is a need to develop a toolbox which could be used to assess the existing status of relief supply chains.
This manuscript borrows frequently used tools in commercial supply chains and proposes a toolbox, the Humanitarian Supply Chain Assessment Tool (HumSCAT). The HumSCAT consists of a suite of tools which are sorted accordingly to each phase of disaster relief. It is hoped that it can be used as a reference toolbox for academics and practitioners in humanitarian supply chains in order to assess their relief chain performances. A case study is used to validate the proposed HumSCAT.
This manuscript starts with a review of the literature and is followed by a proposition of the HumSCAT and rationale behind the selection of tools. A concise presentation of each tool used in the HumSCAT and its current and future applications are illustrated and discussed. The case study is used to validate the HumSCAT. Finally, discussions and conclusions are presented.
2. Literature review
2.1 Disaster types and relief phases
Van Wassenhove (2006) classified disasters into four types based on speed (sudden-onset or slow-onset) and causes (natural or man-made). Van Wassenhove further stated that as there is a variety of disasters, a relief operation is therefore complex and requires various interventions. Supply chain management is critical in disaster relief. However, unlike commercial supply chains, the unique characteristics of humanitarian supply chains pose challenges for humanitarian researchers and practitioners. Kovács and Spens (2009) categorized the challenges into three groups (i.e. the challenge created by disaster types, the challenge created by disaster relief phases and the challenge created by organizations in a relief chain). They further stated that the challenge created by disaster types could be managed through the perspective of disaster relief phases; for example, natural and man-made disasters could be prepared, prevented and mitigated in the preparation phase.
Disaster relief operations can be separated into three or four phases and these phases are cyclical and overlapping (Kovács and Spens, 2009; Cozzolino, 2012; Scholten et al., 2014). The preparation phase requires that, in order to minimize possible negative consequences, all actors must prepare for and prevent the next disaster. In the response phase, collaboration among all actors is important and aid must be deployed with speed and effectiveness. In the recovery phase, long-term rehabilitation and post-disaster evaluation is needed. Finally, the mitigation phase is the basis for all phases. It is essential for humanitarian supply chain resilience capabilities and should be incorporated along with the preparation and recovery phases (Maon et al., 2009; for a review of humanitarian supply chain resilience, see Scholten et al., 2014). Maon et al. (2009) further stated that these phases are not independent but interrelated. The recovery and mitigation phases should be developed in parallel while the preparation and response phases being interconnected should be operated concurrently. However, the mitigation phase is not directly involved with logisticians but involved more with policy makers (Cozzolino, 2012). Such policy makers aim at developing laws, policy and strategies related to relief chains (Scholten et al., 2014). As this manuscript aims at assessing the existing status of relief chains, it focuses on the operational level of the chains. The mitigation phase is thus not included in the HumSCAT.
2.2 Actors in relief chains
Apart from the disaster types and the relief phases, having many actors in relief chains will increase the complexity of the supply chains. Kovács and Spens (2007) provided a framework illustrating six actors in the humanitarian relief supply network – relief organizations, donors, other non-governmental organizations (NGOs), governments, military and logistics providers. In a relief chain, a relief organization is a primary actor which could receive funds and resources from donors such as governments, individual donors or private companies (Kovács and Spens, 2007; Oloruntoba and Kovács, 2015). Cozzolino (2012) stated that not only logistics providers but other companies may have an important role in relief chains and act as a donor providing financial supports (in-cash), a collector gathering donations from its customers, employees, and suppliers, or a provider offering foods and services (in-kind). Banomyong and Julagasigorn (2017) indicated that a company and modern trade retailers could also act as operators and/or distributors in a relief chain and help improve the effectiveness and efficiency of the operation by collaborating with a relief organization.
On the other hand, having many actors in relief chains creates a challenge to humanitarian supply chain management. Different actors have different goals. While the goal of business is to generate profit for shareholders, the goal of humanitarian relief aims to achieve social purpose, relieve suffering and save lives (Beamon and Balcik, 2008; Oloruntoba and Gray, 2009). Resources and funds sent to an organization often come from various donors who have distinct purposes and often request their donations to be spent on a particular purpose, whereas, on the demand side, beneficiaries usually do not have control over supplies (Oloruntoba and Gray, 2006; Kovács and Spens, 2007). Therefore, a relief organization takes multiple responsibilities in a relief supply chain. On the one side, it has to satisfy the demands of donors and treat them as board directors (Beamon and Balcik, 2008) or as customers of relief chains (Balcik et al., 2010). On the other side, it has to manage problems such as the quality of resources, the efficiency and effectiveness of resources used, as well as save lives (Kovács and Spens 2009; Oloruntoba and Kovács, 2015). From the perspective of Maon et al. (2009), relief organizations should view all actors in relief chains as their customers: end-consumers (beneficiaries such as victims and survivors), donors (outside stakeholders who donate money and would like to know how their money is utilized), governments (recipient countries) and others such as local communities, military, NGOs and logistics providers. Humanitarian supply chain management, therefore, needs to meet all actors’ requirements as well as manage relationships among actors in order to ensure the effectiveness and efficiency of relief chains (Beamon and Balcik, 2008; Balcik et al., 2010).
2.3 Assessment tools in humanitarian supply chains
Supply chain management literature states that having a clear understanding of the existing network structure, processes and configurations of supply chain is the prerequisite for any action including performance measurements and operations (Lambert et al., 1998; Christopher and Peck, 2004). In the humanitarian relief context, an effective and efficient humanitarian supply chain requires that a relief organization should understand the issues and problems related to its relief chain (Pettit and Beresford, 2009). An understanding of the “AS-IS” stage of a relief operation is essential and is the basis for further action such as process redesign and reengineering (Scholten et al., 2014).
To gain these understandings, humanitarian aid supply chain assessment tools are required. Thus, the authors explored assessment tools or a set of basic tools that could be provided in the literature. Initially, several articles discussing themes and research issues in the humanitarian supply chain context were reviewed (Altay and Green, 2006; Natarajarathinam et al., 2009; Kunz and Reiner, 2012; Galindo and Batta, 2013; Leiras et al., 2014; Behl and Dutta, 2018). Further, one may consider that the issue regarding performance measurement is an issue related to the purpose of this manuscript. Two articles regarding performance measurement in the humanitarian supply chains were also reviewed (Abidi et al., 2014; Banomyong et al., 2017).
To include peer-review articles that might not be considered by those review articles, searches via Google Scholar were undertaken employing keywords such as “assessment tool” incorporated with “humanitarian supply chain” and their synonyms. Charles et al. (2010) proposed an assessment framework that aimed to assess the status of relief chains based on a specific theoretical aspect. Metrics used to measure commercial supply chains agility were refined and used to measure agility capabilities of a relief organization. The model helped academic and practitioners in assessing the level of agility of their relief chains. Apart from this paper, the main body of the literature used tools from commercial supply chains to assess the current status of relief chains (e.g. Bevilacqua et al., 2014; Schumann-Bölsche et al., 2015; Paciarotti et al., 2018). However, these articles merely employed specific tools to assess specific contexts of the chains and/or merely focused on a particular phase. For example, Paciarotti et al. (2018) used a tool to assess the strengths and weaknesses of a relief chain operating in an emergency response phase. Thus, it seems that the literature does not provide any toolbox or a set of basic tools which are sorted accordingly to the relief phases and could be further used to assess the “AS-IS” status of humanitarian supply chains.
Apart from the academic field, practitioners have developed their own in-house assessment tools (e.g. IFRC, 2008; UNDP, 2013). These tools, although useful, are derived from functional ghettos and focus on particular disaster phases, purposes and organizational functions. Such tools do not fit well for cross-functional aspects and often are not publicly available.
3. The Humanitarian Supply Chain Assessment Tool
3.1 Developing the HumSCAT
Developing a set of basic tools, aligned to humanitarian relief phases, was inspired by the Q-methodology. This method is suited for generating new ideas and propositions (Brown, 1993; Van Exel and De Graaf, 2005). Typically, it involves presenting a sample of statements about some topic to respondents and asking them to rank-order those statements from their individual point of view (Brown, 1993). This manuscript used the Q-methodology as a guiding principle to provide the foundation to observe a respondent’s viewpoint. The methodological steps are as follows: identifying frequently used tools in commercial supply chains, developing a common pool of tools that could have potential applications in the humanitarian relief context and sorting the tools in the common pool into the phases of disaster relief.
To look for any assessment tool, the authors explored the supply chain management literature. In a commercial supply chain, frequently used tools in manufacturing- and service-based supply chains and their applications have commonly been suggested and discussed in the literature. A literature review related to existing supply chain assessment tools provided an initial list of seven tools. The initial list was based on the seminal paper by Hines and Rich (1997). The authors then assessed the fit of this initial list with the objectives and characteristics of each disaster relief phase. It was found that production variety funnel and quality filter mapping did not fit the humanitarian context as they were predominantly manufacturing based which is not the case in a service environment supply chain such as disaster relief. The authors then explored which type of tools could be used in the assessment of a service supply chain and discovered from the literature that Value Stream Mapping (VSM) (Rother and Shook, 1999), Integration Definition for Function Modeling (IDEF0) (Menzel and Mayer, 2004), Swim Lane Mapping (SLM) (Sharp and McDermott, 2009), Supply Chain Operations Reference (SCOR) model (Supply Chain Council version 11), Post-Disaster Needs Assessments (PDNA) Tool (UNDP, 2013), Service Quality Model (SERVQUAL) (Parasuraman et al., 1991) and Knowledge Management Assessment Tool (KMAT) (AMCES, n.d.) could be included in the assessment of humanitarian supply chains. The list of the proposed tools is not exhaustive and does not claim to be. However, these basic tools were selected because of their applicability to the humanitarian supply chain context, ease of use, limited data requirement and visual representation capability. In total, the authors proposed initial 12 basic assessment tools for the humanitarian supply chain toolbox. The list includes: VSM, Decision Point Analysis (DPA), IDEF0, Physical Structure Map (PSM), Process Activity Mapping (PAM), SLM, SCOR model, Supply Chain Response Matrix (SCRM), Demand Amplification Analysis (DAA), PDNA Tool, SERVQUAL and KMAT.
In order to allocate these 12 tools into the appropriate phases of disaster relief, the authors participated at the Regional HELP Logistics workshop held in Singapore between August 31 and September 1, 2016. At this workshop, three practitioners from the HELP Logistics, under the Kuehne Foundation, were presented with the list of tools and asked to check and confirm the relevance of disaster relief phases and the 12 proposed basic tools. The three representatives from the HELP Logistics were the head of global programs at HELP Logistics, an executive director of the Kuehne Foundation and their regional director for Asia. The HELP Logistics respondents were provided with an explanation of each basic tool and how they could be used in each disaster relief phase. They were then asked to help provide comments and allocate each basic tool into the three corresponding disaster relief phases proposed by the authors. Their allocation preferences were noted. The respondents also stated that it was their first time encountering these tools as they and other practitioners rarely use assessment tool when engaging and handling relief operations. The respondents agreed that these tools could be useful for them. A consensus was drawn and the proposed basic tools were included in the HumSCAT for different relief phases.
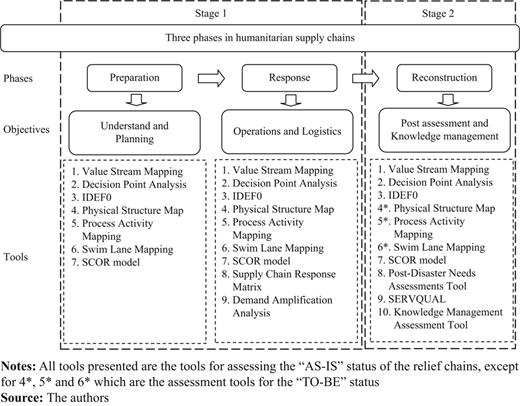
The HumSCAT is illustrated in Figure 1. It is separated into two stages. The first stage covers the preparation and response phases, while the second stage contains only the recovery phase. This is because Maon et al. (2009) suggested that the preparation and response phases are interrelated and involved with each other.
Table I summarizes the rationale behind the selection of tools proposed in the HumSCAT. The objectives and characteristics of each relief phase were derived from the literature. The characteristics of the tools for each phase were proposed by the authors and asked for confirmation by the practitioners from HELP Logistics. Proposed tools as agreed by practitioners’ consensus are illustrated in the table. The rationale behind the selection of tools is presented below. Details of each tool and discussions on how a tool could contribute to the phases are presented in the next section. Employing a tool from the list may still need to be modified according to the context of disasters and organizations. It needs to be noted that this list is not exhaustive as there might be other tools that could be applied as long as they meet the objectives and characteristics of each disaster relief phase. The proposed basic tools in this manuscript are therefore the initial tools that need to be included in the HumSCAT.
3.2 Rationale behind the selection of assessment tools
Kovács and Spens (2007) and Cozzolino (2012) stated that the preparation phase focuses on how to have successful implementation of operational response. They further suggested that practitioners need to have a clear understanding of the current status relief chains (e.g. physical network structures, related information technology and collaboration among actors) and the disaster contexts (e.g. risks and consequences). Based on these characteristics, tools in this phase should help practitioners understand the nature, characteristics and flows of their existing relief chains. The tools should help practitioners identify who plays key roles in the chains and guide them on how to manage their chains when confronted with disasters. The output of the tools should allow one to design and plan the current phase and further help increase effectiveness and efficiency of the later phases. This manuscript proposes seven tools for the preparation phase (i.e. VSM, DPA, IDEF0, PSM, PAM, SLM and SCOR model).
As a disaster occurs, various operations are immediately implemented. Cozzolino et al. (2012) stated that there are two main consecutive objectives in the response phase. The first is “to immediately respond by activating the [existing] networks” and the second is “to restore in the shortest time possible the basic services and delivery of goods to the highest possible number of beneficiaries” (Cozzolino et al., 2012, p. 9). Thus, material and information flows are now activated and operated under limited resources and information (Kovács and Spens, 2007). Despite the fact that speed and shortest time responses are the key targets of this phase (Van Wassenhove, 2006; Oloruntoba and Kovács, 2015), unpredictable demand and supply make the phase become more dynamic and consequently create redundant activities (Kovács and Spens, 2007; Beamon and Balcik, 2008). Based on these characteristics, tools in this phase should assist practitioners in visualizing their existing relief chains, identifying actors and their key roles, and keeping them updated on the situation of their relief chains. Tools that help practitioners in managing the demand and supply are also necessary. The output of the tools should provide not only data for designing and planning the current phase but also data for managing the demand and supply. This manuscript proposes nine tools for the response phase (i.e. VSM, DPA, IDEF0, PSM, PAM, SLM, SCOR model, SCRM and DAA).
The recovery phase involves long-term rehabilitation and aims to recover the situation back to the default state (Kovács and Spens, 2007; Cozzolino et al., 2012). Kovács and Spens (2007) further stated that plans and operations of the previous phases need to be evaluated and revised and learning from past experiences is also a key of this phase. Transferring knowledge and sharing capabilities could increase the effectiveness and efficiency of the next relief efforts and decrease uncertainty (Scholten et al., 2014). Furthermore, Tatham and Hughes (2011) indicated that most performance measures often neglect the satisfaction of beneficiaries as satisfaction is more intangible. Based on these characteristics, tools in this phase should aim at assessing not only the “AS-IS” status of relief chains but also the performances in the previous phases of relief operations. Tools that assess beneficiaries’ satisfactions and the level of knowledge management should be included. This manuscript proposes ten tools for the recovery phase. Seven out of ten tools are proposed in order to meet the objectives of this phase (i.e. VSM, DPA, IDEF0, SCOR model, PDNA, SERVQUAL and KMAT). Three other tools are proposed in order to facilitate decision making and the design of the “TO-BE” status of relief chains (i.e. PSM, PAM and SLM). The output of these ten tools should provide useful information for later phases such as the mitigation phase and the latter preparation phase.
4. The “basic” tools proposed in the HumSCAT
In this section, details of the 12 tools as well as discussions on their potential contributions and future applications in humanitarian supply chains are presented.
4.1 Value Stream Mapping
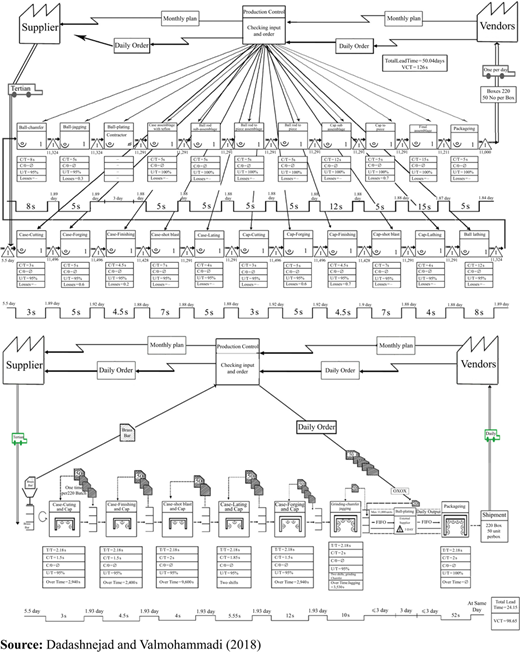
VSM aims at eliminating waste, revealing bottlenecks and leading to continuous improvement (Rother and Shook, 1999). It helps practitioners visualize the holistic view of their whole supply chain (Wee and Wu, 2009). It offers a simple set of visual symbols expressing activities and players in a supply chain. It contains performance indicators which encompass quality, cost and lead-time. The output of VSM is illustrated as the current and future state maps of the whole supply chain (see Figure 2).
There are examples of research in the supply chain management literature that used VSM. Wee and Wu (2009) demonstrated an application of VSM in implementing lean production and process improvement. Dadashnejad and Valmohammadi (2018) used VSM to identify operational losses across a manufacturing company’s production process. In the humanitarian relief context, the search result indicated one article that used VSM (i.e. Salvadó et al., 2015). This article employed VSM to visualize the relief chain in the response phase of Ebola outbreak. From these instances, employing VSM in the humanitarian relief context can allow practitioners to understand what is going on in their relief chains and help them map their current state maps as well as plan and design their future state maps. VSM is the basis and should be used in all phases of disaster relief.
4.2 Decision Point Analysis
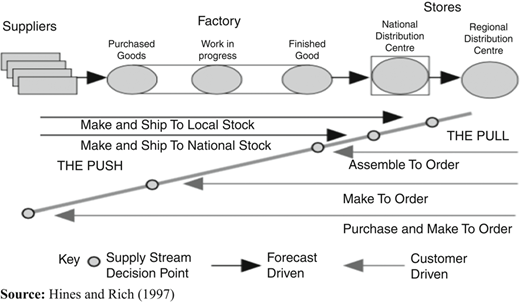
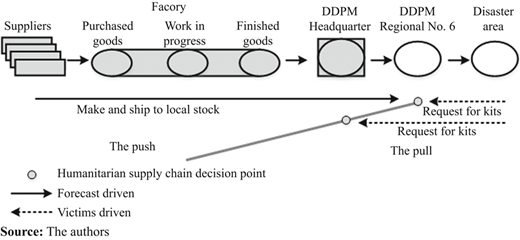
DPA, a tool considering efficient consumer response in logistics, is used to identify a point where customer pull meets the supply chain push (Hines and Rich, 1997) (see Figure 3). DPA helps decision makers know when to continue or stop producing a product. This ensures practitioners that the processes, i.e., downstream and upstream, are well-aligned but also facilitates them in redesigning their value streams (Hines and Rich, 1997).
In the supply chain management literature, there are studies using DPA. Vlachos and Bogdanovic (2013) employed DPA to identify push and pull strategies for hotel reservation processes. DPA is often applied at the supply chain level and can be used at the logistics level. Krishnamurthy and Yauch (2007) demonstrated that DPA can be used to determine the separate point of lean and agile in a firm’s departments. In the humanitarian relief context, no application of DPA was found. The principles of lean and agile coexist among relief phases (Scholten et al., 2010, 2014; Oloruntoba and Kovács, 2015); therefore, DPA should be used in all phases. It will help practitioners identify the decoupling point in their relief chains. DPA can help improve the effectiveness and efficiency of departments and functions in a relief organization.
4.3 Integration Definition for Function Modeling
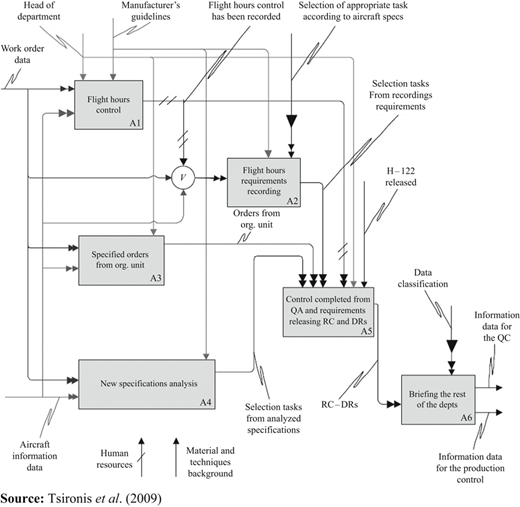
IDEF0 helps visualize subsystems and workflows by assessing the “AS-IS” status and other possible “things” existing in an organization or a system (Menzel and Mayer, 2004). The authors further defined “things” as any kind of functions and activities including inputs, outputs, mechanisms and controls (e.g. laws, policies, standards and other environmental factors). All data are recorded in terms of a set of syntax components where the boxes represent functions or activities and the arrows represent relationships among those functions or activities (see Figure 4). An effective IDEF0 model can promote involvement and collaboration among actors as well as serve as a guide for process reengineering (Romero et al., 2008).
There are studies in the supply chain management literature using IDEF0. Romero et al. (2008) employed IDEF0 to identify activities, actors and flows of a ceramic tile industry. Tsironis et al. (2009) used IDEF0 to identify workflows of aircraft maintenance processes. The search result indicated some articles that used IDEF0 in the field of disaster management. Bevilacqua et al. (2014) used IDEF0 to map an overview of hydro-geological risk management. Paciarotti et al. (2018) studied the case of emergency flood response by employing IDEF0 to identify the strengths and weaknesses of the relief chain. The results from the study were further used to enhance the efficiency and effectiveness of a spontaneous (informal) volunteer service administered by a relief organization. Thus, these instances suggest that IDEF0 can assist practitioners in identifying activating functions, suggesting what the current system does right or wrong, giving guidance on what is needed to be done further and finally improve decision making. In the response phase, there are problems such as oversupply, a high density of people in the disaster area and traffic congestion (Paciarotti et al., 2018). Managing messages, supplies, people, volunteers and logistics in a disaster area is then crucial. The use of IDEF0 is important and therefore appropriate for all phases of disaster relief.
4.4 Physical Structure Map
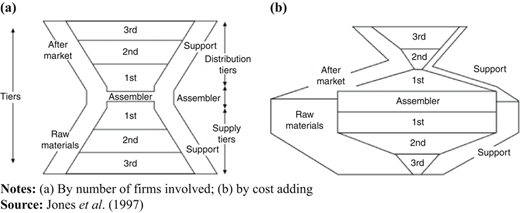
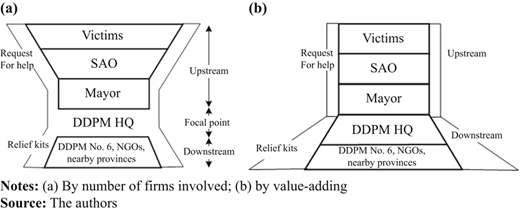
PSM provides an understanding of the structure of the supply chain and describes how the chain is operated (Hines and Rich, 1997). It offers two perspectives of supply chain structure (see Figure 5). One is the structural perspective which presents the numbers of tiers of suppliers and distributors. Another is the operational perspective which illustrates value-adding processes or, in other words, what the cost structure looks like.
In the supply chain management literature, Vlachos and Bogdanovic (2013) also employed PSM. Nevertheless, in the humanitarian relief context, the search result indicated no study using PSM. Employing such tool in the humanitarian supply chain context can allow practitioners not only to understand the structure of their relief chains but also to identify tiers of relief actors and costs added in each tier. PSM is appropriate for the preparation and response phases. Employing PSM in the recovery phase can help practitioners in designing the “TO-BE” stage of relief chains.
4.5 Process Activity Mapping
PAM is used for the purposes of process analysis, waste elimination, as well as process and flow rearrangement (Hines and Rich, 1997). The tool provides a diagram that presents the detailed break-down in supply chain processes consisting of various activity types (see Table II). These activities are described in terms of value-adding, non-value-adding, and necessary-but-non-value-adding operations. The result of this tool can serve as the basis for further analysis on supply chain improvement.
Applications of PAM exist in the supply chain literature. Taylor (2005) employed PAM to identify the activities in the current state map of agricultural-food supply chain. At the logistics level, Krishnamurthy and Yauch (2007) used PAM to capture the material and information flows between different departments and functional levels in a firm. However, in the humanitarian relief context, PAM was not found to be used. PAM can provide a detailed break-down detail of supply chain process and should be used in the preparation and response phases in order to help practitioners in mapping their current relief processes. For the purpose of process rearrangement, this tool should also be employed in the recovery phase in order to help design the “TO-BE” status of relief chains.
4.6 Swim Lane Mapping
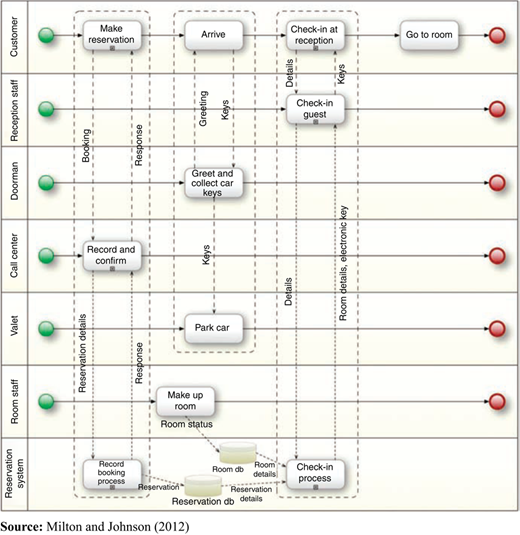
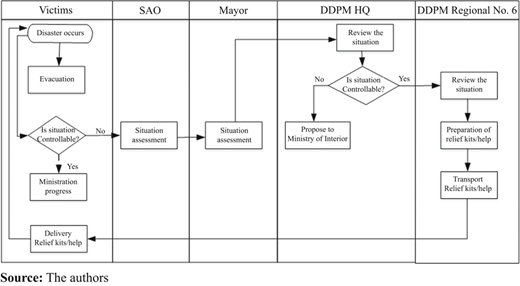
SLM offers a diagram showing the current and future state of process workflow (Sharp and McDermott, 2009). It helps identify “what” and “who” is involved in a process and presents these in terms of the role of each actor in a particular swim lane. Figure 6 describes that each box represents a task or step in a process, whereas each arrow connecting a box shows the sequential steps in the process.
SLM has been used by researchers in service management and the business process management context (Milton and Johnson, 2012; Aleem et al., 2015). In the humanitarian relief literature, the search result indicated one article that used SLM. Schumann-Bölsche et al. (2015) employed the tool to indicate actors involved in the humanitarian logistics chain in Cameroon. From this example, employing SLM in the humanitarian relief context can help visually distinguish job sharing and responsibilities of processes in relief chains and can help arrange workflows in relief operations. This tool is therefore appropriate for assessing the current state of the preparation and response phases and can be of further use in designing the future state map of the recovery phase.
4.7 Supply Chain Operations Reference model
The SCOR model assists firms in evaluating and improving their supply chain performance and management by helping improve alignments between supply chain processes and strategic objectives. The model focuses on five management processes (source, make, delivery, plan and return) and increases the level of details by investigating deep down into process elements, tasks and activities. Reviews on applications of SCOR model are described in the literature (e.g. Stewart, 1997; Huan et al., 2004). Readers who are interested in the SCOR model may further explore its official website (see APICS, n.d.).
The literature suggests that the SCOR model is a frequently used tool in the supply chain and humanitarian relief management fields (Abidi et al., 2014; Lu et al., 2016; Behl and Dutta, 2018). Lu et al. (2016) further stated that the SCOR model is useful for practitioners in evaluating their performance on many aspects (cost, efficiency and responsiveness) as well as allowing them to benchmark current performance against previous performance. This suggests that the SCOR model can help practitioners not only in evaluating performance but also in benchmarking among the various phases. Therefore, the tool can be used in all phases of disaster relief.
4.8 Supply Chain Response Matrix
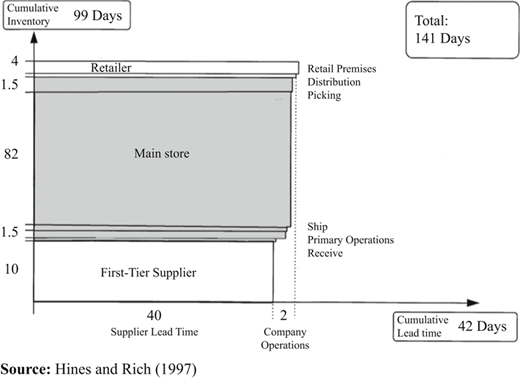
SCRM indicates lead-time constraints of processes within a company, distributors or suppliers (see Figure 7). This can help in the targeting of lead-times and inventory level, which are the basis for any process improvement (Hines and Rich, 1997).
SCRM is another useful tool used in supply chain analysis. Seth et al. (2008) employed SCRM to identify lead-time constraints in the supply chain of the cottonseed oil industry. In the humanitarian relief context, the search result indicated no article using SCRM. Employing this tool in humanitarian supply chains can help indicate lead-time constraints of relief processes. The tool can assist practitioners in managing their relief supplies, especially, in the response phase as this phase requires more dynamic responses than the other phases.
4.9 Demand Amplification Analysis
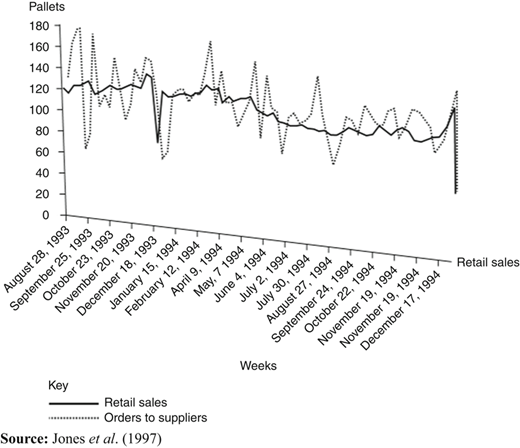
DAA visualizes demand fluctuations that are amplified from downstream to upstream (Hines and Rich, 1997). The diagram portrayed by this tool shows the change of demand in the value stream and the inventory size at different stages of production periods (see Figure 8). The result of this tool can be the basis for further analysis related to supply chain redesign and fluctuation management (Hines and Rich, 1997).
Studies in supply chain management that used DAA are Taylor (2005) and Vlachos and Bogdanovic (2013). The former employed the tool to identify demand amplification impact on agricultural-food supply chain. The latter used the tool to identify demand amplification in the hotel supply chain. Based on the literature, no study was found using DAA in the humanitarian relief context. DAA can be used in the response phase as it captures dynamic patterns of demand fluctuation. This is useful when practitioners manage demand fluctuations throughout the humanitarian relief responses.
4.10 Post-Disaster Needs Assessments Tool
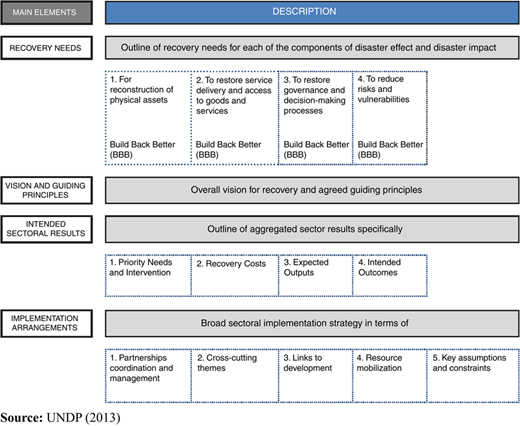
PDNA provides a guide for practitioners who desire to assess their capabilities of post-disaster recovery. It consists of common minimum standards that are not limited to any kind of disaster (UNDP, 2013). The output of PDNA helps facilitate decision making of actors involved in relief chains and long-term recovery needs (Hinzpeter and Sandholz, 2018). Figure 9 depicts the recovery strategy in PDNA.
PDNA is well known among practitioners (see examples in GFDRR, 2014) and often initiated by the governments of affected countries (Hinzpeter and Sandholz, 2018). However, Hinzpeter and Sandholz (2018) further indicated that there is a lack of involvement by staff from other sectors and the tool has received little attention in the academic field. In the humanitarian relief context, planning and operations in the previous phases need to be evaluated and revised in the recovery phase (Kovács and Spens, 2007), Banomyong et al. (2017) indicated a lack of research related to performance measurement in the recovery phase. Consistent with these authors, no academic article uses PDNA. Using PDNA from the perspective of the humanitarian supply chain management will reflect more contribution of the tool and support improved relief performance. The output from the tool can increase the effectiveness and efficiency of recovery efforts and mitigation strategies in later phases.
4.11 Service Quality Model
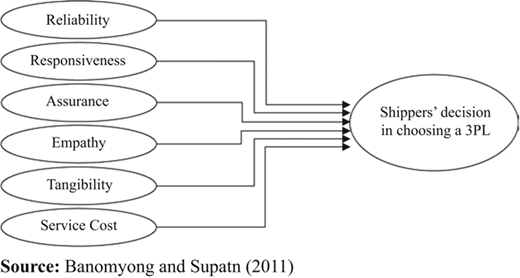
SERVQUAL is a diagnostic tool developed by marketing researchers for assessing a firm’s service quality (Parasuraman et al., 1991). It consists of five service elements: tangibility, reliability, responsiveness, assurance and empathy. SERVQUAL is based on the conceptual model proposed in Parasuraman et al. (1985). The model suggested that the service quality can be appraised by examining gaps between customer’s expectation and customer’s perception of service quality.
The original SERVQUAL was developed based on data collected from particular service businesses. Using it, in other contexts, therefore needs some modifications. Stanley and Wisner (2001) indicated that many studies in the supply chain management successfully fine-tuned the model and tool with some modifications. In order to increase the service quality of logistics service providers, Banomyong and Supatn (2011) illustrated that a modified SERVQUAL can be used as the basis model to capture and identify a set of freight logistics service attributes (see Figure 10). However, the review indicated no application of SERVQUAL in the humanitarian relief literature. Tatham and Hughes (2011) suggested that there is a need for a measure to report on the aid service quality from beneficiaries’ perspectives. SERVQUAL can serve this need. Often, relief organizations prefer to use financial measures as these allow them to report back to their donors on how well they used donations received (Tatham and Hughes, 2011). SERVQUAL can serve as a complementary tool to these measures. The tool can help identify the gap between expected service level of aid and the perceived actual service level of aid delivered. Practitioners can then improve the effectiveness of relief operations in case that the gaps are statistically significant. Furthermore, considering the scope of customers from the perspective of Maon et al. (2009), SERVQUAL can be used to assess the service quality gaps perceived not only by beneficiaries but also from outside stakeholders.
4.12 Knowledge Management Assessment Tool
KMAT is a diagnostic tool recommended by researchers in the knowledge management literature (Hiebeler, 1996; De Jager, 1999; Mertins et al., 2003). KMAT helps organizations analyze how well they manage their knowledge process in comparison with other companies (Hiebeler, 1996). KMAT method consists of a questionnaire (see AMCES, n.d.) containing a set of 24 knowledge management practices that are designed based on the core activities of the knowledge management process (share, create, identify, collect, adapt, organize and apply) and are presented within five organizational enablers (process, leadership, culture, technology and measurement).
Despite the fact that knowledge management is key to supply chain management, Cerchione and Esposito (2016) indicated a lack of the active knowledge management in supply chain management and a lack of links between knowledge management practices and firms’ performance. These authors further suggested that the process of knowledge management can increase supply chain performance on four aspects (i.e. financial, market, technical and organizational). In the field of humanitarian relief, unsurprisingly, no academic reference was found. KMAT can allow relief organizations to determine the effectiveness of their knowledge management practices. The use of this tool can help improve four aspects in the performance of relief operations: financial (cost efficiency and amounts of donations), market (aid responsiveness, service quality and reputation), technical (skills and core competencies) and organizational (collaboration among actors).
Table III illustrates examples of advantages and limitations of each proposed tool and suggests their future applications in the humanitarian relief context. A case study conducted in Thailand was used not only to validate the HumSCAT but also to demonstrate how practitioners might use this toolbox.
5. The Thai validating case study
Case study is a frequently used methodology in humanitarian supply chain research (Kunz and Reiner, 2012). It is good at exploring real-world situations as well as being suitable for developing new theoretical propositions (Voss et al., 2002; Yin, 2013). Yin (2013) further stated that researchers can use a single case study as a starting point to validate their propositions.
To understand how the HumSCAT can be applied, a case study is used to illustrate. Thailand as a country often encounters various types of disasters. The Thai Ministry of Interior is the main agency and the Department of Disaster Prevention and Mitigation (DDPM) has direct authority. Its responsibility is to handle disasters, prevent disaster damages and losses, and mitigate calamity caused by man-made or natural disasters. The DDPM Regional Office No.6 (hereafter the DDPM regional office) is a department in the DDPM that is responsible for Khon Kaen and four other provinces in Northeast Thailand. It has an obligation to carry out tasks and take responsibility for disaster prevention and mitigation. The DDPM has the responsibility to manage flood and drought situations as well as to create awareness and preparedness among the population when a disaster occurs.
In order to validate the HumSCAT, data collected should have come from all phases of disaster relief. However, at the time of data collection, there was no disaster response on the ground. The assessed relief chain at the DDPM regional office was therefore focused on the preparedness phase. There were also some limitations related to data sources access. This meant that only six tools proposed in this phase were tested for further validation (VSM, DPA, IDEF0, PSM, PAM and SLM). Future research should validate the SCOR model proposed in the preparation phase and the other tools proposed for the response and recovery phase of the HumSCAT.
Data were collected by two trained research staff. It took about one week to fully audit the organization’s relief chain. The data collection method was based on a set of standard interview protocols and semi-structured questions. The three main respondents were government officers with management role (director of the DDPM regional office, head of Prevention and Operation Unit, and head of Emergency Relief). Two others respondents were field officers. Recorded data were analyzed and triangulated with other archival data provided by the organization. A description of the six tools is provided hereunder.
5.1 Value Stream Mapping
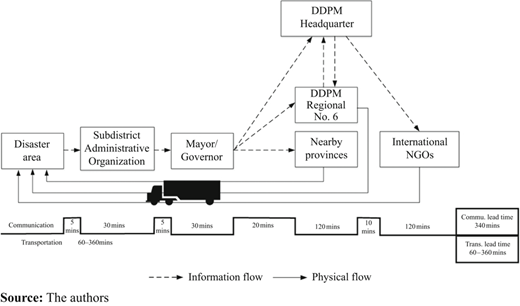
VSM was employed to offer a holistic view and to map process and networks of the relief chain. Figure 11 describes information and physical flows of the organization in a situation where a disaster occurred. The information flow starts with a notification about the disaster affecting people in the area. Notification of disaster is received via a phone call by the Sub-district Administrative Organization (SAO). The SAO’s role is to evaluate the situation before relaying information to an authorized person (e.g. mayor or governor) and asking for relief effort permission. After permission is granted, the authorized person informs either the director general of DDPM in charge at the DDPM headquarters, the DDPM regional office in Khon Kaen Province, nearby provinces or all of them. The lead-time spent in evaluating the disaster situation is approximately 2 h. The identified total communication and transportation lead-time were 340 min and 60–360 min, respectively. The results provided the initial understanding of existing process flows and time spent for the relief process.
5.2 Decision Point Analysis
DPA was used to determine the decision point in the relief chain. This is where the actual demand pull will meet the forecast-supply push. In Figure 12, there are two decision points lined up between suppliers and the disaster area. One is located at the DDPM headquarters and the other one at the DDPM regional office. The result provides two basic understandings. First, DPA can indicate and separate supply chain processes into downstream and upstream sections according to the pull and push principles. In the initial level of analysis, DPA can allow people in charge to design various types of “what if” scenarios and observe what would happen if a decision point is moved. This can help give decision maker the opportunity to improve and redesign their relief supply chains.
5.3 Integration Definition for Function Modeling
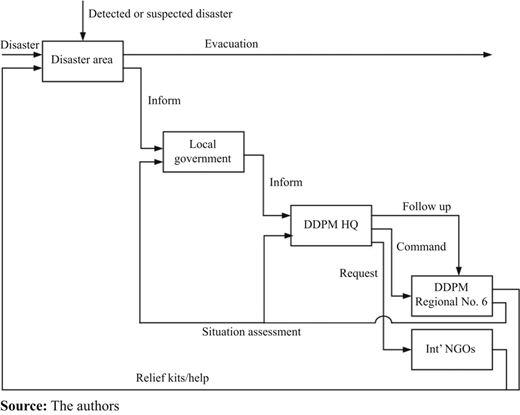
IDEF0 was used to identify activities and their relationships in the relief chain. Figure 13 presents the relief chain and depicts activities (boxes) and decision flows (arrows) which are interacting with each other, inside and outside the system. The result of IDEF0 suggests that there are five main actors in the chain interacting with each other. The relationships among the actors were defined in terms of communication activities (detect, inform, command, assess, follow up, request, help and evacuate). As shown in Figure 13, IDEF0 can illustrate how all actors are involved in the relief chain by describing the information flow between these actors. The first type of information flow, a bi-directional information flow, is the flow between the DDPM headquarter and the DDPM regional office. Another type, unidirectional information flow, is the information flow between, for example, the disaster area and local government. The output of the tool can be used to enhance collaboration among actors and help guide stakeholders’ organizations in redesigning their relief chain.
5.4 Physical Structure Map
PSM was used to investigate the structure and mechanism of the relief chain. Figure 14 depicts two diagrams according to different perspectives of the investigation. The first diagram shows how many actors or tiers were involved in the chain. This tool indicated that the DDPM headquarters were in the middle of the chain and were connected to three tiers in the upstream path (i.e. victims, the SAO and the mayor) and one tier in the downstream path (i.e. the DDPM regional office, NGOs and the nearby provinces). The second diagram presents the value-adding part of the chain. Two major value-adding processes involved the relief organizations and the DDPM headquarters while the other supporters did not provide any further value-adding. The result of the tool not only captured the tiers and actors involved in the relief chain but also located the value-adding areas of the chain.
5.5 Process Activity Mapping
PAM was employed to detect activities and waste in the relief chain. Table IV shows ten activities and time spent. The activities were classified based on two aspects: activity types (operation, transportation, storage, inspection and delay) and operational types (value-adding, non-value-adding and necessary-but-non-value-adding). The operational types were further analyzed in terms of time spent compared to number of activities (see Table V). The results show that the processing time from receiving the request by affected people to distributing relief supplies is 550 min (23 h). However, most of the time spent is non-valued added activities (NVA) and non-value added but necessary activities (NNVA). These NVA and NNVA were informed to the organizations involved in this relief supply chain for further supply chain redesign and process improvement.
5.6 Swim Lane Mapping
SLM helps identify actors and distinguish their roles in the relief chain’s process flow. Figure 15 shows that actors and their activities were sequentially arranged from left (starting point) to right (ending point). In each swim lane, the responsibility of each actor is recorded. The arrows representing the information flows illustrate the connections between activities and the links between actors in the different swim lanes. In the diagram, the process started when notification of people affected was sent to the SAO and ended when affected people received aid. There were two decision-making points: the point where the affected people initiated disaster pre-evaluation and the point where DDPM headquarters provided aids. SLM not only revealed the entire operation but was able to identify all decision-making points in the relief chain. SLM helped visualize current process flow and its results can guide the design of future process flow.
6. Conclusions
The contributions made by this manuscript are twofold. First, it proposes a toolbox for assessing the “AS-IS” status of relief supply chains. The HumSCAT is comprised of a suite of basic tools sorted accordingly to the phases of disaster relief. The HumSCAT consists of seven tools in the preparation phase, nine tools in the response phase and ten tools in the recovery phase. Only six tools proposed in the preparedness phase were validated in this case study. These six tools are applicable and can provide useful information that can be used for further process improvements and increase the effectiveness and efficiency of organization’s relief chain. It needs to be noted that the list of proposed tools in HumSCAT is not new. However, the approach to develop such a toolbox is novel for the humanitarian context.
It is well known that there are many assessment tools that are often dispersed between various disciplines but access to these tools may not be available for practitioners with limited access to academic literature. Since the audiences of this publication also include practitioners involved in humanitarian relief, this manuscript has therefore illustrated a variety of relevant tools that could be useful for these practitioners. An assessment of the “AS-IS” status of relief chains is the basis for performance measurement and performance indicators as well as for redesigning and reengineering humanitarian supply chains (Lambert et al., 1998; Christopher and Peck, 2004; Bevilacqua et al., 2014; Scholten et al., 2014). The HumSCAT can serve as a reference for academics and practitioners who desire to assess and improve relief supply chains. The use of HumSCAT is not limited to relief organizations or NGOs. Banomyong and Julagasigorn (2017) stated that private firms involved in relief operations would be interested in assessing its performance. Additionally, the “AS-IS” status obtained with the tools in HumSCAT of relief chains and lessons learned from previous phases is a prerequisite for the mitigation phase (Scholten et al., 2014). Policy makers can use this “AS-IS” information, provided by the HumSCAT, to further design the “TO-BE” status of relief supply chains as well as to develop plans and policies for the mitigation phase.
The research conducted in this manuscript was partially funded by the Kuehne Foundation.