


The purpose of this paper is to improve the relief procurement process as one of the most important elements of humanitarian logistics. For doing so, a novel two-round decision model is developed to capture the dynamic nature of the relief procurement process by allowing demand updating. The model accounts for the supply priority of items at response phase as well.
A mixed procurement/supply policy is developed through a mathematical model, which includes spot market procurement and a novel procurement auction mechanism combining the concepts of multi-attribute and combinatorial reverse auctions. The model is of bi-objective mixed-integer non-linear programming type, which is solved through the weighted augmented e-constraint method. A case study is also provided to illustrate the applicability of the model.
This study demonstrates the ability of proposed approach to model post-disaster procurement which considers the dynamic environment of the relief logistics. The sensitivity analyses provide useful managerial insights for decision makers by studying the impacts of critical parameters on the solutions.
This paper proposes a novel reverse auction framework for relief procurement in the form of a multi-attribute combinatorial auction. Also, to deal with dynamic environment in the post-disaster procurement, a novel two-period programming model with demand updating is proposed. Finally, by considering the priority of relief items and model’s applicability in the setting of relief logistics, post-disaster horizon is divided into three periods and a mixed procurement strategy is developed to determine an appropriate supply policy for each period.
Nomenclature
- Indices and sets
- I1
set of suppliers (i.e. bidders) who constructed their bids in the first period, indexed by i
- I2
set of suppliers (i.e. bidders) who constructed their bids in the second period, indexed by i
- S1
set of suppliers with pre-specified agreement, indexed by s
- S2
set of suppliers who are available in the spot market, indexed by s
- Ji
set of bids placed by buyer i, indexed by j
- K1
set of first-level (urgent-immediate) items/services, indexed by k ∈K1
- K2
set of second-level (medium-priority) items/services, indexed by k∈K2
- K3
set of third-level (low-priority) items/services, indexed by k∈K3
- B
number of buyers (i.e. HOs) in the first period, indexed by b
- B′
number of buyers (i.e. HOs) in the second period, indexed by b
- Z
number of attributes, indexed by z
- L
number of offered delivery times, indexed by l
- Parameters
unit shortage cost of item k in the second period
unit delay cost of item k
- hk
unit holding cost of item k
- Ik
prepositioned inventory level of item k
- αk
proportion of prepositioned inventory of item k that is destroyed by the disaster
- qsk
promised delivery quantity of item k by supplier s∈S1 according to the pre-specified agreement
- psk
the percentage of stocked material of item k at supplier s∈S1 that remains usable at post-disaster
- csk
unit purchase price of item k from supplier s∈S2 (spot price)
- Dbk
demand of buyer b for item k in the first period
demand of buyer b for item k in the second period
maximum demand of item k in the second period that is estimated in the first period
minimum demand of item k in the second period that is estimated in the first period
- mk
probability of observing maximum demand of item k in the second period
- nk
probability of observing minimum demand of item k in the second period
- qijk
quantity of item k in jth bid of supplier i in the first period
quantity of item k in jth bid of supplier i in the second period
- Lijl
lth delivery time of bundle in jth bid of supplier i
score for supplier i, bid j and delivery time l with respect to non-price attributes in the first period
score for supplier i, bid j and delivery time l with respect to non-price attributes in the second period
score for supplier i, bid j and delivery time l with respect to price attributes in the first period
score for supplier i, bid j and delivery time l with respect to price attributes in the second period
- pLijl
price of the bij related to lth delivery time and corresponding quantity of the bundle in the first period
price of the bij related to lth delivery time and corresponding quantity of the bundle in the second period
- ddk
due date of item k
- bu
available budget in the first period
- bu'
available budget in the second period
- Rk
reordering cost of item k in the second period
- dk
amount of in-kind donation of item k in the second period
- INVsk
on-hand inventory of item k at supplier s in the first period (i.e. the maximum quantity that could be supplied by this supplier)
on-hand inventory of item k at supplier s in the second period
- First-period decision variables
- yLijl
1, if lth delivery time in jth bid of supplier i is selected in the first period, 0 otherwise
- INVk
inventory of item k at the end of the first period
- sk
shortage quantity of item k in the first period (which might be satisfied in the second period)
- Xsk
order quantity of item k∈K1 from supplier s∈S2 in the first period
- Second-period decision variables
1, if lth delivery time in jth bid of supplier i is selected in the second period, 0 otherwise
order quantity of item k∈K2from supplier s∈S2 in the second period
inventory of item k at the end of the second period
shortage quantity (unmet demand) of item k in the second period
1. Introduction
The growing number of disaster victims in the last decades has reemphasized the importance of providing relief supplies on time and in adequate quantities for saving lives and mitigate the disaster impacts. Hence, the success of relief operations highly depends on logistical planning (Thomas and Kopczak, 2005). One of the most important issues in humanitarian logistics is procurement planning to make sure that the humanitarian organization (HO) has the essential relief resources to meet the operational requirements at post-disaster. The optimal decisions on transportation, storage and distribution of relief items are affected by procurement-related decisions made by relief organizations. Also, procurement process of relief items ultimately can influence the efficiency of humanitarian supply chains and relief items’ delivery. Blecken and Hellingrath (2008) estimate that procurement activities account for 65 percent of expenditures in disaster relief logistics. Despite that importance, the current literature on humanitarian relief logistics has focused primarily on problems of facility location (Balcik and Beamon, 2008), inventory management (Beamon and Kotleba, 2006a, b) and transportation (Barbarosoğlu et al., 2002; Nolz et al., 2010), while the procurement area has received little attention. Hence, there is a strong need for designing suitable procurement models to improve the performance of humanitarian operations.
Similar to commercial supply chains, responsiveness and cost-efficiency are the most important factors in humanitarian relief chains, which can be improved by proper procurement planning. In practice, HOs can procure their required relief items in pre-disaster (for the purpose of inventory prepositioning) and/or post-disaster, which are referred to proactive and reactive approaches, respectively. Although inventory prepositioning can lead to quick delivery of relief supplies to the affected people at post-disaster, it can be very ineffective if the demand surge is high and also it can lead to underutilized resources especially when the disasters are not frequent or if the demand is low (Beamon and Kotleba, 2006a). When a disaster occurs, relief organizations are interested in procuring the required extra relief items in large amounts while it is not economic to pre-position large amounts of such inventories at pre-disaster.
According to the above discussion, utilizing effective supply methods at post-disaster to acquire needed extra relief items under resource limitations is necessary. Therefore, the post-disaster procurement, which is the main domain of this study, is unavoidable due to unpredictability of disaster demand (Balcik et al., 2010).
A procurement auction (i.e. reverse auction) is an effective way to provide the required relief items. It has already been utilized by several HOs such as Fritz Institute and FEMA (Alp Ertem and Buyurgan, 2011). Although procurement auctions have frequently been used successfully in the commercial setting (Iftekhar et al., 2013; Buer and Kopfer, 2014; Hsieh and Lin, 2012), their applications in the disaster relief setting need a thorough and practical investigation. The most important reason for applying reverse auctions in the relief procurement is to utilize the available inventory of suppliers (especially regarding scarce resources) more efficiently for humanitarian logistics.
One of the main challenges of post-disaster procurement is related to the dynamic characteristics of disastrous events where the incomplete and inaccurate demand information provided by the initial need assessment process at the early post-disaster can just be improved over the time as the disaster might still evolve during the initial response leading to an increased demand size. For example, in the case of 2005 South Asia earthquake, an initial estimate was to aid 30,000 families. This estimate was increased to 150,000 families when new information was received about the damage scale (Davidson, 2006). In this situation, the decision makers need to make different decisions at several time slots (i.e. the required recourse actions) based on the available real-time information. In conclusion, revising the procurement plan based on the most recent demand data about the required relief items through the final need assessment process is quite vital.
To address this concern, the present work develops a novel two-round procurement model under an ongoing fashion which allows the decision maker to place two separate orders at two different periods and modify the initial procurement amounts whenever updated demand data are unfolded. Our developed model combines the concepts of multi-attribute reverse auction with combinatorial reverse auctions. It can lead to significant time saving (i.e. better responsiveness) by jointly providing complementary commodities (e.g. beds and blankets, food and water) through bundle bidding and considering non-price attributes such as delivery time that are vital factors in the relief environment. Also, cost-efficiency is significantly improved through price competition between multiple bidders. At the following, we first review the relevant research streams and then elaborate on our contributions through the gap analysis.
2. Literature review
In this section, we review the literature in two separate but relevant research streams.
2.1 Procurement in humanitarian logistics
Although there are considerable numbers of studies addressing the inventory prepositioning as the most applied pre-disaster relief supply policy, there is relatively few research works about the post-disaster relief procurement. Due to the aforementioned reasons in the previous section, pre-disaster procurement is not sufficient alone and post-disaster procurement is unavoidable due to unpredictability of relief demand raised by disasters. Thus, the recent studies have highlighted the post-disaster supply policies mainly in the form of reverse auctions (Ertem et al., 2012; Shokr and Torabi, 2017; Dabbagh et al., 2018) and their integration with the relief prepositioning and contractual agreements at pre-disaster (Balcik and Ak, 2014; Wang et al., 2015; Hu et al., 2017; Torabi et al., 2018; Hu and Dong, 2019). Most of the relevant studies are based on auction and non-auction approaches, which are reviewed at below.
2.1.1 Non-auction-based approaches
Falasca and Zobel (2011) proposed a two-stage stochastic programming (TSSP) approach with recourse for procurement in HOs. In the first stage, procurement decisions are made before realizing the uncertain parameters, which include the demand level for each relief item and the sizes of monetary and in-kind donations. In the second stage, according to the realized demand of relief items and the available resources, the required recourse action is performed to compensate the decisions made in the first stage. Liang et al. (2012) presented an option contract for a relief supply chain with one buyer and one supplier. Their research showed that a feasible range of prices, which is profitable for both the buyer and the supplier, can be found with the designed option contract. Balcik and Ak (2014) addressed a supplier selection problem in the humanitarian relief setting by establishing framework agreements and developed a scenario-based stochastic programming model for the problem. They considered a quantity flexibility contract between a relief organization (buyer) and suppliers by which the suppliers reserve needed relief items and commit to supply them at post-disaster according to the contract’s requirements. Hu et al. (2017) developed a TSSP model by integrating prepositioning and post-disaster procurement decisions with supplier selection. Torabi et al. (2018) presented a novel two-stage scenario-based mixed fuzzy-stochastic programming model, which integrates the prepositioning and post-disaster procurement decisions based on a quantity flexibility contract. Finally, Hu and Dong (2019) proposed a TSSP model for joint relief prepositioning and supplier selection decisions under disruption risks.
2.1.2 Auction-based approaches
Ertem et al. (2010) considered an auction-based framework for procuring relief items in post-disaster, which includes the announcement construction, bid construction and bid evaluation phases. Two mathematical models were developed for winner determination in a framework including multiple auctioneers and multiple bidders. In another similar work, Alp Ertem and Buyurgan (2011) developed an auction-based procurement framework with considering multiple bidders and one auctioneer. Two integer programming formulations were developed for the bid construction and bid evaluation phases. Ertem et al. (2012) presented an analysis of the bid construction phase of procurement auctions in humanitarian logistics with considering substitution and partial fulfillment options. They used three solution approaches including a genetic algorithm, a simulated annealing algorithm and an integer programming model for the analysis of the bid construction phase with different announcement options. Shokr and Torabi (2017) proposed an enhanced reverse auction framework to procure required relief items at post-disaster, which includes the bid construction and bid evaluation phases under the epistemic uncertainty of input data.
2.2 Procurement in commercial logistics
Different auction-based procurement models have been used successfully in the commercial logistics that could be helpful for the humanitarian supply chains. In this regard, multi-attribute and combinatorial reverse auctions are the most applied reverse auction models, which are commonly used in the commercial setting (see e.g. Pekeč and Rothkopf, 2003; Hsieh, 2010; Hsieh and Lin, 2012; Rao, Zhao and Ma, 2012; Huang et al., 2016) but they have not been applied in the relief setting so far. At below, we provide a brief review of the characteristics of these reverse auctions in the setting of commercial logistics.
2.2.1 Multi-attribute reverse auctions
Multi-attribute reverse auctions enable negotiation on price and non-price attributes such as quality and delivery lead time, which can lower the risk of purchasing low-quality products at lower prices. Although this type of reverse auctions is more complicated than the traditional reverse auctions, but several studies (Cheng, 2008; David et al., 2006; Chen-Ritzo et al., 2005) demonstrate that the multi-attribute auctions produce more utility for the buyer than single-attribute auctions. Nevertheless, since profit making is not the goal in relief logistics, the challenge is selecting those suppliers who present the best possible combination of price and desired non-price attributes (such as high quality, short delivery time and high reliability). In this context, a multi-attribute reverse auction mechanism could be very effective in addressing this challenge well.
2.2.2 Combinatorial reverse auctions
The foundation of combinatorial reverse auctions is allowing each bidder to offer a bundle of items or tasks according to their personal preferences. This type of reverse auctions can lead to significant time saving which is a vital factor in the relief environment. Compared to the traditional reverse auction mechanisms, by using a combinatorial reverse auction, bidders can reduce the risk of providing only a subset of items that is not worthy compared to a complete set (Sandholm, 2002). In the relief domain, in particular, when different items or tasks must be procured at the same time, a reliable procurement framework could be of a combinatorial auction type. Under a combinatorial reverse auction, the buyer would be able to concurrently purchase multiple items with the lowest prices from a set of sellers each of which can provide a set of items. Combinatorial reverse auctions have attracted much attention recently due to their significant cost and time savings and wide potential applications (Andersson et al., 2000). For example, Hsieh and Lin (2012) proposed two different combinatorial reverse auction models demonstrating that the group-buying-based combinatorial reverse auction is better than multiple independent combinatorial reverse auctions in terms of performance and computational efficiency.
2.3 Gap analysis
As mentioned earlier, post-disaster procurement is unavoidable due to unpredictability of location, timing and severity of a disaster and a relief organization typically needs to make its major procurement decisions at post-disaster. Despite this fact, surprisingly the literature lacks comprehensive quantitative models to address post-disaster procurement. Also, several relief items with different priorities, lead times and supply constraints must be distributed to affected areas whose procurement plans can affect the post-disaster response significantly. As literature displays, although there exist few studies considering the priority of items (Van Wassenhove and Tomasini, 2003; Sheu, 2010; Chiu and Zheng, 2007; Alp Ertem and Buyurgan, 2011), none of them considers a suitable supply method while accounting for the priority of items.
Furthermore, despite the dynamic characteristics of disastrous events for which the initial incomplete and inaccurate demand information are improved and updated over the time during the post-disaster phase, there is no mathematical model addressing this dynamic issue in the post-disaster procurements. Notably, although several dynamic procurement models have been developed in the context of business supply chains using different strategies such as multiple sourcing and multiple ordering opportunities (Choi and Sethi, 2010; Inderfurth et al., 2013), there is very limited research in the relief setting under dynamic demand conditions. Therefore, there is an urgent need for developing novel post-disaster procurement policies under dynamic demand conditions. To fill this gap, this paper aims to develop a novel decision model for the post-disaster procurement, which benefits from demand updating to deal with incomplete and uncertain demand information at the early post-disaster. Notably, HOs can obtain some demand-related information about the location, required relief items and their priorities at early post-disaster. However, information about the demand sizes is typically incomplete (limited) at this stage and tainted with high uncertainty because of dynamic nature of a disastrous situation. Also, at early post-disaster, demand data may come from diverse and unreliable sources while there is no enough time for verification of received data, thus leading to untrustworthy data. Therefore, to cope with such demand uncertainty, we consider a two-round decision model in which the supply decisions are made in two separate parts (details of these decisions are described in the Problem description section).
Furthermore, inspired by the procurement auctions in the commercial logistics, this study develops a novel procurement auction model, which combines the concepts of multi-attribute auctions with combinatorial auctions in order to benefit from their advantages concurrently. As the literature indicates, there are several studies about implementing procurement auctions at post-disaster (e.g. Ertem et al., 2010, 2012; Alp Ertem and Buyurgan, 2011; Shokr and Torabi, 2017). However, we propose a novel procurement auction, which differs from current studies mainly in three aspects. First, according to the experts’ opinions of the logistics department of Iranian Red Crescent Society (IRCS) and also following the extant literature (Van Wassenhove and Tomasini, 2003; Sheu, 2010; Chiu and Zheng, 2007; Alp Ertem and Buyurgan, 2011), we differentiate between the supply priority of various relief items at post-disaster and consider three priority levels including the urgent-immediate or the first-level items (such as medical kits, shelters and conserved food), medium-priority or the second-level items (such as hot meals, sugar, tea and rice) and low-priority or the third-level items (such as cleaning supplies). Furthermore, the response phase horizon at post-disaster is divided into the three different time periods to reflect the suitable response times for distributing the relief items of different priorities at post-disaster. That is, the first, the second- and the third-level items will be needed during the first, second and third periods, respectively. In this way, the first period includes the first three days at early post-disaster, the second period consists of the following three to five days and the third period includes the next five to seven days. Consequently, we develop a novel mixed relief supply policy, comprising of inventory prepositioning, spot market procurement and a novel reverse auction mechanism for providing the required items at post-disaster while accounting for their priorities. Second, a two-round decision model with information updating is developed by which two decision rounds are performed in the beginning of the first and second time periods based on the demand data received through the initial and final need assessment processes to provide the required relief items of different priorities.
It is worth noting that the proposed procurement auction can also be used in the preparedness and specially recovery phases, while the relief procurement in the response phase is the main domain of this study in order to procure the required extra relief items at early post-disaster.
3. Problem description
The main phases of a procurement auction include the bid construction and bid evaluation that are managed by the suppliers (i.e. the bidders) and the buyer (i.e. the auctioneer), respectively. In the bid construction phase, suppliers evaluate the announced auction and construct their bids while considering their objectives and constraints. Afterwards, in the bid evaluation phase, the auctioneer assesses the received bids in order to determine the winning bid(s) by utilizing a winner determination model. This study focuses on the bid evaluation phase of a procurement auction in the context of disaster relief. The procurement auction considered in this study involves multiple suppliers and a HO as the auctioneer. Timely provision of the required relief items and earning economic benefits are the objectives of HO and suppliers, respectively. HO announces its basic requirements and the scoring rules to all the potential suppliers and uses a multi-attribute combinatorial reverse auction model as the winner determination model. At below, we elaborate on the main features, assumptions and mathematical formulation of the proposed reverse auction model.
3.1 Bid structure
Let K1={1, 2, …, k1}, K2={k1+1, …, k2} and K3={k2+1, …, K} denote the sets of the first-, second- and third-level items, respectively, and K is the total number of items requested by HO. In the response phase of a disaster, acquiring the right amount of high-quality relief supplies at the right time and their rapid while reliable delivery by HOs is crucial (Shahadat, 2003). Accordingly, we develop a multi-attribute combinatorial reverse auction by which each submitted bid is required to include the delivery date as well as other attributes such as price, quantity, quality and probability of on-time delivery. Each supplier i∈{1, 2, …, I} submits a set of bids j∈{1, 2, …, Ji} according to its on-hand inventories, where Ji is the number of bids (i.e. bundles) placed by supplier i. In this paper, we use the vector bij=(qij1, qij2, …, qijK, Lij1, Lij2, …, LijL, pLij1, pLij2, …, pLijL, xij1, xij2, …, xijZ) to represent the jth bundle submitted by supplier i, where qijk denotes the quantity of kth item (k=1, …, K) in this bid, Lijl is the lth option (l=1, …, L) of the delivery time in this bundle, and pLijl denotes the price of the lth option. It is noted that the delivery times are specified in an ascending order, i.e. Lij1<Lij2<⋯<LijL. Also, since each supplier would charge a higher/lower price for a faster/slower delivery, we consider the bundle prices in a descending order, i.e. pLij1>pLij2>⋯>pLijL. Furthermore, xijz denotes the value (i.e. importance weight) of zth non-price attribute (z=1, …, Z), such as the quality and probability of on-time delivery in this bundle. We represent the value of non-price attributes in a scale of 1–10, where 10 represents the lowest value and 1 represents the highest value. The proposed procurement auction model allows HO to incorporate various characteristics (i.e. price and non-price attributes) that are important in the context of relief logistics so that the HO can make the best decision with respect to the available budget while accounting for other constraints. It also enables several suppliers to place their multi-attribute bids for different combinations/bundles of relief items and allows HO to purchase multiple items of a bundle simultaneously leading to significant cost and time savings (as the result of quantity-based discounts and procuring complementary commodities simultaneously), which are so helpful in the context of relief logistics.
3.2 Winner(s) determination model
Supplier selection is one of the most important parts of the procurement process especially when there are significant differences among suppliers. In addition, the dynamic nature of disaster response impacts the preferences of HO in the supplier selection. For example, in the early hours of a disaster, a supplier with faster delivery but higher price may be preferred to a supplier with slower delivery but lower price. Therefore, in order to reflect various aspects of the supplier selection and determine the winner(s) in the proposed reverse auction, we define the following scoring functions which consider interrelationships between the price and non-price attributes:
where and denote the scores of jth bid of supplier i with lth delivery time with respect to price and non-price attributes, respectively. Also, wlij, wpij and wzij are the weights of delivery time, bundle price and zth attribute for jth bid of supplier i, respectively. It is noted that if the bundle includes high-priority items (such as shelter), the weight of delivery time is higher than price (wlij>wpij), because these items must be delivered to the affected areas as soon as possible and consequently, delivery time for these items is more important factor than price in the relief chain. Similarly, if a bundle includes low-priority items (such as cleaning supplies), the price importance weight is higher than that of delivery time (wpij>wlij), because there is no urgent need for fast delivery of these items in the relief chain. Based upon existing scoring functions that typically use a weight vector to aggregate multiple attributes into a single composite score (Pham et al., 2015), suppliers’ scores for non-price attributes are obtained. By using these scoring functions, the HO declares a scoring rule for evaluating the suppliers’ bids. We consider these two scoring functions instead of a pure price model since when price is the only criterion for bid evaluation, many suppliers might be reluctant to participate in the reverse auction as their qualitative capabilities are not considered. It can be observed from Equation (1) that minimizing the scoring function of non-price attributes is equivalent to minimizing the delivery time and the values of other attributes (where the lowest value is better) that leads to higher bundle price and consequently increases the score of price attribute . In other words, HO should pay a higher price for a bid with higher levels of non-price attributes such as quality and delivery time. Therefore, by considering these conflicting objectives we model the bid evaluation problem as a bi-objective programming model. HO evaluates each supplier’s bid(s) through computing these two scores and using them as inputs in the proposed bi-objective model whose details are elaborated in Sub-section 3.5.
3.3 The proposed two-round decision model
As mentioned earlier, a two-round decision model with information updating is developed, while the post-disaster planning horizon includes three time periods. Notably, this two-round decision model is totally different than the so-called TSSP framework. TSSP is frequently used in the humanitarian relief setting to capture the post-disaster uncertainty at pre-disaster (for instance, see Balcik and Ak, 2014; Torabi et al., 2018; Hu and Dong, 2019). Anyway, in the first round of our proposed two-round decision model, we assume that the accuracy level of demand estimation for relief items (via the initial need assessment) is low while in the second period, demand data and the available resources are known with more certainty as the result of more precise need assessment process (Tofighi et al., 2016). Therefore, in the second period, the decision maker has this opportunity to make some changes to the current procurement plan in order to compensate for discrepancies with the actual impact of the disaster. At this period, after knowing the updated inventory levels as well as the updated demand sizes at the end of the first period, HO determines how many extra items are needed. Afterwards, the mathematical model is run again using this new data at the first of the second period to update the procurement plan. It is noted that since at the beginning of the second period, the demand data pertaining to the current and third periods are known with certainty; by the second period’s procurement, the requirement of second and third periods are jointly satisfied and therefore, there is no need for procurement in the third period.
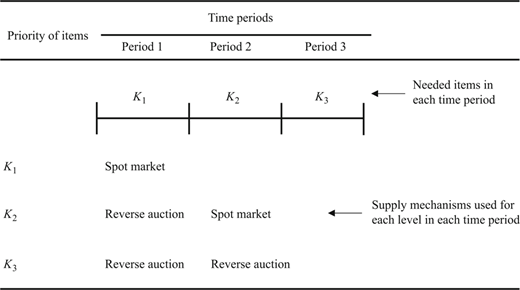
HO prefers to purchase the requirements of each period through running a reverse auction (at the previous period(s)) rather than spot market procurement (in the same period), as such requirements can be procured at desired price and non-price attributes. Otherwise, at the beginning of each period, HO meets the additional demand of that period through required purchases in the spot market which are associated with shorter lead times but higher prices to prevent the delay and the risk of stock-out. The procurement policy in each period by considering the priority of items and the sequence of events to be happened in the proposed two-round decision model are illustrated in Figure 1 and described as follows:
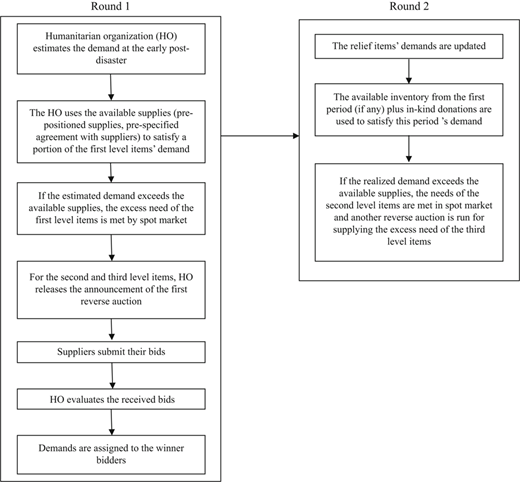
In the first period in which the first decision round is conducted, the initial relief procurement decision is made when the demand size is not accurate enough due to limited information received via the initial need assessment process. To deal with such demand uncertainty, it is divided into a certain part which is known for the early hours after the disaster and an uncertain part which may occur with a specific probability. In order to find a solution for the planning problem, it is important to estimate appropriate values for the uncertain future demand in this period. HOs are able to estimate the minimum and maximum amounts of uncertain demand with a specific probability based on their experience and information regarding the number of people living in the regions under study.
In the first period, prepositioned inventories, committed quantities by suppliers and spot market procurements are used to satisfy the demand of the first-level items that arises during this period. In this period, as the second- and third-level items are needed in the second and third periods, respectively, in contrast to the first-level items, HO has a sufficient time to employ the proposed reverse auction to provide these relief supplies. Since the preparation for and participation in the reverse auction is time consuming, HO would not have enough time to implement the reverse auction for purchasing the requirements of each period in the same period, but it can be done in the previous period(s). It is assumed that demands of the second- and third-level items also can be satisfied by new purchases in the next period.
In the second period in which the second decision round is conducted, since all the demand of the first-level items must be satisfied in the previous period, procurement decisions in this period are only related to placing an order for the second- and third-level items based on the updated demand information obtained at the beginning of this period. Using the updated demand and inventory information at the beginning of the second period, if the available inventory plus incoming in-kind donation is less than the realized demand, the purchaser (HO) has to response to the shortage of the second- and third-level items through instant purchasing in the spot market and conducting the second reverse auction, respectively.
The sequence and timing of events in the proposed two-round scheme is illustrated in Figure 2. Also, Figure 3 depicts the two different decision rounds and their related variables.
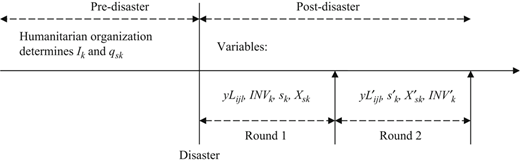
Representation of two different decision rounds at post-disaster and their related decision variables
Representation of two different decision rounds at post-disaster and their related decision variables
The following assumptions are made for the problem formulation:
HOs receive relief supplies donations within the few days after the onset of the disaster (i.e. in the second period);
some prepositioned inventories may be destroyed by the disaster and therefore part of them would be available at post-disaster;
some of potential suppliers, who have pre-specified agreements with the HO, might be partially disrupted by the disaster;
because of criticality and high urgency of the first-level items, any delay or shortage is not allowed for these items;
as this paper focuses on post-disaster procurement, we do not care about those issues related to the pre-disaster such as the level of prepositioned inventories;
demand data are fully known with certainty at the beginning of the second period as the result of final need assessment process; and
to reflect the social cost caused by delayed humanitarian aid, HOs estimate a due date for distribution of each relief item at post-disaster, after which a delay cost would be incurred.
3.4 Mathematical formulation
Using the aforementioned notations, we propose two bi-objective mixed-integer programming (MIP) models to be run at the beginning of the first and second periods whose details are presented in the following sub-sections.
3.4.1 The first round’s model
As mentioned before, the HO is required to determine an initial procurement plan right after a disaster strikes when demand is not known with certainty (i.e. the first period in our problem setting), because waiting for receiving complete information is deemed risky. The first-round model, which is run at the beginning of the first period of the aforementioned response horizon is as follows.
Objective functions:
The first objective function (Equation (3)) minimizes the expected value of total costs. The first term denotes the purchasing cost of urgent-immediate items in the spot market, the second one shows the cost of procuring the medium and low-priority items through the proposed reverse auction, the third one indicates the delay cost of relief items and the final term is the expected reordering and shortage costs. The reordering and shortage cost functions for the maximum and minimum demands, respectively, are defined as follows:
While HO can enhance the cost-efficiency of the procurement process through the first objective function, the second one (Equation (6)) tries to improve the responsiveness level by minimizing the delivery time and maximizing the achievement level of qualitative criteria through minimizing the selected suppliers’ scores (where the lower score is better).
Constraints:
As there will be a limited time for supplying the first-level items at the first period, production is not permitted and those available suppliers in the spot market can just rely on their on-hand inventories (Ertem et al., 2010, 2012). Accordingly, constraint (7) ensures that the amount of each first-level item purchased from each supplier in the spot market does not exceed the on-hand inventory of that supplier. Constraint (8) is the demand satisfaction constraint that states the total amount of critical relief items provided by suppliers; prepositioned inventory and spot market are equal to the total demand in the first period. Similarly, constraint (9) is the demand satisfaction constraint for the second- and third-level items. As mentioned before, for the first-level items, any delay and shortage is not allowed while any shortage of other relief items can be satisfied by the next period’s procurement. Constraint (10) ensures that the total procurement costs do not exceed the available budget in the first period. The selection of at most one bid per supplier at the first period is specified by constraint (11). Finally, constraints (12)–(14) specify the types of decision variables.
3.4.2 The second round’s model
Similar to the model (3)–(14), the second-round model, which is run at the beginning of the second period, is as follows.
Objective functions:
Constraints:
The first objective (Equation (15)) is the minimization of total cost including the purchasing cost of the second-level items in the spot market, shortage and holding costs of the second- and third-level items, and procurement cost of the third-level items through the proposed reverse auction. The second objective (Equation (16)) seeks to minimize the total score of selected suppliers (i.e. improving the responsiveness level), who have submitted their bids for the third-level items in the second period. Constraint (17) assures that the amount of each second-level item purchased from each supplier in the spot market does not exceed the on-hand inventory of that supplier. Constraints (18) and (19) are demand satisfaction constraints for the second- and third-level items, respectively. These constraints ensure that the total quantity of relief items provided by in-kind donations, spot market, reverse auction and the optimal inventory level at the end of previous period (INV*k) must be equal to the total demand in the second period and the optimal shortage quantity in the first period (s*k). Constraint (20) ensures that the total procurement costs do not exceed the available budget in the second period. The selection of at most one bid per supplier is specified by constraint (21). Finally, constraints (22)–(24) enforce the binary and non-negativity restrictions on the corresponding decision variables.
3.5 Practical considerations
The main challenges in humanitarian relief chains include budgetary and resource limitations, as well as dealing with uncertain data under dynamic characteristics of disastrous events. These challenges are collectively considered in our proposed two-round decision model with demand updating. Other features of real-world problems, including capacity limitations, probable shortages of supplies, priority of relief items and lead time dependent prices are also considered in our model. These characteristics make the model applicable to real-world situations. In addition, the proposed solution procedure provides a variety of alternative solutions (i.e. Pareto optimal solutions) that enables the decision maker to make a trade-off analysis between the provided solutions in order to select the most preferred procurement plan.
While the aim of this study was developing a practical decision model for procuring relief items, one of the major limitations of the proposed methodology is its reliance upon solving two mixed-integer mathematical models, while most of relief managers/decision makers typically do not have required expertise for dealing with such mathematical models.
Operations research methods have already been proven to be beneficial for different planning situations, mainly during the preparation and the response phase of the disaster life cycle (Kovács and Spens, 2007). Nevertheless, as mentioned by Garcia et al. (2018), the proposed modeling framework can be embedded within a software tool to address this limitation. Although the design and implementation of such a software tool is beyond the scope of this paper; however, by incorporating the proposed MIP models into the software, and linking the software to the resource databases and constructing the required user interfaces for entering input data into the software, the relief users can generate and update the procurement plan over a short-term time horizon without needing a deep knowledge about mathematical models and their solution process.
4. Solution approach
In multi-objective problems as there is more than one objective function, finding an optimal solution that simultaneously optimizes all objective functions is often not possible. Instead, optimal solutions are replaced with Pareto optimal solutions which are some feasible points in the solution space which do not fully dominate each other while dominating other feasible solutions. Therefore, applying an appropriate optimization method to find Pareto optimal solutions (i.e. estimating the Pareto front) is necessary. The ε-constraint method is the most popular and effective method to solve multi-objective models in which the objective function with the highest importance (e.g. the cost minimization is the main objective in this study) is considered as the objective function of this model and the rest are moved to the constraints. Despite the advantages and applicability of this method, the basic ε-constraint method has two main drawbacks as well. The first deficiency is inappropriate estimation of the interval of objective functions’ values over the efficient set. The second drawback is that the generated Pareto optimal solutions might be weakly efficient. Therefore, in this paper, we use an improved version of this method, i.e., the weighted augmented ε-constraint method (WAUGMECON), proposed by Esmaili et al. (2011) to overcome the drawbacks of the basic ε-constraint method while accounting for the relative importance of different objective functions in generating the Pareto solutions. In this way, the formulation of the weighted augmented ε-constraint method for our problem is as follows:
s.t.:
where X is the feasible space of the main problem; s2 the slack variable of constrained objective function; ri the range of objective function i obtained from the payoff table; w1 and w2 the weighting factors of the first and second objective functions determined by the decision maker; and δ a small number usually between 10−6 and 10−3.
In order to find a Pareto optimal solution in each run, the following model is solved:
s.t.:
The details of WAUGMECON method is as follows:
Step 1: set one of the objective functions as the main objective function to be optimized and add the constrained form of another objective function into the constraints set.
Step 2: determine the positive ideal solution (PIS) for each objective function and the negative ideal solution (NIS) for the constrained objective function. To obtain the PIS, each objective function should be solved separately to find their optimal values SC*=SCPIS, TC*=TCPIS. Then, the constrained objective function is optimized by imposing the constraint TC⩽TCPIS and the achieved result for the constrained objective function is denoted by SCNIS.
Step 3: generate different values for ε2 by dividing the range of constrained objective to q equal intervals as follows:
where SCNIS and SCPIS denote the maximum and minimum (i.e. the nadir and ideal) values of objective SC, respectively, and l is the number of grid points.(27)Step 4: the weighted augmented ε-constraint model is solved for each value of ε obtained from Step 3 to generate a distinct Pareto optimal solution.
5. The case description
In order to assess the performance of the proposed approach, a case study of an earthquake in the Tehran is provided. This case study is based on the real practice of supply department of IRCS and urgent need of Tehran province for an effective and efficient disaster response. IRCS is one of the main humanitarian relief organizations in Iran who is responsible for pre- and post-disaster relief operations. Our purpose is to assist relief managers of IRCS by providing a practical decision-making suite for supplying relief items in a dynamic environment. In brief, the main decisions include supplier selection and quantities of post-disaster procurements. The required information for this case study has been gathered by conducting several discussions with some experts of IRCS, studying the seismic report provided by Japan International Cooperation Agency (JICA, 2000), and extracting some information from Tofighi et al. (2016) that present a similar case study.
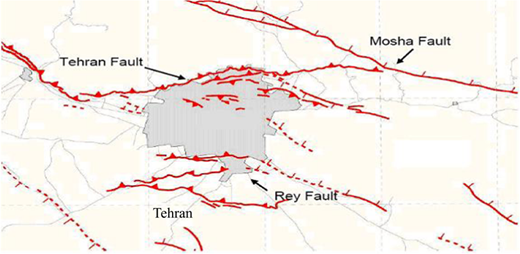
Tehran city is the capital of Iran in an area of 686.3 km2 with a population around 10m people (Rezaei-Malek et al., 2016). Tehran, as a strategic city with having an aggregate of political, financial and social centers, has always been exposed to devastating earthquakes. Therefore, designing and implementing reliable relief supply plans to deal with such devastating earthquake in an efficient and effective manner is essential. Tehran has been built over the several active faults which are shown in Figure 4. A brief explanation of the most likely dangerous faults and their properties is presented in Table I.
The properties of earthquake models
| Properties | RF | NTF | MFF |
|---|---|---|---|
| Length | 26 | 58 | 68 |
| Width | 16 | 27 | 30 |
| Location | South | North | Northeastern |
| Magnitude | 7 | 7.2 | 7.2 |
Tehran city includes 22 districts, which are considered as the demand zones. We use the aggregate demand of all sub-divisions, which are extracted from JICA (2000), as the total demand. The demand of each district is estimated based on the population size and predicted damage in each fault model. Moreover, according to the experts’ opinions, with regard to an earthquake condition, the estimated demand in the early hours after the disaster can be increased about 20–50 percent at the second period, after receiving updated demand information. The case study considers three scenarios according to causative faults i.e. MFF, NTF and RF (see Tofighi et al., 2016 for details). These scenarios are considered as the test problems with different demand sizes, and different disruption rates of suppliers’ capacities and prepositioned inventories. Table II presents these scenarios, average disruption rate of prepositioned inventory and the proportion of affected people in each scenario as they were estimated in JICA (2000).
Four different scenarios and their occurrence probabilities adapted from JICA
| RF | NTF | MFF | |
|---|---|---|---|
| Scenario no. | 1 | 2 | 3 |
| Average disruption rate of prepositioned inventory | 4.46 | 1.58 | 0.58 |
| Proportion of affected people | 55 | 36 | 13 |
Eight different types of relief items, namely, shelters and canned foods (as the first-level items), sunflower oil, tea and rice (as the second-level items), soap, washing powder and toothbrush (as the third-level items) are considered in this case study. The requirements of relief items are identified based on the standard requirements established by IRCS. For canned foods, the distribution quantity is two canned foods per person per day and each shelter is considered for five people over the planning horizon. Soap, washing powder and toothbrush are considered as one pack for each person over the planning horizon. Also, sunflower oil, tea and rice are considered as 40 g, 17 g and 200 g per person per day, respectively. In our numerical experiments, it is assumed that the post-disaster planning horizon includes 10 days.
IRCS has six central warehouses located outside of the Tehran for prepositioning relief supplies. Although IRCS has prepositioned relief items in these warehouses, due to unpredictability of disasters and storage capacity limitation, procuring excess relief items at early post-disaster would be unavoidable through the proposed reverse auction framework. After occurrence of an earthquake, IRCS announces bids for procuring relief items. Those suppliers, who have sufficient on-hand inventory and are able to supply the required relief items in desired specifications, construct their bids. It is assumed that ten bidders with different capacities submit their bids which include their proposed quantities, bundle prices, delivery times, quality and probability of on-time delivery. Furthermore, each bidder only places two bids with two different delivery times in each bid. Therefore, to satisfy the first and second periods’ demands, the most suitable suppliers should be selected among the candidate ones and the best order quantities need to be determined in each period using the proposed model.
We consider five available suppliers in the spot market with different on-hand inventory levels. According to the received data from IRCS, it is revealed that the IRCS has pre-specified agreements with three suppliers. Nevertheless, the suppliers’ capacities and the central warehouses may be partially disrupted at post-disaster due to damages to roads and/or facilities. The disruption ratios of suppliers’ capacities and the central warehouses are, respectively, estimated as 0.01 and 0.1 of destruction ratios of the most resistant buildings in respective districts according to JICA (2000). These ratios are adopted from those reported in Tofighi et al. (2016). The reserved capacities of three suppliers for each commodity and disruption rate of these suppliers in each scenario are shown in Tables III and IV, respectively. Also, the level of prepositioned inventories and disruption rate of each central warehouse are shown in Tables V and VI, respectively. In the post-disaster phase, the procurement prices in spot market are estimated to be 1.5 times to those of pre-disaster prices. With regard to priority and type of relief items, cost parameters, i.e., the holding, shortage and delay costs have been estimated by experts in IRCS between 103–105, 104–106 and 102–105 rials, respectively.
Reserved capacity of suppliers
| Reserved quantity of each supplier (103 units) | |||
|---|---|---|---|
| Item type | Supplier 1 | Supplier 2 | Supplier 3 |
| Shelter | 10 | 6 | 7 |
| Conserve food | 300 | 200 | 100 |
| Sunflower oil | 20 | 10 | 15 |
| Tea | 8 | 10 | 5 |
| Rice | 100 | 60 | 40 |
| Soap | 50 | 40 | 20 |
| Washing powder | 50 | 40 | 20 |
| Toothbrush | 50 | 40 | 20 |
Disruption rates of pre-agreement suppliers in each scenario
| Disruption rates in each scenario | |||
|---|---|---|---|
| Supplier | 1 | 2 | 3 |
| 1 | 4.1 | 1.8 | 0.5 |
| 2 | 6.5 | 1.8 | 0.7 |
| 3 | 6.3 | 1.3 | 0.4 |
The level of prepositioned inventories in each central warehouse
| Central warehouse | ||||||
|---|---|---|---|---|---|---|
| Relief item | 1 | 2 | 3 | 4 | 5 | 6 |
| Shelter | 4,000 | 3,200 | 2,000 | 2,800 | 3,600 | 4,400 |
| Conserve food | 40,000 | 32,000 | 20,000 | 28,000 | 36,000 | 44,000 |
| Sunflower oil | 8,000 | 6,400 | 4,000 | 5,600 | 7,200 | 8,800 |
| Tea | 3,400 | 2,720 | 1,700 | 2,380 | 3,060 | 3,740 |
| Rice | 40,000 | 32,000 | 20,000 | 28,000 | 36,000 | 44,000 |
| Soap | 20,000 | 16,000 | 10,000 | 14,000 | 18,000 | 22,000 |
| Washing powder | 20,000 | 16,000 | 10,000 | 14,000 | 18,000 | 22,000 |
| Toothbrush | 20,000 | 16,000 | 10,000 | 14,000 | 18,000 | 22,000 |
6. Computational experiments
6.1 Implementation
In order to display the applicability of the presented model, the weighted augmented ε-constraint method is coded and solved by GAMS software v.24.1 with CEPLEX solver (after converting the original non-linear MIPs to their linear counterparts) using a computer with Intel Dual Core CPU, 2.53 GHz using 4 GB of RAM. In addition, all the monetary data are considered in Iranian currency (i.e. rials). By running the first model, the relationship between the first and second objective functions in all the scenarios (i.e. the respective Pareto fronts) is depicted in Figures 5–7. These Pareto fronts are obtained using the weighted augmented ε-constraint method (as previously described in Section 4). Notably, although the estimation with higher precision degree could be achieved by dividing the range of the constrained objective into much more equal intervals, since depicting all the Pareto optimal solutions is not necessary here and just making a sense about conflicting nature of objectives is important, here just five points from Pareto line are extracted and used as the values of epsilon vector in the ε-constraint method.
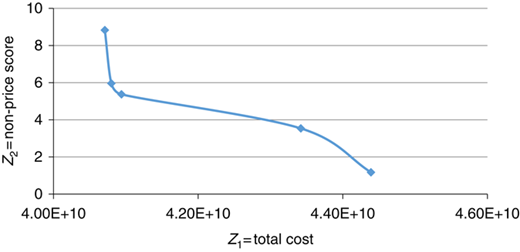
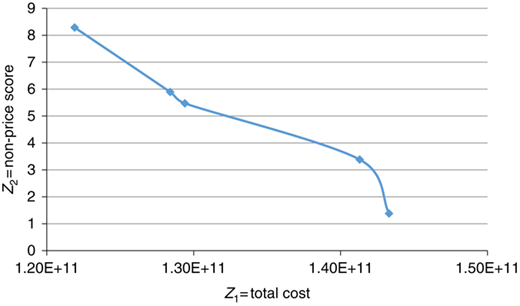
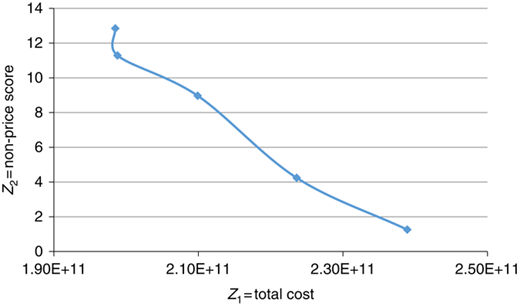
As Figures 5–7 show, the total cost objective (Z1) and objective function of minimizing non-price score (Z2) are in conflict with each other. To justify this confliction, it can be stated that minimizing the scoring function of non-price attributes, which is equivalent to minimizing the delivery time and the values of other attributes (where the lowest value is better), leads to higher procurement cost. In other words, for minimizing delivery time and maximizing qualitative criteria and consequently improving the responsiveness level of response phase, HO must pay higher prices and incur higher procurement cost. Therefore, by using this model, HO can make trade-off between the delivery time, price and other attributes, which obviously can lead to more reliable decision making.
As mentioned before, we have developed a two-round procurement decision model which allows the HO to make decisions in two different rounds. Each decision made (i.e. Pareto solution) in the first round (i.e. time period) can be used as an input data for the second round. In other words, the first period’s strategy can affect the final procurement plan in the second period. Therefore, analyzing and studying the effects of the first period’s solutions on the outputs of the second period can be useful for HO. The relationships between different Pareto curves in the second period that are obtained from each Pareto solution in the first period for all scenarios are depicted in Figures 8–10. In these figures, we name each Pareto curve according to its relevant Pareto solution in the first period. For example, the Pareto curve obtained from the first Pareto solution is called Pareto Solution 1.
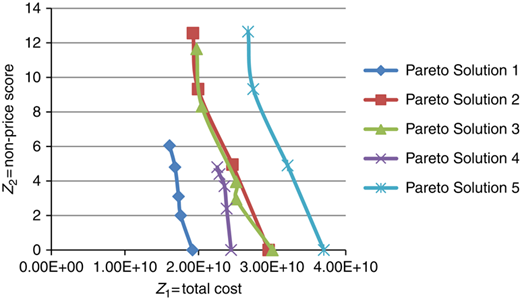
Comparison between different Pareto curves in the second period for MFF scenario
Comparison between different Pareto curves in the second period for MFF scenario
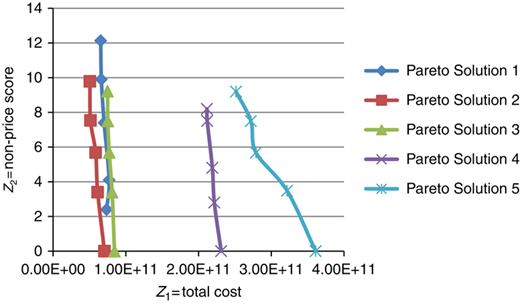
Comparison between different Pareto curves in the second period for NTF scenario
Comparison between different Pareto curves in the second period for NTF scenario
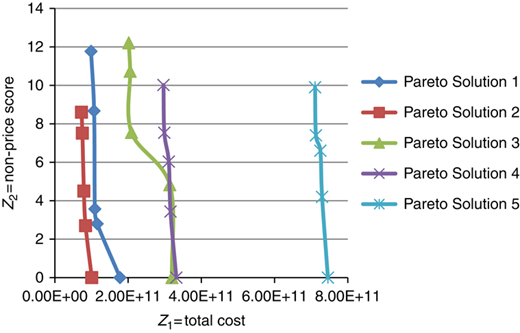
Comparison between different Pareto curves in the second period for RF scenario
Comparison between different Pareto curves in the second period for RF scenario
As Figures 8–10 indicate, Pareto Solution 1 for MFF and Pareto Solution 2 for NTF and RF scenarios lead to better solutions in the second period. Also, Pareto Solution 5 for all scenarios gives the worst result. This behavior could be better explained with considering the reported results in Table VII, in which optimal values of the inventory and shortage of relief items in the first period in each Pareto point are illustrated. As Table VII reveals, Pareto Solution 1 for MFF and Pareto Solution 2 for NTF and RF scenarios have higher inventory level than other Pareto solutions. Also, Pareto Solution 5 has a higher shortage level than other Pareto solution in all the scenarios. It can be interpreted in this way that the situation in which the demand of the second period can be estimated with high certainty, the first period’s inventory will reduce the need for procurement in the second period which can be done with higher price than the first period. This is because that in the second period, HO must avoid any delay and stock-out risk by placing an emergency order from the spot market or selecting a bid with shorter lead time, both of which are associated with shorter lead times but higher prices. In other words, instead of waiting for receiving accurate demand information, which leads to purchasing relief items via an emergency order from a more expensive source (i.e. the spot market), such estimation is intended to assist HO to prepare for situation that additional demand might arise in the next period. Therefore, HO can improve the cost-efficiency by procuring relief items in an amount more than the first period’s demand and keeping the extra amount as the inventory for satisfying the second period’s demand. It should be noted that this condition will not always be feasible or desirable (due to limited budget in each period), especially when the relief item is perishable and cannot be stored over the whole planning horizon (e.g. medical supplies with the short life times). Also, when we cannot estimate the demand of the next period precisely, it could cause a mismatch between the demand and supply which might lead to higher inventory holding cost. In such situation where demand uncertainty is high, it might be better that HO waits to receive an updated demand information in the next period and procure the requirement of the second period in the same period but with a faster method.
Pareto optimal solutions in the first period
| Scenario no. | |||||||
|---|---|---|---|---|---|---|---|
| 1 | 2 | 3 | |||||
| No. | Items | Inventory | Shortage | Inventory | Shortage | Inventory | Shortage |
| 1 | 3 | 0 | 1.11E+05 | 0 | 3.92E+05 | 0 | 5.86E+04 |
| 4 | 0 | 57,620 | 56,740 | 0 | 28,800 | 0 | |
| 5 | 0 | 4.72E+05 | 8.24E+05 | 0 | 4.27E+05 | 0 | |
| 6 | 70,000 | 0 | 0 | 1.22E+06 | 1.01E+05 | 0 | |
| 7 | 1.70E+05 | 0 | 0 | 1.42E+06 | 1.91E+05 | 0 | |
| 8 | 2.70E+05 | 0 | 0 | 1.50E+06 | 1.31E+05 | 0 | |
| 2 | 3 | 0 | 5.33E+04 | 4.52E+05 | 0 | 0 | 1.61E+04 |
| 4 | 41,100 | 0 | 61,260 | 0 | 0 | 27,620 | |
| 5 | 4.32E+05 | 0 | 1.04E+06 | 0 | 0 | 3.72E+04 | |
| 6 | 1.22E+06 | 0 | 5.82E+05 | 0 | 0 | 3.30E+04 | |
| 7 | 2.01E+05 | 0 | 9.62E+05 | 0 | 0 | 2.30E+04 | |
| 8 | 5.531E+05 | 0 | 7.82E+05 | 0 | 0 | 1.30E+04 | |
| 3 | 3 | 0 | 4.67E+05 | 0 | 2.56E+05 | 1.01E+05 | 0 |
| 4 | 0 | 73,200 | 0 | 89,260 | 36,710 | 0 | |
| 5 | 2.53E+05 | 0 | 0 | 1.32E+06 | 0 | 3.72E+04 | |
| 6 | 0 | 8.97E+05 | 0 | 6.82E+05 | 0 | 2.30E+04 | |
| 7 | 0 | 1.71E+06 | 1.06E+06 | 0 | 0 | 3.30E+04 | |
| 8 | 0 | 1.37E+06 | 0 | 7.32E+05 | 0 | 2.30E+04 | |
| 4 | 3 | 0 | 9.43E+05 | 0 | 6.48E+05 | 0 | 2.11E+04 |
| 4 | 0 | 2.16E+05 | 0 | 2.57E+05 | 0 | 87,620 | |
| 5 | 0 | 3.11E+06 | 0 | 3.56E+06 | 0 | 1.07E+04 | |
| 6 | 0 | 1.24E+06 | 0 | 9.82E+05 | 2.70E+05 | 0 | |
| 7 | 0 | 1.88E+06 | 0 | 1.26E+06 | 1.70E+05 | 0 | |
| 8 | 0 | 1.58E+06 | 0 | 9.82E+05 | 2.70E+05 | 0 | |
| 5 | 3 | 0 | 1.13E+06 | 0 | 5.35E+05 | 0 | 1.22E+04 |
| 4 | 0 | 4.54E+05 | 0 | 4.29E+05 | 0 | 56,910 | |
| 5 | 0 | 5.97E+06 | 0 | 2.77E+06 | 0 | 1.01E+05 | |
| 6 | 0 | 1.75E+06 | 0 | 7.51E+05 | 0 | 1.30E+04 | |
| 7 | 0 | 2.22E+06 | 0 | 3.06E+06 | 0 | 2.30E+04 | |
| 8 | 0 | 1.75E+06 | 0 | 9.82E+05 | 0 | 1.30E+04 | |
6.2 Sensitivity analyses
There are a number of questions raised by the decision maker regarding the sensitivity of the optimal solutions to input parameters. Performing sensitivity analyses on the relevant parameters can help the decision makers to make a rational decision. Hence, in this section, we performed several sensitivity analyses on critical parameters in order to reflect the effect of changes in these parameters on the optimal solution of MFF scenario.
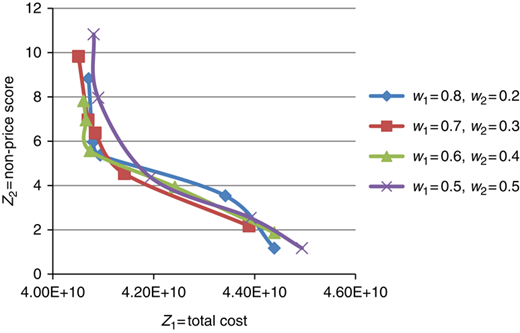
Selection of desired values for the relative importance of objective functions can be helpful for making trade-off between the conflicting objective functions. Therefore, HO should select the most desired values for the relative importance of objective functions in the bid evaluation model. For this purpose, a sensitivity analysis on the weight vector (w1, w2) has been conducted whose results are shown in Figure 11. As Figure 11 shows, the impact of weights on the objectives’ values is negligible, at least in our problem setting. It means that the decision maker could choose the best values of weights based on his/her preferences without worrying too much about the effects of selected weights.
The inventory holding costs of relief items are also among the important parameters whose sensitivity analyses are unavoidable. The results of sensitivity analysis performed on inventory holding costs under different available budget levels in the first period are provided in Figure 12. We increased the value of these parameters in three iterations with 10 and 15 percent increase for holding costs and available budget, respectively, in each iteration. Figure 12 shows a graphical display of the average inventory level in the first period under different holding costs and available budget levels. Here, a bubble is used to indicate the average inventory level in the first period which can be used to satisfy part of demand in the next period.
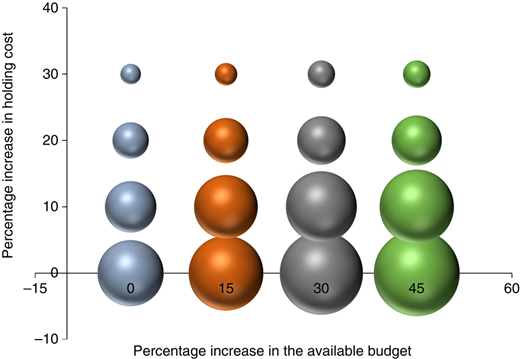
Average inventory level under different holding costs and available budget levels
Average inventory level under different holding costs and available budget levels
As Figure 12 indicates, the size of a bubble decreases by increasing the value of holding cost. As it was expected, this observation demonstrates the sensitivity of the inventory level to the inventory holding cost. Indeed, with increasing the holding cost, solution with lower inventory level leads to better result for the second period. As Figure 12 shows, when the percentage increase in holding cost is in the range of 20–30 percent, increasing the available budget does not have a significant effect on the average inventory level. It means that when the holding cost is high, the optimal result is not highly affected by changes in the value of available budget. It can be concluded that because the demand of the next period is unknown, when holding cost is high, keeping more relief items in the first period for satisfying probable demand in the next period cannot be economically justified and it will lead to higher inventory cost, thus there is no need to increase the budget level in this situation. In other words, inventory holding cost can be higher than reordering cost in the second period.
Unlike the previous condition, it can be seen that the average inventory level is very sensitive with respect to increasing the available budget when the percentage increase in the holding cost is in the range of 0–10 percent. When the holding cost is low, by procuring more relief items due to increasing of the available budget and keeping more inventory in the first period, HO could reduce the cost of a higher purchase price in the second period that arises by an emergency order (from the spot market) and selection of the bid with shorter lead time (to avoid any delay in humanitarian aids). In other words, the inventory holding cost can be less than reordering cost in the second period. In summary, increasing the budget when the holding cost is low will be beneficial and this is in contrast to the situation in which the holding cost is high.
In another sensitivity analysis, we studied the influence of reordering costs under difference available budget levels on the inventory level and Pareto solutions of the first period. The details of the results are reported in Table VII. We increased the value of these parameters in three iterations with 10 and 15 percent increase for the reordering costs and available budget, respectively, in each iteration. Figure 13 shows the graphical display of the average inventory level in the first period under difference reordering cost and available budget levels. As Figure 13 shows, in each level of available budget, size of a bubble increases by increasing the value of reordering cost. As it was expected, this observation demonstrates sensitivity of the inventory level to the reordering cost. Indeed, with increasing the reordering cost, a solution with higher inventory level leads to a better result in the second period. As Figure 13 shows, when the percentage increase in the available budget is constant at 0 percent, increasing the reordering cost does not have a significant effect on the average inventory level. It means that when the available budget is low, the optimal result is not highly affected by changes in the value of reordering cost. It can be concluded that due to the budget constraint, HO cannot procure more relief items to decrease the procurement cost of the second period, even when the reordering price in the next period is high. When the percentage increase in the available budget is in the range of 15–45 percent, increasing the reordering cost has a significant effect on the average inventory level. This is in contrast to the situation which occurred in the high level of holding cost. It means that when the reordering cost is high, the optimal result is highly affected by changes in the value of available budget. It can be concluded that in this condition, increasing the budget can help to keeping more relief items in the first period and it will lead to decreasing the procurement cost of the second period. In other words, the inventory holding cost can be less than the reordering cost in the second period.
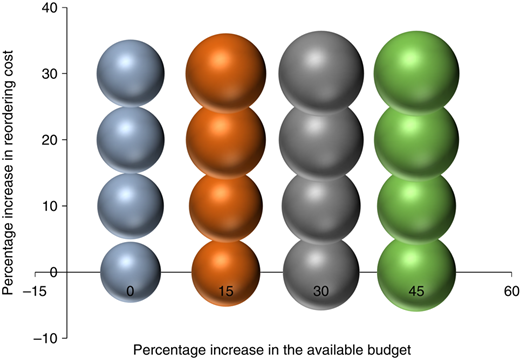
Average inventory level under different reordering cost and available budget levels
Average inventory level under different reordering cost and available budget levels
Unlike the previous condition, it can be seen that the average inventory level is not sensitive with respect to increasing the available budget when the percentage increase in reordering cost is in the range of 0–10 percent. When the reordering cost is low, procuring more relief items due to increasing the available budget and keeping more inventories in the first period cannot be economic, because the inventory holding cost can be higher than the reordering cost in the second period. In summary, increasing the budget when the reordering cost is high will be beneficial and this is in contrast to the situation in which the reordering cost is low.
As Figures 12 and 13 show, when the value of percentage increase in the available budget level is in the range of 30–45 percent, the average inventory level is approximately similar for both values. This means that increasing the available budget level from 30 to 45 percent does not have a significant effect on the Pareto solution, at least in our problem setting.
7. Conclusions and future research
During the last decade, research on humanitarian logistics has received an increasing attention. However, despite the scale and importance of procurement in humanitarian supply chains, there are few studies addressing the relief supply policies. In this paper, a bi-objective mixed-integer mathematical model is developed for providing the required relief items at post-disaster. It aims to concurrently minimize the total costs and suppliers’ total scores as the first and second objective functions. In this study, we propose a novel procurement auction model by combining the concept of multi-attribute auction with combinatorial auctions. The proposed multi-attribute combinatorial procurement auction leads to significant time saving while it is very effective in addressing the price and non-price attributes that are vital factors in the humanitarian setting. Unlike the procurement auctions in the commercial setting in which the order quantity is an essential decision, in the relief operations, providing a right quantity of relief items at right time are two important factors that must be considered in the decision-making process. Hence, in our approach, delivery time as well as order quantity are considered as two decision variables in the model and each bidder proposes different options of quantity and delivery time in its submitted bids. In order to cope with demand uncertainty at post-disaster, a specific two-round decision model with demand updating is developed to capture more accurate estimates of demand data over the time. Also, a real case study is provided to illustrate the performance and applicability of the proposed models in practice. Finally, the weighted augmented ε-constraint method is applied to achieve Pareto optimal solutions for the real case study whose results are also comprehensively analyzed.
Despite above contributions, a potential limitation of this paper is that the proposed mathematical models need to be solved using the MIP techniques which might be complex and unfamiliar to relief managers/decision makers. Therefore, further work for designing an appropriate software tool enabling those users to interact with the mathematical models is thus needed to address this limitation.
To the best of our knowledge, the literature of applying procurement auctions in the relief setting is still in its infancy. This paper is one of the primary works which design a specific procurement auction model for humanitarian supply chains by combining the concepts of multi-attribute and combinatorial reverse auctions. Hence, some possible future research directions can be suggested in this area. For example, different uncertainties (regarding the level of donations, disaster magnitude and its location and impacts) can be considered for developing new decision models. Moreover, to handle uncertain parameters, uncertainty programming techniques such as fuzzy/possibilistic programming and robust programming could be considered as another focus area for future research. Also, the proposed multi-attribute combinatorial reverse auction could be considered in the other phases of relief logistics such as the pre-disaster phase for prepositioning of relief items. In addition, it would be interesting to extend the proposed model to a multi-stage stochastic programming model with recourse in order to consider longer planning horizons with variable lengths in the sequential time periods upon receiving new information at each stage. Another extension could be the integration of different methods for supplying the relief items, such as making long-term contractual agreements (through option contracts, quantity flexibility contracts, etc.) with short-term procurements (from spot local/global markets), to improve the performance of current relief supply plans. Finally, although there was no concern regarding the computation times in our numerical experiments, those instances with larger sizes (involving longer planning horizon, more relief items, etc.) may not be solved using the commercial solvers in a reasonable CPU time. Therefore, developing some heuristic or meta-heuristic algorithms to reduce the solution time would be inevitable.

