


purpose of this study is to present a Lean Readiness Assessment Model (LRAM) for assessing the readiness of Humanitarian Organizations (HO) for adopting Lean Management (LM) (Johanson et al.) practices. Literature reveals that implementation of LM itself is a cost and most organizations have failed to adopt LM techniques due to a non-readiness status and a non-supportive organizational culture. This situation indicates that the assessment of organizations' readiness before implementation of lean techniques is necessary.
This was an empirical quantitative study. Based on a synthesis of the literature, a conceptual model was developed by identifying seven critical success factors (CSFs). The CSFs were validated by HO professionals via a questionnaire-based survey. The data from the responses were analysed by applying partial least square structured equation modelling (PLS-SEM) using the SmartPLS3 software.
A proven LRAM was constructed that consists of CSFs (independent and mediating variables), which have reflected positive coefficients and significant t >1.96 and p < 0.05 values. The CSFs that are significant include process management, planning and control management, customer relationship management, human resource management, communication and coordination management and a positive organizational culture. The CSFs of supplier relationship and top management and leadership had insignificant t and p values and were dropped from the final LRAM.
This is a unique and rare study in its nature which developed LRAM for HO sector. The contribution of this model is to improve the efficiency and sustainability (economic and social aspects) of an HO under scarce resource conditions.
1. Introduction
Humanitarian organizations (HOs) are recognized as professional bodies with disaster management skills and often have extensive relief services supply chain networks (Vojvodic et al., 2015, D'haene et al., 2015). The primary goal of HOs has been to serve deprived and deserving communities without any profitable motives (Doyle et al., 2016). With globalization, HOs have extended their services internationally and their scope/thematic areas have been expanded from relief services (food, shelter, health, etc.) to long-term reconstruction and social development, often following natural disasters (Bhimani and Song, 2016; Shafiq and Soratana, 2019b; Noori and Weber, 2016). Long-term development includes provision of education, infrastructure construction and social and political awareness and capacity building programs (Shafiq and Soratana, 2019b; Noori and Weber, 2016). This extended scope, encompassing many competitors and humanitarian operations, has increased competition between HOs for funding (Tomasini and Van Wassenhove, 2009). Donors demand sustainability in the overall Humanitarian Logistics and Supply Chain Management (HLSCM) governance and resource utilization processes (Tomasini and Van Wassenhove, 2009). HLSCM resource utilization and social sustainability are associated with overall operational efficiency (Anjomshoae et al., 2017; Seifert et al., 2018). Efficiency in management processes is the ability to minimize waste, avoid redundancy and duplication of activities, conserve energy and maximize effort while minimizing time taken and overall operational costs (Provan and Kenis, 2008); in other words, “doing the things right” (Zidane and Olsson, 2017). Generally, efficiency can be achieved through lean management which is a concept and practice that was developed and successfully applied in the Toyota Motor Company, enabling it to become the world's leading and most profitable car manufacturing enterprise (Cozzolino et al., 2012). For the paradigm of humanitarian operations, lean has been advocated through deployment of contingency theory (Larson and Foropon, 2018; Gunasekaran et al., 2018).
LM refers to doing more and doing better with less resources and reducing waste (Johanson et al., 2006). Humanitarian operations require cost savings and reduction in waste that will enable the HO to serve more people in the targeted community. Primarily, LM in HOs helps to improve the efficiency of the HOs Logistics and Supply Chain Management activities in the areas of resource utilization and sustainability in both social and economic aspects (Shafiq and Soratana, 2019a). Despite the example of the adoption of LM principles, concepts and practices in many large organizations (e.g. Hewlett–Packard, Toyota, Zara fashion design and World Vision) and successful achievement of cost and waste reduction (Christopher and Towill, 2001; Parris, 2013), LM is often said to fail in implementation (Bhasin, 2008). Studies have reported LM failure rates of up to 70 per cent of organizations attempting this (Kollberg et al., 2006; Bourne et al., 2002; Johanson et al., 2006; Senge et al., 2007; Sirkin et al., 2005). The evidence indicates that such failure is rooted in the fact of organizations' non-readiness to adopt Lean Management System (LMS) (AL-Najem, 2012). Those organizations that are not ready to implement LM have a high tendency to return to old routines because of low management commitment, lack of training and education, poor linkage between lean activities and overall organizational strategy, etc. (Arlbjørn et al., 2010; Radnor et al., 2006; Rich and Bateman, 2003; Achanga et al., 2006). Implementation of LM itself is a cost (AL-Najem, 2012), strongly implying that before an HO can adopt a LMS, the readiness of that organization needs to be assessed. This prior assessment is intended to reduce waste during the implementation of LM and will minimize disruption to the organization as well.
In this study, a Lean Readiness Assessment Model (LRAM) was developed. The purpose of the model was to assess an HOs readiness to implement an LMS in their HLSCM prior to attempting the LM implementation. The overall goal of this study was to contribute towards the efficient utilization of an HO's resources by bringing about cost and time efficiency. The LRAM was developed by identifying the LM critical success factors (CSFs), which were identified and applied in previous studies (AL-Najem et al., 2013; Furlan et al., 2011; Shah and Ward, 2003; Tawfik Mady, 2009; Nordin et al., 2010; Elnadi and Shehab, 2014; Antony et al., 2012). Overall, the organization of this study was divided into six sections. Following the introduction, Section 2 was to develop the conceptual framework/hypothesis through a literature review and validate it with a questionnaire survey of HO professionals. Section 3 was description of the methodology applied for analysis of the data which was undertaken using the SmartPlsm 3® statistical analysis software (Hair et al., 2013). Section 4 was the results and analysis which drawn into statistical units that included partial least square structural equation modelling (PLS-SEM). Section 5 was the discussion and implication of the study. Finally, Section 6 presents the conclusion that LRAM can contribute significantly to savings in time and money and will be a good first step towards the economic and social sustainability of the HO sector.
2. Literature review
HLSCM is the processes of planning, implementing and controlling the efficient and cost-effective flow of goods, services and information from point of origin to point of consumption (Hong et al., 2015). It also includes the storage of goods, materials, and equipment in sufficient quantities, and at appropriate locations, to meet the beneficiaries' requirements (Vojvodic et al., 2015). Logistics and supply chain management are both crucial to supporting the timely response of an HO to a disaster (Chong et al., 2019). By definition the disaster is likely to occur suddenly, without warning, with devastating consequences affecting a wide area and potentially a large number of victims (Cozzolino, 2012; Baou et al., 2018). HLSCM is a distinctive unit of any HO, and the success or failure of any humanitarian operation is highly dependent on this unit (Cozzolino, 2012). Thus, the concept of HLSCM is the provision of goods and services, maximizing cost efficiency and speed effectiveness, achieved by LM.
Lean means the elimination of waste and doing more with less resources with the objective of maximizing the value of goods and services provided for the customers (Bhasin and Burcher, 2006). In the HO sector, customer means both donors and consumers (Antai et al., 2015). This recognizes the role of donors as participants who require confidence in the manner in which their donations are applied and appropriated. Waste is the eradication of the non-value-added activities from the process. Waste is generally considered as only including depletion of assets by leakage, theft, misappropriation, by obsolescence and by depreciation over time. When a physical product, or a virtual product such as information, is inspected and found to be stored inadequately or insecurely, or is defective, or is delayed or held in a queue awaiting further development, such situations are not adding any particular value, or are actually reducing value, and is wasting the alternative opportunities, known in economics as opportunity cost: these are wastes (Myerson, 2012). In general, waste is the failure to add, or is a barrier to adding, value for the customer (Shah and Ward, 2003; Benson and Kulkarni, 2011). For organizational effectiveness and for gaining competitive advantage in cost, it is necessary for the organization to eliminate waste (Shokri et al., 2016). The Toyota Management System, considered as a leading exemplar, and the seminal proponent, of LM, included the rigorous identification and eradication of waste and categorization of activities as value-adding or otherwise (Benson and Kulkarni, 2011). Therefore, the seven types of waste identified from the Toyota Production System and described in the literature include: holding of inventory, transport, motion, waiting, overproduction, over-processing, and defects, with behavioural waste (wasted talent) subsequently added to define the eight wastes of manufacturing (Benson and Kulkarni, 2011; Alukal, 2003; Womack and Jones, 2010; Kilpatrick, 2003). The further outcomes of this activity were shorter lead times, shorter cycle times and the improvement of the overall supply chain (Ferdousi and Ahmed, 2010). Alukal, 2003 explained the various reasons for the occurrence of such waste, which included poor layout, long set-up times, poor workplace, lack of training, inadequate equipment maintenance, improper methodology, processes that are vague and unstructured, lack of clear information and instruction, lack of planning, delivery and quality problems from the supplier and poor working conditions (Alukal, 2003). Organizations should understand the LM philosophy, sources and types of waste and the reasons for waste, to allow for the development of solutions to the problem by applying the LM principles (AL-Najem et al., 2012).
2.1 Lean management philosophy and its principles
According to Bhasin and Burcher (2006), LM is a philosophy rather than a hard set of rules. Lean holistic philosophy is to adopt continuous improvement and to accept organizational changes inevitably brought about by the adoption of this philosophy (Bhasin and Burcher, 2006). Continuous improvements can be made by identifying areas of waste in the overall supply chain system and applying the suitable lean techniques for elimination of that waste (Fujimoto, 1999). This philosophy requires a clear understanding of the needs of an organization. In order to implement a successful LM it also required to establish a lean supportive organizational culture that includes both employees' trust in the culture, and trusting employees' abilities, both of which empower them to participate in the organization's decision-making process (Antony et al., 2012). In connection to this, the success of LM is derived from the spectrum of trust issues across upstream and downstream partners in humanitarian supply chains (Awasthy et al., 2019). A supportive organizational culture will enable the employees to implement the LM principles which include: specifying value, identifying the value stream, creating a smooth flow, responding to customer pull and striving for perfection by continuous improvement (Jones et al., 1999; Womack and Jones, 2010).
Successful adoption and implementation of LM principles requires a cultural transformation within the organization, followed by the maintenance of modified management processes, with discipline and leadership (Kimberly and Quinn, 1984). During this transformation process, it is important to maintain continuity between the existing organizational culture and the evolving organizational culture (Lassiter, 2007; Bhasin and Burcher, 2006). As previously discussed, 70 per cent of would-be lean implementing organizations have failed to successfully adopt LMS because of a non-supportive organizational culture in the organization, and the organizations' lack of readiness to adopt the LMS (Sirkin et al., 2005; Johanson et al., 2006; Kollberg et al., 2006; Senge et al., 2007). Therefore, pre-existing efficiency and readiness of the organization must be measured in order to determine how the organization's structure and management practices (e.g. process, mission, culture and leadership etc.) impact its potential for lean transformation. Such LM readiness can be assessed through the unique combination of CSFs which are required by that particular sector, and which must be identified and assessed (Kumar et al., 2006; Upadhye et al., 2010; Zhou, 2016; Wickramasinghe and Wickramasinghe, 2012; Nordin et al., 2010; Zaman et al., 2011; Lassiter, 2007).
2.2 Identification of CSFs and development of LRA conceptual model
Factors that are crucial for LM and require a positive behaviour and acceptance for implementation of lean techniques are known as lean readiness CSFs. Lean readiness CSFs for the HO sector can be identified from existing LM models currently applied in business organizations. Researchers and third-party LM consultant firms, such as Lean Enterprise Inc. and Strategos Inc, who have worked on the lean assessment of organizations, have focused their assessments post-implementation of an LMS, ignoring the potential problem of readiness (AL-Najem et al., 2013; Furlan et al., 2011; Shah and Ward, 2003; Tawfik Mady, 2009; Nordin et al., 2010; Elnadi and Shehab, 2014). Different lean assessment models, such as Throughput solutions, Shingo assessment and Lean Self-Assessment, have also been developed by different researchers; these are discussed in AL-Najem et al. (2013). LM readiness assessment prior to implementation of LM techniques, however, has rarely been addressed in previous studies, and the few studies are to be found on this subject that have applied LM readiness assessment to small and medium manufacturing enterprises (AL-Najem et al., 2012). What is also a notable gap in the practices identified in the literature is that both post- and pre- LM implementation assessments have been applied to business organizations or governmental organizations only, with little or no indication that the HO sector has adopted such assessment strategies. Therefore, for any assessment model to validly use CSFs to measure the degree of leanness, CSFs appropriate to HOs first need to be identified and validated. Identification of appropriate CSFs is an important task for successful lean readiness assessment (LRA). CSFs that can be evaluated through LM techniques will vary from organization to organization and from industry to industry. Important CSF's identified from previous frameworks are shown in Table 1.
Lean management critical success factors (CSFs)
| No. | Type of framework | Lean management CSFs | Reference |
|---|---|---|---|
| 1 | Lean assessment model | Elimination of waste, continuous improvement, zero defects, JIT deliveries, pull of materials, multifunctional team, decentralization, functions integration, vertical information system and managerial commitment | Soriano-Meier and Forrester (2002) |
| 2 | Lean development model | Order-based production, zero defects, elimination of waste, focus on continuous incremental improvements, respect for humanity, visual management system, focus on customers, supplier partnership | Osono et al., (2008) |
| 3 | Lean development and as assessment model | Leadership, employee empowerment, involvement of top management, building customer and supplier relations, training and development of staff, departmental relations and teamwork | Denison and Mishra (1995) |
| 4 | Lean development and assessment model | Organizational culture (organization leadership, top management, employee skills) and financial position | Achanga et al. (2006) |
| 5 | Lean development and assessment model | Commitment of the employees, respect for people skills contributions, fair treatment in provision of opportunities and employee involvement in decision making | Angelis et al. (2011) |
| 6 | Lean development and assessment model | Commitment, involvement and support from the top management, and human resources | Meredith et al. (1991) |
| 7 | Lean development and assessment model | Strong supplier relationships, customer relationships, workforce efficiency and top management support | Zu et al. (2010); Lander and Liker (2007) |
| 8 | Lean Six-Sigma CSFs | Uncompromising top management support and commitment, effective communication at all levels vertically and horizontally, strategic and visionary leadership, developing organizational readiness, resources and skills to facilitate implementation, project selection and prioritization, Organizational culture | Antony et al. (2012) |
| 9 | Readiness factor for lean implementation | Leadership, organizational culture, communication, training, measurement and reward systems | AL-Balushi et al. (2014) |
| 10 | Readiness factors for the Lean and Six Sigma | Motivation, willingness, risk taker, positive environment, sufficient resources and appreciation policy, process management, smart goals, supportive organizational culture, equal opportunity and talent hunt, monitoring and control | Antony (2014) |
| 11 | Readiness of lean in manufacturing | Organizational culture, Strategic and operational vision, Core personal competence | Shokri et al. (2016) |
| 12 | Lean readiness assessment model | Process management, supplier management, customer relationships, human resource management, top management and control management | AL-Najem et al. (2012); Mohamad (2014) |
The LRAMs presented by Mohamad (2014); Shokri et al. (2016); Antony (2014); AL-Balushi et al. (2014) are more closely aligned to our goal. Therefore, we adopted and modified the LRAM presented in Mohamad (2014) which has been used for measuring the lean readiness of Kuwaiti small and medium enterprises prior to implementing the LMS. Six CSFs were included in that model: process management, supplier management, customer relationships, human resource management (HRM), top management and management control. For our model, we adopted 7 CSFs from that model, with one additional factor of communications management which we added due to its vital importance in the coordination and communication activities that are essential to an HO's disaster response and relief operations. It inevitably involves multiple stakeholders and demands efficient and effective communication between the field of the disaster, and with coordination centres. Implication and interpretation of each CSF in terms of HOs LRA is described below in details.
2.2.1 Processes management (PRM)
The presence of non-value-adding activities (wastes) in process management adversely affects employee productivity, so process management is an important success factor for the implementation of LM and enhancement of overall organizational performance (Zhang et al., 2012; Zhang et al., 2000; Lewis et al., 2006; Gotzamani and Tsiotras, 2001). The processes that are usually included in HOs' logistics and supply chains are procurement processes, logistics processes, distribution processes, warehousing processes, financial processes, safety processes, inventory processes, security processes, monitoring and evaluation processes, information and coordination processes and administrative processes (Makepeace et al., 2017). One of the few studies presenting the case of process improvement have used contingency theory for humanitarian settings (Larson and Foropon, 2018), which reflect the criticalness or importance of process management in LRA of HOs was evaluated, in our study, by a questionnaire-based survey for the purpose of testing the following hypothesis.
Process management is an important and significant factor that contributes to HOs' LRA.
2.2.2 Planning and control management (PCM)
The role of planning and control management is to establish the continuous improvement of all internal processes in the organization and to then monitor the progress of planned improvements (Chin and Pun, 2002; Gotzamani and Tsiotras, 2001; Chong and Rundus, 2004). In HOs, one of the prime functions of planning and control management is to maintain the quality of the humanitarian services offered (Heaslip et al., 2018), as well as optimizing the satisfaction of the community and donors, such arrangements can be explained through complexity theory while reflecting the dynamic capability view and integrating lean into the planning and control management of HOs (Altay et al., 2018). Moreover, the important elements for assessment of planning and control management include: Supply chain plans, Benchmarking, Standardizing and Monitoring and evaluation. Therefore, the importance of planning and control management for LRA was assessed through a questionnaire survey to test the following hypothesis.
Planning and control management is an important factor which may significantly contribute in HO's LRA.
2.2.3 Customer relationship management (CRM)
The ultimate aim of any organization is to attain and maintain customer satisfaction with optimum utilization of resources, an aim highlighted by many authors (Zu et al., 2010; Golicic and Medland, 2007). For satisfactory achievement of these aims, organizations must be aware of the nature and characteristics of their customers and their requirements (Found and Harrison, 2012). The customers in HOs are categorized as either donors who pay the money to be spent on appropriate operations and services, or are the ultimate user or recipient of that money, operations or services, known as the community of beneficiaries (Antai et al., 2015; Falagara Sigala and Wakolbinger, 2019). The support for CRM can also be sourced from the studies that call for the need of better multilateral partnerships between HOs and businesses (Nurmala et al., 2018). In terms of assessment, the elements recommended for donor relationships and beneficiary (customer) relationships are: Understanding the donor and community, awareness of donors and the community, feedback from donors and the community, involvement of donors and the community and organizational relationships between donors and communities. To assess criticalness of customer relationship towards the LRA, the following hypothesis was stated:
Customer relationships are a significantly important factor for LRA of an HO.
2.2.4 Supplier relationship management (SRM)
Quality suppliers enable organizations to deliver quality products, with timely delivery (just-in-time), and are considered the essential element of the LMS (Zu et al., 2010; Golicic and Medland, 2007; Found and Harrison, 2012). The SRM for humanitarian supply chains is considered as a challenge and improvement is projected to have promising results in regards to humanitarian operations (Wagner and Thakur-Weigold, 2018). Important elements for suppliers and HO relationship assessment are: quality of suppliers, supplier involvement, number of suppliers, supplier feedback and long-term framework agreements (Falagara Sigala and Wakolbinger, 2019). The hypothesis developed for the assessment of supplier relationships was:
SRM is a significantly important factor for HOs LRA.
2.2.5 Human resource management
According to the Toyota Lean Philosophy, the employees are the core assets of the organization, and employees' respect and development are considered to be key factors for supporting innovation and LM growth (Badurdeen et al., 2011; Liker and Hoseus, 2009). Respect for employees, training and development, empowerment in decision making and encouragement with incentives are the major factors in terms of successful LM (Zu et al., 2010; Zhang et al., 2012). Moreover, cross-section partnerships of HOs are presented to be vital for HRM (Nurmala et al., 2018). The significance of HRM in terms of LRA was been assessed to test the following hypothesis.
HRM is a significantly important factor for HOs' LRA.
2.2.6 Communication and coordination management (CCM)
Communication and coordination in supply chain management is conceptualized as different inter-related elements such as information sharing, goal congruence, decision synchronization, resource sharing and joint knowledge creation (Cao, 2010; Villa et al., 2017). Without proper communication and coordination in supply chain management, it would not be possible to achieve the 7Rs (right goods, right time, right place, right source, right cost, right condition and right quantity) (Makepeace et al., 2017). In the HO sector, media coordination, collaboration with partner organizations, coordination with security agencies and governmental relations are highly important elements in this regard (Adem et al., 2018). Furthermore, the government and donors have pushed the HOs for collaborative relationships (Moshtari, 2016) and need of better communication by information diffusion (Altay and Pal, 2014).Therefore, the HO with a stronger communication and coordination system will be more ready to implement LM. Criticalness of communication and coordination factor in terms of LRA was evaluated through the questionnaire survey to test the following hypothesis:
Internal and external CCM is a significantly important factor for HO's LRA.
2.2.7 Top management and leadership (TML)
The success of any HO can be measured by the amount and quality of the humanitarian services delivered, and the efficiency of delivery, which can only be achieved through leadership commitment and organizational vision (Chin and Pun, 2002; Angelis et al., 2011; Zu et al., 2010). The TML has been considered vital for humanitarian supply chain operations as they can cultivate intergroup leadership (Salem et al., 2019). The most significant elements for assessment of leadership and top management are: visible management, knowing people's capabilities, commitment and continuous improvement, performance evaluation and promotion of research and development. The significance of these in assessing HOs' lean readiness was tested according to the following hypothesis.
TML is significantly important for LRA of HOs.
2.2.8 Organizational culture management (OCM)
In addition to the seven CSFs considered in our study, we were also fully cognizant of the necessity for a supportive organizational culture as a pre-requisite for lean implementation, and as a mediating factor for our LRAM. As mentioned in Section 2.1 (first paragraph), a positive organizational culture is mandatory and its requirements for the HO sector would be different in nature from that of organizations in the corporate sector. The eighth hypothesis represents the mediating variable by which organizational culture significantly mediates the above-mentioned CSFs for LRA. Admiring the success of Toyota in their “lean” achievements, and wanting to emulate that success, many other companies initially tried to implement Toyota's lean system, but many of them failed. In most cases, the non-supportive organizational culture was identified as the cause of that failure (Spear and Bowen, 1999). Researchers then tried to identify and better understand the secrets of Toyota's LM success and eventually attributed it to the persistent implementation of the lean principles (Liker, 2004; Hino, 2005). The key elements of Toyota's positive organizational culture and lean success are: respecting the skills and contributions of all people, teamwork, modesty, giving first priority to the customer, identifying the root cause of problems, facing problems directly and continuous improvement (Bessant et al., 1994; Bhuiyan and Baghel, 2005). Organizational culture key constructs include: adoptability, mission, involvement and consistency. Furthermore, the element of trust and commitment have been the building blocks for organizational culture management of HOs, grounded in commitment-trust theory, for better HLSCM (Dubey et al., 2019). Recently, even technological applications integrate with OCM for efficiency enhancement of HOs (Dubey et al., 2019).
A positive, supportive, organizational culture significantly mediates CSFs in the assessment of HOs' lean readiness.
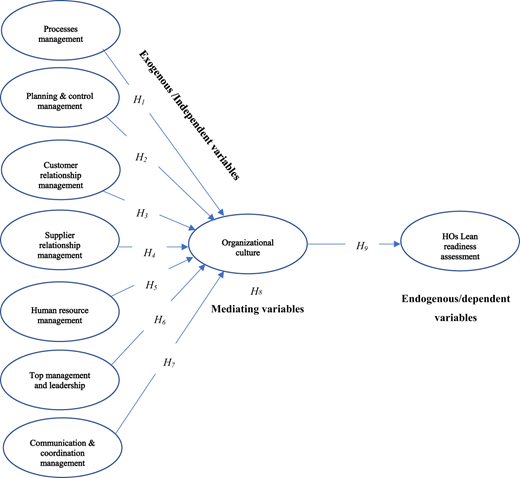
The CSFs discussed above were conceptualized as independent (exogenous) variables and organizational culture was the mediating latent variable whose presence affected the relationships of the dependent and independent variables. LRA itself is a dependent (endogenous and latent) variable that is influenced by other variables in the model as described below.
2.2.9 Lean readiness assessment
LRA is the dependent variable, although all of the above factors are hypothesized as being critical for LRA (AL-Najem et al., 2012; Mohamad, 2014). The supportive organizational culture is the mediating tool for the implementation of these factors. The last hypothesis was developed to test the relationship effects of all dependent variables on this dependent variable as mentioned below.
LRA is significantly influenced by these CSFs, e.g. processes management, planning and control management, CRM, SRM, HRM, CCM, TML management and organizational culture.
Therefore, for the assessment of HOs' lean readiness, these CSFs were tested through structural equation modelling based on an hypothetical framework described by Ertem et al. (2010). Following the hypothesized structure, the independent, dependent and mediator variables were defined, and a conceptual model was structured as depicted in Figure 1. The conceptual model was validated through PLS-SEM using the SmartPls 3® software and a final LRAM was developed, achieving the main goal of this study.
3. Methodology
Our conceptual model was tested using a PLS-SEM estimation. The validation of our hypotheses was achieved through a questionnaire-based survey of HLSCM professionals. The survey questionnaire was developed based on LM techniques following the analogy of Mohamad (2014) and AL-Najem et al. (2012). The questionnaire was discussed with a panel of five HO supply chain management experts that included three HLSCM professionals who were either a current employee of the United Nations Organizations (Agency), or an employee of international non-government organization HO, or of a national non-government organization HO. The questionnaires were discussed in detail with all the experts together in two rounds and their recommendations were incorporated before circulating the questionnaires as the final survey. Each variable of the conceptual model was constructed with at least five questions, each assessed on a Likert Scale: 1. Strongly disagree, 2. Disagree, 3. Neutral, 4. Agree and 5. Strongly agree (Yaseen et al., 2018). Additionally, the background information of all respondents was also gathered to estimate their education level, their type of organization (national or international) and their total years of experience in the HO sector. This information supports the quality of the responses.
The targeted population for this study were HO professionals from both national and international organizations. Following the James Stevens' sample size general rule of 15 cases per variable (Stevens, 1996), a total of 135 responses were required. Utilizing the author's professional relationships with the HO industry, and using snowball sampling techniques, the questionnaires were circulated by e-mail among more than 500 HO professionals, using the sharing facilities of Google Forms. By on-going coordination, follow-up and gentle reminders, 180 HO professionals responded, giving a 36 per cent response rate. Focusing on the quality aspects, it was decided to eliminate the responses of those professionals who had less than two years' HO sector experience. All of the collected data was analysed using the SmartPLS 3 software. The analysis was run to construct the PLS-SEM to validate our conceptual model. PLS-SEM is a promising and relevant data analytical approach that is particularly suitable for providing empirical support for nascent theory (Hair et al., 2012; Sarstedt et al., 2014; Sosik et al., 2009). PLS-SEM is not impeded by a large number of stringent and impractical assumptions, and it is prediction-oriented in nature. It is a useful technique for context-driven predictions and for estimation of relationships between the endogenous (dependent) and exogenous (independent) variables under inquiry (Streukens and LEROI-Werelds, 2016).
Bootstrapping, algorithm and blindfolding analysis were used for variable analyses and for positively proving the factors of the conceptual assessment model, while negatively proven factors were dropped from the final LRAM. Descriptive statistics (mean and standard deviation) were also run to calculate the significance of the conceptual model CSFs. The hypothesis was tested, and the adequacy of the model was proven by regression weights. Model construct reliability was also assessed using Cronbach's alpha and the composite reliability, while construct validity was also produced for assessing the validity of latent variables using convergent and discriminant results. The significance in similarity in the responses of individual variables was assessed to know the variance in the individual's opinion. The details of all this analysis are given below in the Results section.
4. Results
Validation of the latent, exogenous and moderating variables was processed through the implications of PLS-SEM (Henseler et al., 2014). The primary reason of using PLS-SEM was the small sample size (163 respondents) and context-driven prediction of the latent variables which are under enquiry (Henseler et al., 2014).The structural model was analysed using the SmartPLS3 (Yaseen et al., 2018). The results are divided into three parts: the first part was analysis of the respondents' demographic information; the second part was analysis of the measurement model results and the third part was analysis of the structural model results.
4.1 Respondents' demographic information analysis
Demographically, more than 80 per cent of the respondents were male and 20 per cent female, see Table II. This discrepancy may be explained by the fact that there is a clear gender imbalance in this HLSCM field, perhaps indicating a social issue in the sector.
Demographic details (n = 163)
| Description of demographic information | Frequency | Percentage | |
|---|---|---|---|
| Gender of respondent's | Male | 131 | 80 |
| Female | 32 | 20 | |
| Total years of experience employed in the humanitarian sector | Less than two years | 1 | 1 |
| 2- to five years | 11 | 7 | |
| 6–10 years | 88 | 54 | |
| More than 10 years | 63 | 39 | |
| Respondents current job position or designation | Officer | 71 | 44 |
| Coordinator | 40 | 25 | |
| Manager | 41 | 25 | |
| Director | 9 | 6 | |
| Country head | 2 | 1 | |
| Type of HO, respondents worked | National HO | 76 | 47 |
| International HO | 35 | 23 | |
| Both | 52 | 32 | |
| Respondents highest education level | PhD | 3 | 2 |
| Master | 139 | 85 | |
| Bachelor's | 20 | 12 | |
| Intermediate | 1 | 1 | |
Over 54 per cent of the respondents had 5–10 years of HO sector experience, with 37 per cent having greater than 10 years' experience in the sector. The positions, or rank, of the respondents were: officer (44 per cent), coordinator (25 per cent), manager (25 per cent), director (6 per cent) and 1 per cent were country heads or consultants. As well, 47 per cent of the respondents were working with national HOs, 23 per cent were working with international HOs while 30 per cent had exposure to both national and international HOs.
Educationally, 12 per cent had attained a bachelor's degree, 85 per cent of the respondents had attained a master's degrees, with 2 per cent having a PhD (1 per cent were educated to less than Bachelor). These results showed that the educational quality and experience of the respondents were good, and their views were dependable. In the field of HLSCM, the deployment of PhD employees was very low which may well be one of the reasons for there being little research in this area. The reasons for this may well bear further investigation. These demographics of the respondent's will be supportive in future exploration of, and planning research into, the HO sector.
From the descriptive statistical analysis, the mean value of all variables (latent, exogenous and mediating variables) was high, at 4.7, which indicates that the CSFs are of significance and relevance for inclusion in the LRA model.
4.2 Measurement model results
Measurement and analysis of the CSFs included in the model started by testing the uni-dimensionality of constructs through exploratory factor analysis (Drew et al., 2016). The factors, representing questions in the questionnaire, containing low loading, were removed, with the main factors identified for further analysis.
Table III shows the overall quality criteria of the measurement model evaluation. The construct reliability was assessed by Composite Reliability and Cronbach alpha (Hair et al., 2012). The threshold point for composite reliability, and the Cronbach alpha, was determined at the minimum of 0.70 (Yaseen et al., 2018). All the Cronbach's alphas were found to be greater than the 0.70 threshold point, declared by Yaseen et al. (2018). The composite reliability also exceeded 0.70, which proved that the latent variables were very strong and proved significantly positive for LRA.
Quality criteria for measures assessments
| Variables construct | Measure | Measures outer loading | Cronbach's alpha | Composite reliability | Average variance extracted |
|---|---|---|---|---|---|
| Processes management | PRMO 2 | 0.882 | 0.799 | 0.870 | 0.626 |
| PRMO 3 | 0.751 | ||||
| PRMO 4 | 0.770 | ||||
| PRMO 5 | 0.754 | ||||
| Planning and control management | PCMO 1 | 0.717 | 0.827 | 0.886 | 0.662 |
| PCMO 2 | 0.873 | ||||
| PCMO 3 | 0.823 | ||||
| PCMO 4 | 0.832 | ||||
| Customer relationship management | CRMO 1 | 0.778 | 0.794 | 0.879 | 0.707 |
| CRMO 4 | 0.859 | ||||
| CRMO 5 | 0.883 | ||||
| Supplier relationship | SRMO 1 | 0.820 | 0.839 | 0.892 | 0.674 |
| SRMO 4 | 0.813 | ||||
| SRMO 5 | 0.846 | ||||
| SRMO 6 | 0.804 | ||||
| Human resource management | HRMO 1 | 0.720 | 0.787 | 0.854 | 0.540 |
| HRMO 4 | 0.789 | ||||
| HRMO 6 | 0.724 | ||||
| HRMO 7 | 0.722 | ||||
| HRMO 8 | 0.718 | ||||
| Top management and leadership | TMLO 2 | 0.865 | 0.808 | 0.888 | 0.727 |
| TMLO 3 | 0.741 | ||||
| TMLO 5 | 0.940 | ||||
| Communication and coordination management | CCMO 1 | 0.818 | 0.747 | 0.855 | 0.663 |
| CCMO 3 | 0.810 | ||||
| CCMO 6 | 0.815 | ||||
| Organizational culture | OCMO 1 | 0.791 | 0.879 | 0.909 | 0.626 |
| OCMO 2 | 0.730 | ||||
| OCMO 3 | 0.768 | ||||
| OCMO 4 | 0.749 | ||||
| OCMO 5 | 0.839 | ||||
| OCMO 6 | 0.861 | ||||
| Lean readiness assessment | LRAO 1 | 0.743 | 0.789 | 0.855 | 0.542 |
| LRAO 2 | 0.706 | ||||
| LRAO 3 | 0.753 | ||||
| LRAO 4 | 0.722 | ||||
| LRAO 8 | 0.756 |
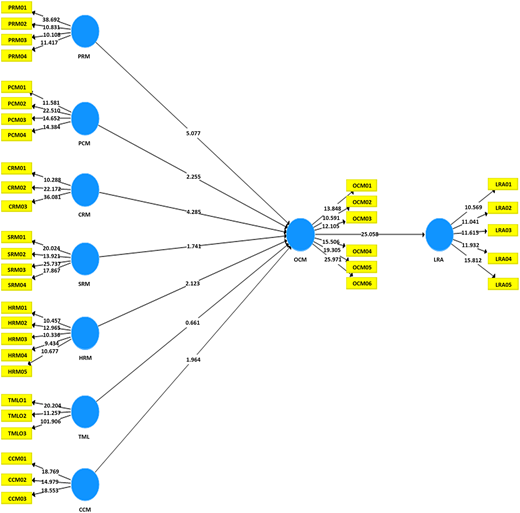
The construct validity was determined by convergent validity and discriminant validity. Convergent validity was assessed through composite reliability, average variance extracted (AVE) and loading of the items. A rule of thumb for composite reliability determined that the value should be greater than or equal to >0.70 (David Garison, 2016) and our analysis found the values to be very significant (Table III). Using the bootstrapping procedure at p < 0.05), AVE was used as a measure of convergent validity which also exceeded the minimum threshold of 0.5 for all constructs (Hair et al., 2013; Hair Jr et al., 2014). Factor loadings of items for all the constructs were found to be significant with the minimum threshold of 0.70, which shows a significantly positive relationship between independent and mediating variables on the LRAM, see Table III and Figure 2.
Discriminant validity was assessed through the “Fornell–Larcker criterion”, with the rule of thumb presented by Fornell and Larcker (1981) and Bagozzi et al. (1991) being that the square root of AVE should be greater than the correlation value of the latent variables. Table IV shows the values of AVE, where the square root was greater than the other correlation values of the latent variables (Hair et al., 2013, Henseler et al., 2014).
Latent Variables correlation
| Variables | TML | SRM | PRM | PCM | OCM | LRA | HRM | CRM | CCM |
|---|---|---|---|---|---|---|---|---|---|
| TML | 0.853 | 0.586 | 0.658 | 0.627 | 0.681 | 0.643 | 0.655 | 0.615 | 0.638 |
| SRM | 0.821 | 0.687 | 0.691 | 0.752 | 0.720 | 0.728 | 0.836 | 0.689 | |
| PRM | 0.791 | 0.693 | 0.762 | 0.727 | 0.719 | 0.793 | 0.739 | ||
| PCM | 0.813 | 0.709 | 0.707 | 0.704 | 0.784 | 0.688 | |||
| OCM | 0.791 | 0.713 | 0.721 | 0.833 | 0.802 | ||||
| LRA | 0.736 | 0.726 | 0.807 | 0.809 | |||||
| HRM | 0.735 | 0.821 | 0.801 | ||||||
| CRM | 0.841 | 0.798 | |||||||
| CCM | 0.814 |
To test the hypotheses, we used PLS analysis and followed the procedure recommended by Hair et al. (2011), Hair Jr et al. (2014). Given the distribution-free assumptions in PLS, the non-parametric bootstrap procedure with 5000 samples was used to examine the significance of the path coefficients (Hair et al., 2011; Hair Jr et al., 2014). Bias was corrected and accelerated (BCa) confidence interval was applied with a two-tailed test and p < 0.05. The path coefficients (β), t-statistics and p-values are reported with significance decisions as shown in Table V and Figure 3.
Summary of path coefficients, t-values and p-values
| Path | Path coefficients (β) | SD (STDEV) | T-statistics (|O/STDEV|) | P-values | Decision |
|---|---|---|---|---|---|
| PRM → OCM | 0.305 | 0.060 | 5.077 | 0.000 | Significant |
| PCM → OCM | 0.177 | 0.079 | 2.255 | 0.024 | Significant |
| CRM → OCM | 0.339 | 0.079 | 4.285 | 0.000 | Significant |
| SRM → OCM | −0.097 | 0.056 | 1.741 | 0.082 | Insignificant |
| HRM → OCM | 0.155 | 0.073 | 2.123 | 0.034 | Significant |
| TML → OCM | 0.028 | 0.043 | 0.661 | 0.508 | Insignificant |
| CCM → OCM | 0.138 | 0.070 | 1.964 | 0.050 | Significant |
| OCM → LRA | 0.813 | 0.032 | 25.058 | 0.000 | Significant |
Note(s): Critical value for t > 1.96, and significance value for p is < 0.05
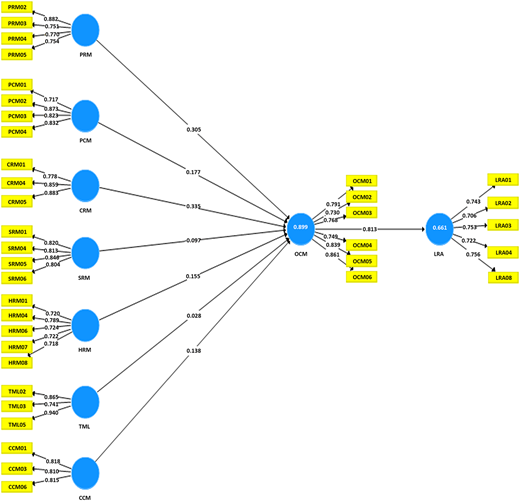
The magnitudes of the path coefficient β, t-values and p-values were found to be positive and significant for process management (β 0.3.5, t-value 5.077, p-value 0.000), planning and control management (β 0.177, t-value 2.255, p-value 0.024), CRM (β, 0.339, t-value 4.285, p-value 0.000), HRM (β 0.155, t-value 2.123, p-value 0.034), and CCM (β 0.138, t-value 1.964, p-value 0.050), OCM (β 0.813, t-value 25.058, p-value 0.000). These CSFs therefore are shown to have significant and positive effects on an HO's LRA. Organizational culture was found to be significantly supportive as a mediation variable of the LRA to HLSCM.
TML (β 0.028, t-value 0.661, p-value 0.508) draws little inspiration from this construct, with an insignificant t-value<1.95 and p > 0.05. Similarly, the value of SRM was insignificant, with negative β of −0.097, t-value = 1.741, and p = 0.082. Having proven the negative relationships, SRM was dropped from the final model, as were TML management. Figure 3 illustrates the model drawn by bootstrapping the results.
The adequacy of the model was tested by calculating the coefficient of determination (r2) (see Table V). The coefficient of determination r2 is most commonly used to measure and evaluate the structural model with the values 0.75, 0.50, and 0.25 for endogenous latent variables that are known to be substantial, moderate or weak (Hair et al., 2011, 2014). The results explain the 66 per cent variance in LRA and 89 per cent variance in organizational culture. These values show a substantial and moderate r2 for the model (Table VI).
Summary of structural model r2, q2 and f2
| Variables | R-square | Q-square | F-square |
|---|---|---|---|
| LRA | 0.661 | 0.325 | – |
| OCM | 0.899 | 0.510 | 1.954 |
| CCM | – | – | 0.051 |
| CRM | – | – | 0.175 |
| HRM | – | – | 0.053 |
| PCM | – | – | 0.107 |
| PRM | – | – | 0.285 |
| SRM | – | – | 0.025 |
| TML | – | – | 0.004 |
In order to assess the quality of the structural model, we computed the effect size, f 2, of each exogenous construct (Hair Jr et al., 2014). The threshold decided by David Garison (2016), that is the value f2, where f2 → 0.02 is small, f2 → 0.15 is medium and f2 → 0.35 is large. The results showed that OCM (f2 1.954) has a large effect, and the CCM (f2 0.051), CRM (f2 0.175), HRM (f2 0.053), PCM (f2 0.107) and PRM (f2 0.285) have a medium effect, whereas the SRM (f2 0.025) and TML (f2 0.004) have minimum effect which considered to be insignificant in relation. These results are shown in Table VI.
In a similar vein, the blindfolding algorithm was run in SmartPLS 3.0 to compute the cross-validated redundancy, and hence the predictive relevance, of each exogenous variable. The results indicated that the q2 value of LRA = 0.325, and the q2 value of OCM = 0.510 and both are significant to the threshold value > 0 (David Garison, 2016), please see Table VI.
5. Discussion and research implications
The purpose of this study was to contribute to the efficient utilization of HOs' resources by achieving cost and time efficiencies to the HOs' processes and activities. To achieve this aim, LM was considered a viable tool which can be applied within an HO. However, assessment of an HO's lean readiness prior to implementation was considered essential to consider the likelihood of success of that implementation. To this end, a LRAM for the HO sector was created and validated as an important and significant step towards achieving social and economic sustainability within the HO sector. The conceptual model was based on the seven CSFs which were identified from the synthesis of the research information identified in our literature review and subsequently validated through PLS-SEM. The model also addressed and included a mediating factor known as a supportive organizational culture. The results showed a positive relationship among the latent variables and showed that the CSFs were significant in the assessment of LRA. Organizational culture was also identified as a significant mediating variable.
So, to summarize, the accepted factors for the LRAM are: process management, planning and control management, CRM, HRM and CCM. The mediating factor “organizational culture management” was also considered to be significant.
The values of SRM and TML were insignificant and non-supportive for both organizational culture and LRA. The reason for this, as the authors understand, is that HOs discourage strong supplier relationships as this is usually considered to potentially create a conflict of interest. Perhaps also – and this was not tested – given the random timing and geographic distribution of natural disasters, being bound to a particular supplier may not either efficient or effective in a particular disaster situation where local suppliers would be more appropriate. This tends to fly in the face of the proposition of lean readiness. TML, however, could prove negative as HOs always project self-empowerment and leadership as an organizational concept, where every employee is encouraged to consider themselves as a leader and independent of management control, especially when working “in the field” in a natural disaster situation. Finally, the factors included in the LRAM were process management, planning and control management, CRM, HRM, and CCM. This LRAM will be applied in the HO sector following the Paul Myerson lean assessment criteria (Myerson, 2012).
According to these lean assessment criteria, these CSFs will be considered by the HO's staff as to their relevance and presence in the organization. Where these criteria are measured as having a mean value between 0 and 20 per cent, this would indicate that the organization has a traditional supply chain and logistics management system and therefore is not ready to implement LM. It would further indicate that the HO needs to develop and improve its organizational culture before the implementation of LM is likely to be successful. A mean value of these criteria between 20 and 40 per cent indicates that the organization has the foundation and supportive organizational culture, but this needs to be further developed to ensure that the adoption of a LMS would be successful. If the mean value is between 40 and 60 per cent, this would indicate that the organization is already in a state of readiness to implement LMS and has probably already progressed in implementing a LMS. The organization will be aware of the necessity of an LM, and already has a good foundation for implementing an LMS. A mean value of LRAM factors between 60 and 80 per cent clearly indicates that the organization is in good readiness to implement the LMS, and a mean value between 80 and 90 per cent shows that the organization has already applied fully a LMS and only needs continuous improvement action. A mean value above 90 per cent indicates that the organization has the best LMS in place and is already fully functional with a state-of-the-art LMS (Myerson, 2012).
The LRAM provided here is simple and is an easy-to-use tool that will allow managers to understand their current practices and to evaluate if their organizational and managerial environment is supportive of a LMS, or if these need to be addressed and appropriately modified before a successful implementation is likely. This will inform managers if they have the required resources for a successful LMS implementation and to identify if they are able to afford the resources necessary for this purpose. For example, by using the LRAM, managers will be able to assess the HRM factors of availability of skilled workers, workforce empowerment and investment of funds for training to implement LMS. If HOs are not ready to adopt these of items, they will have a minimal chance of success in LMS and attempts at the implementation of LMS will itself cost the organization.
6. Conclusion
From our literature review, we can conclude that LM is a valuable tool for resources conservation in HOs. LM is a proven philosophy encompassing an on-going process of continuous improvement in the organization's overall supply chain management system. Through the continuous improvement in the conservation of resources, HOs can save cost, thereby enabling them to spend this saving on serving more people in affected communities. These savings directly contribute to HO sector social and economic sustainability.
LM implementation itself is a cost, thus before implementation of LM it is necessary to check the readiness of the HO to implement the lean system. In this study, a LRAM was developed with the intention of helping HOs to assess their own readiness to implement the lean system. The CSFs that proved significant for the final LRA model were: processes management, planning and control management, donor and community relationship management, HRM, and communication and coordination. The SRM and TML factors proved insignificant which were dropped from the final LRAM. These results are identical to the previous studies conducted by Shokri et al. (2016); Mohamad (2014); Antony (2014); AL-Balushi et al. (2014). This model will contribute to the development of LM awareness that motivates the HOs to adopt lean supportive culture. The adoption of a lean culture will expedite the delivery services and supplies to the targeted communities in the most timely and cost-effective manner. Cost minimization will create the opportunity to serve the maximum number of people, thereby making a substantial contribution towards the social and economic sustainability of the HO sector.
While this model has been established particularly for the HO sector, it is not limited to this sector. Other sectors, particularly those characterized as being not-for-profit and disaster management (e.g. disaster management authorities, hospitals and search and rescue organizations), share similar cultures and values and the LRAM can be generalized for them, bearing in mind that LMS requires certain types of cultures, in both the organizational and a national sense. Further work, to assess and validate the LRAM in situ in organizations in the HO sector is necessary, and this will be embarked upon in the near future. An additional matter identified in the demographics of the participants is the gender imbalance in humanitarian logistics and supply chain management departments which would beneficially be addressed in HOs' future policies.

