


The aim of this research is to improve the responsiveness of the healthcare network of a large city to a major earthquake, by applying a combined methodology to reduce human suffering and death.
Scenario analysis, a non-linear programming (NLP) model, and the analytical network process are sequentially applied to find the “best location pattern”.
When considering the occurrence of major earthquakes in cities with high population density, as a rule of thumb, the location of healthcare facilities should prioritize areas characteristically overcrowded and/or that were built based on poor standards of seismic resistance.
The proposed research design does not include a cost criterion in the set of decision variables involved. Furthermore, the results derived from the NLP-model are restricted by the input simulation data.
The performance of the “best location pattern” is compared with the current location of healthcare facilities in terms of their distances to the affected zones. Metropolis areas worldwide with similar conditions to the city under consideration could be benefited from applying the general methodology for relocation of healthcare facilities described in this research.
This research implements a diverse combination of methodologies to examine the problem of relocating of healthcare facilities in a large city in the wake of an assumed earthquake. In addition, to the best of authors' knowledge, this is the first study of its kind that proposes improvements in the responsiveness of the healthcare facilities' network in the city in question.
Highlights
This research introduces a novel solution approach based on the application of three research methodologies, to the healthcare facility relocation problem posed.
It builds a thorough conceptual framework that includes the use of input simulation data, three different sets of decision variables, and output variables in the form of a pattern of location.
It applies a combined solution approach by considering the strike of a major earthquake in a large city with high population density.
The resulting location pattern increases the responsiveness of the public healthcare network of the city under consideration by bridging the distance between the earthquake's affected zones and its healthcare facilities.
1. Introduction
Modern cities are complex social organizations exposed to a myriad of risks and hazards, ranging from earthquakes to smart bombs (Vale and Campanella, 2005). Within this wide spectrum of risks, and with the potential to negatively affect any city on the planet, natural disasters are the most lethal category (Chang, 2015). According to Chang's study, in the period between 1980 and 2008, 2,319,470 total fatalities were reported in total as a result of 8,809 natural disasters worldwide. This death toll is 987% higher than the number of fatalities (235,018 victims) left by the second most lethal risk-type – that is industrial, transport and miscellaneous accidents. This high number of casualties is caused despite the fact that natural disasters are not the most frequent category of risk registered in the analyzed period; terrorist acts are in fact the event with the highest frequency of occurrence, with 9,231 reported cases. The natural disaster typology integrates several types of risk, including fire, earthquake, flood, drought, volcano, hurricane/typhoon (Coaffee et al., 2009) and more recently epidemic disease (Nakamura and Managi, 2020). Of all of them, earthquakes are the deadliest and most destructive natural disaster-type (Guha-Sapir et al., 2013). According to CRED (2017), in the period between 2007 and 2017, earthquakes alone caused the death of 36,186 people and economic losses above US$55.4 billion worldwide.
The present analysis focuses in the city of Bogotá – known for being the political capital and most populated city of the Republic of Colombia – as a case study. Geographically, Bogotá is located in the center of the country, in the Cundinamarca province, surrounded by the Eastern cordillera of the Andes Mountains, in a moderate-to-high seismic hazard region (IDIGER, 2010). Since its founding by the Spanish conquistador Gonzalo Jiménez de Quesada in 1538, the city of Bogotá has not been spared the occurrence of several major earthquakes of varied magnitude, as listed in Table 1. A major earthquake is one with a magnitude that ranges between 7.0 and 7.9 on the Richter scale (UN, 2011).
List of major earthquakes in the city of Bogotá (1538–2021)
| Year | Magnitude in the epicenter* | Magnitude in Bogotá* | Epicenter area, Province |
|---|---|---|---|
| 1616 | 6.0 | n.d | Cajicá, Cundimarca |
| 1644 | 7.0 | n.d | Pamplona, Norte de Santander |
| 1644 | 7.0 | 6.0 | Chipaqué, Cundinamarca |
| 1646 | 6.5 | n.d | Sogamoso, Boyacá |
| 1743 | 6.5 | 6.5 | Páramo de Chingaza, Cundinamarca |
| 1785 | 7.0 | 6.7–7.2 | Páramo de Chingaza, Cundinamarca |
| 1826 | 6.5 | 6.2 | Sopó, Cundinamarca |
| 1827 | 7.5 | 7.7 | Timaná, Huila |
| 1917 | 7.0 | 7.1 | Páramo de Sumapaz, Cundinamarca |
| 1923 | 6.5 | n.d | Paratebueno, Cundinamarca |
| 1924 | 6.5 | 6.7 | Gachalá, Cundinamarca |
| 1928 | 6.0 | n.d | El Milagro, Cundinamarca |
| 1967 | 7.0 | 7.0 | Los Cuachos, Cundinamarca |
| 1967 | 6.5 | n.d | Chucurí, Santander |
| 1979 | n.d | 7.2 | El Cairo, Valle del Cauca |
| 1994 | n.d | 6.8 | Páez, Cauca |
| 1995 | n.d | 6.5 | Tauramena, Casanare |
| 1999 | n.d | 6.1 | Córdoba, Quindio |
| 2008 | n.d | 5.7 | Quetame, Cundinamarca |
Note(s): *Measured on the Richter scale; n.d.: not determined
Source(s): Adapted from IDIGER (2010) and JICA (2002)
While the dates and epicenter areas of earthquakes in Table 1, which have affected the city of Bogotá, are well-documented, the total number of deaths and traumatic injuries, as well as the accumulated economic losses, are all uncertain data. In this vein, in a prospective study of the World Bank on risk disasters in Colombia (2012), the earthquake disaster-type was found to be the most critical event, with total estimated deaths of 20,000, the predicted number of injured people at 48,000, and economic losses calculated at US$12.7 billion. Similarly, in a risk simulation study, Yamin et al. (2013) considered scenarios for earthquakes in Bogotá with magnitudes varying between 6.8 and 7.4 on the Richter scale. According to these authors, if the above-mentioned earthquakes were to occur, the number of deaths would be between 9,234 and 38,846, and the number of injured between 17,042 and 64,997. Furthermore, the seismic vulnerability of Bogotá has increased over the years due to two main factors. First, unplanned internal migration flows from other provinces of the country have landed in the city since the 1950s (Guzman et al., 2017); and second, at least 75% of the city has grown and been built in a disorderly way, without meeting high standards of seismic resistance (Chicangana et al., 2014).
Based on the above, this research paper addresses the problem of the location of healthcare facilities in the event of a major earthquake in the city of Bogotá. Inadequate healthcare facility location (HFL) is a situation associated with increased morbidity and mortality (Ahmadi-Javid et al., 2017). In this regard, Bartels and VanRooyen (2012) pointed out that earthquakes frequently affect populated urban areas with low structural standards, causing high mortality rates and many traumatic injuries in a short period without prior warning. According to these authors, earthquakes not only cause many deaths initially, but also many serious injuries that require highly complex medical care. Additionally, a collateral effect of earthquakes in cities is the destruction of roads and means of transport (Van Wassenhove, 2006). Unfortunately, the previous characterization is not unique to the city of Bogotá, but a similar phenomenon in several large cities of Latin America that face the threat of a major earthquake: poorly constructed buildings, rapid urbanization and crowded shantytowns (Fisher et al., 2014; Hausler, 2013).
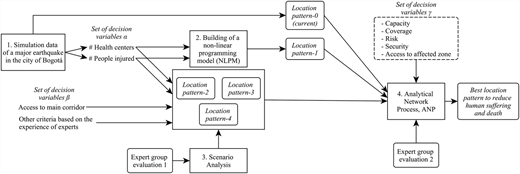
Therefore, the primary motivation of this research is to improve the healthcare network's responsiveness to the city of Bogotá by applying a general methodology to reduce human suffering and death in the event of a major earthquake, as explained in Figure 1. More specifically, based on the independent and multiple decision variables selected, this study relocates 33 health centers of the current healthcare network by applying three different but complementary methodologies in order to find a “superior solution”. Thus, to the best of the authors' knowledge, this research is the first to use such combined methodological analysis in the context of the HFL-problem. The remainder of this paper is organized as follows. Section 2 reviews the existing literature related to the research problem posed, from which some gaps emerge. In Section 3, the paper introduces the research problem to be solved in terms of the current distribution of the health center network. Section 4 describes in detail the sequential application of the three research methodologies selected. In Section 5, the results of the sink methodology (ANP model) are discussed in light of the health centers' current distribution. Finally, Section 6 presents the conclusions of this investigation and suggests new research streams.
2. Literature review
The stated research problem can be labeled in terms of the following three criteria: “pre-disaster stage, preparation sub-phase,” “healthcare-facility location problem in the public sector” and “earthquake-disaster type.” The review of the extant literature carried out in this study is based on these previous research streams.
2.1 Pre-disaster stage, preparation sub-phase
From a macro-perspective, the field of humanitarian logistics comprises two main stages: pre-disaster and post-disaster phases (Upadhyay et al., 2020). Thus, while the pre-disaster phase describes all the initiatives that can be carried out before the disaster strikes (Tavana et al., 2018), the post-disaster phase encompasses all the actions performed after its occurrence (He and Zhuang, 2016). Generally speaking, the phase of pre-disaster – or logistics preparedness – covers a wide range of efforts, ranging from emergency plans and risks identification to vulnerability assessment (Jahre et al., 2016; Kovacs et al., 2021) Among all these prevention efforts, asset prepositioning and infrastructure preparation strategies both play a fundamental role in increasing the response capacity in healthcare networks (Apte, 2010). However, for the case of sudden-onset disasters such as earthquakes, the asset pre-positioning strategy seems unrealistic due to the enormous uncertainty associated with the occurrence of such events (Arnette and Zobel, 2018). This is the case despite some authors having used unmet demand penalties as decision variables – see for example Alem et al. (2016). The preparation sub-phase includes location of various types of facility, including warehouses, shelters, distribution, medical centers and vehicles (Boonmee et al., 2017; Golabi et al., 2017).
2.2 Healthcare facility location problem, HFL-problem
Within the field of the humanitarian logistics framework, the problem of HFL is usually placed in the pre-disaster stage, a sub-phase of preparation (Boonmee et al., 2017). Several authors have pointed out that the goal of disasters response in humanitarian aid chains is to provide rapid relief to affected areas in order to minimize human suffering and death (Balcik and Beamon, 2008; Beamon and Kotleba, 2006). Since Rahman-Smith's (2000) seminal work on location of healthcare facilities was published, more than 400 publications on this topic have been referenced to date in the Google Scholar database. This relatively high number of references is a clear sign of the prime importance of the HFL-problem for humanitarian logistics, and of the marked interest that this topic arouses currently among academics and practitioners (Boonmee et al., 2017). Depending on the main objective of the facility location models, they can be classified as either focused-on-private or focused-on-public issues (Karatas and Yakıcı, 2018). Thus, while the first type of model seeks to optimize cost/profit functions, the second type primarily targets the optimizing of user accessibility and response time (Balcik and Beamon, 2008). Furthermore, four main, distinct solution approaches have been applied so far to the HFL-problem, including: optimization (Li et al., 2011), heuristic algorithms (Sauvey et al., 2020), decision-making (Taimaz et al., 2020) and simulation models (Leiras et al., 2014). Nevertheless, the solving method preferred by researchers has been optimization in the form of mixed-integer programming models (Caunhye et al., 2012).
2.3 Earthquake-disaster type
For the review of earthquakes in the context of the HFL-problem, 16 articles were found and examined as follows. Balcik and Beamon (2008) analyzed the problem of distribution network design in humanitarian relief for a generic aid organization. These authors used robust optimization for a mixed integer linear programming model to determine the number and location of the distribution centers, and the amount of relief inventory required to satisfy the immediate needs of people affected by quick-onset earthquakes. Similarly to previous authors, Kılcı and Kara (2014) proposed a mixed integer linear programming model for selecting the location of temporary shelter sites in the event of an earthquake in the city of Istanbul, Turkey.
Mete and Zabinsky (2010) developed a two-stage stochastic programming model for the problem of storage and distribution of medical supplies in the city of Seattle, USA, in the event of an earthquake. These authors incorporated within the objective function the total cost of operation of the warehouses and, for the stochastic variable, the impact of disaster scenario and inventory levels. Lin et al. (2012) studied the location of temporary depots in an area affected by an earthquake by using a combination of a deterministic optimization method and a heuristic algorithm: a mixed-integer model and a two-phase heuristic approach. The model proposed by these authors integrates as decision variables the depot locations, the assignment of demand points and the number of available vehicles to optimize the logistical performance.
Paul and Hariharan (2012) proposed a mixed-integer programming model that takes into account both hurricanes and earthquakes to minimize the social cost measured in terms of the number of fatalities and the inventory cost. These authors considered two independent sets of information for each type of risk in two different cities in the USA: New Orleans and Northridge. Das and Hanaoka (2013) applied robust optimization to select a network design taking into account the impact of four scenarios of earthquake in Bangladesh. These authors considered a cumulative cost function before and after the occurrence of disaster. Bozorgi-Amiri et al. (2013) formulated a multi-objective robust stochastic programming approach for modeling disaster planning and response in conditions of uncertainty. The source of uncertainty in this model is included through functions of demand, supply and cost. This analysis is applied on a disaster relief logistics network in a specific region of Iran, taking the occurrence of an earthquake as the triggering event.
Chen et al. (2013) proposed a mathematical optimization model to locate temporary shelters in the contingency of an earthquake that considers three levels of analysis: low, medium and high order needs. These authors studied this problem by minimizing the total population-weighted travel distance taking as a case study a suburban district of Beijing, China. Jabbarzadeh et al. (2014) designed a robust stochastic optimization model that considers blood donors, blood facilities and blood centers as decision variables, in order to minimize the total cost of the network. These authors took as a case of study the city of Tehran, Iran, in view of the occurrence of several seismic scenarios. Hu et al. (2014) analyzed the impact of an earthquake on shelter location selection by using a multi-objective optimization model combined with a non-dominated sorting genetic algorithm. These authors studied the Chaoyang District in the city of Beijing, China as a case study. Barzinpour and Esmaeili (2014) analyzed the location-allocation problem in the preparation planning phase by using a multi-objective mixed-integer linear programming model applied to the occurrence of an earthquake on the city of Tehran, Iran.
Salman and Yücel (2015) combined a stochastic integer programming model with a tabu search algorithm to determine a location of emergency response facilities that maximizes the total demand covered in case of earthquakes. Akgün et al. (2015) developed a non-linear integer optimization model for the pre-positioning of supplies through facilities located in disaster-prone areas. The objective function used was based on the minimization of the maximum risk that demand points are exposed to. These authors took as a triggering event the occurrence of an earthquake in Turkey. Verma and Gaukler (2015) used a combination of two-stage deterministic and stochastic programming models to obtain the optimal location for earthquake response facilities in the state of California. While the objective function of the deterministic model is based on the expected transportation cost over all disaster scenarios, the stochastic model uses as main variables the quantification of earthquake damages and the amount of supplies to be sent from facilities to demand points in each scenario.
In a similar fashion, Yang et al. (2016) analyzed the impact of four types of earthquakes in the same number of provinces of China by considering the use of strategic reserves. These researchers considered a network of supplies based on the Chinese Red Cross facilities, from which they developed a data envelopment analysis approach based on a function of expected demand for relief material in the seismic zone, with functions of cost and risk as inputs of the model. Finally, Golabi et al. (2017) studied the location of mobile and immobile facilities in the context of a major earthquake in Tehran, Iran. These authors combined a mixed-integer programming model with meta-heuristics to minimize the aggregated traveling time of people and unmanned aerial vehicles.
2.4 Gaps
Several authors agree that more research is needed on the preparation phase (Altay and Narayanan, 2020; Hezam and Nayeem, 2021). The main reason for this call is that there seems to be a greater positive impact on the development of actions in the pre-disaster phase than in later phases. However, the literature lacks clarity regarding what disaster-type the asset pre-positioning strategy – included within the preparation phase – could be utilized for. Therefore, following Sabbaghtorkan et al. (2020), more models adapted to specific types of disaster are needed. In the context of optimization, the HFL-problem could be solved by applying four main types of quantitative models: deterministic, stochastic, dynamic and robust (Boonmee et al., 2017). Yet, among the previous studies that considered earthquakes strikes, most of them chose to apply only one type of solution approach: deterministic optimization methods – such as the mixed-integer linear programming model or one of its variants. When this approach did not achieve convergent solutions, then heuristic algorithms – such as tabu searches – were also applied. Despite the robustness and elegance of the solutions derived from deterministic optimization methods, due to the number and complexity of phenomena involved in the analysis of the HFL problem, this type of model falls shorts in capturing all the critical decisions variables and their relationships. Therefore, new solution approaches integrating varied methodologies are needed to address the full picture of the HFL problem. The solution approach applied in the present research, and the derived analysis, are a unified attempt to fill in these gaps.
3. Description of the health network location problem
The city of Bogotá is the main industrial hub and most populated metropolis of Colombia with an estimated population of 7,412,566 inhabitants living within 1,775 square kilometers (DANE, 2018). In this research, we adopt the denomination of “large city” for Bogotá based on the definition suggested by the OECD (2012). The city is organized into a total of 112 zonal planning units or ZPUs. Each ZPU can be made up of several neighborhoods, which share common characteristics in terms of the area's urban development and predominant activities. As indicated in Figure 1, the probable damage of the seismic event considered in buildings and human life, and the negative effects on the population, are all based on data provided by IDIGER (2011), the Institute for the Reduction of Disasters and Emergencies of Bogotá, formerly called FOPAE. According to the IDIGER study, if an earthquake of magnitude 7.0 on the Richter scale were to occur in the frontal fault of the city of Bogotá, the number of deaths is estimated at 10,190, the number of injured at 55,817 and an estimated approximate portion of 12.9% of the city's buildings would be seriously affected (IDIGER, 2011).
Figure 2a describes the level of impact of a 7.0-magnitude-earthquake (Richter's scale) on each of the 112-ZPUs of the city. As it can be seen in this figure, in the event of the strike of the aforementioned earthquake, only 71-ZPUs would be directly impacted. This result describes the worst-case scenario of the above-mentioned earthquake, which occurs during daylight hours. Figure 2b shows the current location of the 51 public health centers that make up the health network of the city of Bogotá. In this analysis, this health center network configuration is set as location pattern-0. Of the total number of health centers shown in Figure 2b, those marked with the symbol (■) represent hospitals of high-level complexity that will not be relocated in the present analysis due to the elevated cost that this decision would imply. The exact geographic coordinates of all these health centers are provided in Table A1. The scenario of damages and effects shown in Figure 2 is used as an input data for all the solution approaches described below. In this regard, it should be noted that none of the five solutions provided – or location patterns – involves increases in the number of health centers initially considered (51), or in their capacity.
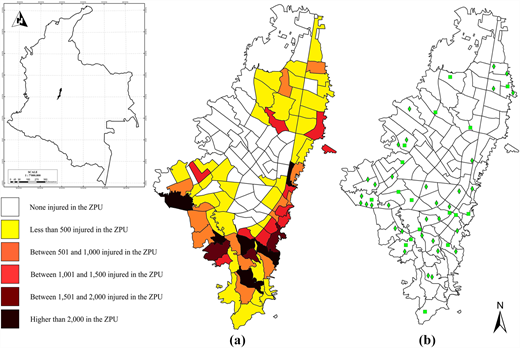
Effects on ZPUs (injured) of a 7.0-earthquake on the Richter scale and current location of health centers in the city of Bogotá
Effects on ZPUs (injured) of a 7.0-earthquake on the Richter scale and current location of health centers in the city of Bogotá
Geographic coordinates for current health centers (location pattern-0)
| Health center | Coord. X | Coord. Y |
|---|---|---|
| 1 | −74.070312 | 4.645915 |
| 2 | −74.128639 | 4.532573 |
| 3 | −74.09090 | 4.54700 |
| 4 | −74.11000 | 4.50660 |
| 5 | −74.11400 | 4.54500 |
| 6 | −74.151573 | 4.627679 |
| 7 | −74.11200 | 4.53300 |
| 8 | −74.10900 | 4.51500 |
| 9 | −74.12090 | 4.52270 |
| 10 | −74.11480 | 4.51350 |
| 11 | −74.107467 | 4.700025 |
| 12 | −74.151657 | 4.577909 |
| 13 | −74.15850 | 4.54490 |
| 14 | −74.154962 | 4.691574 |
| 15 | −74.19670 | 4.60750 |
| 16 | −74.13200 | 4.55870 |
| 17 | −74.14220 | 4.54440 |
| 18 | −74.089107 | 4.595274 |
| 19 | −74.14640 | 4.53700 |
| 20 | −74.10700 | 4.52200 |
| 21 | −74.15500 | 4.55500 |
| 22 | −74.117121 | 4.708978 |
| 23 | −74.06530 | 4.61920 |
| 24 | −74.120949 | 4.615113 |
| 25 | −74.11600 | 4.55700 |
| 26 | −74.13010 | 4.54020 |
| 27 | −74.160891 | 4.657342 |
| 28 | −74.15790 | 4.56640 |
| 29 | −74.16480 | 4.56690 |
| 30 | −74.10980 | 4.54920 |
| 31 | −74.13760 | 4.53920 |
| 32 | −74.096141 | 4.691605 |
| 33 | −74.11700 | 4.50600 |
4. Application of research methodologies
The combined application of the three following research methodologies has some advantages over the previous studies, mainly based on one type of solution. The present approach is not limited to the application of deterministic optimization and/or meta-heuristics methods, but rather it uses as a start point of the analysis. Second, it provides a more diverse and complete set of information by integrating optimal results with expert opinions, which reduces the uncertainty of the solution obtained. And third, the utilization of the ANP as sink node avoids introducing bias into the analysis performed.
4.1 Non-linear programming model (NLP)
4.1.1 Model assumptions
The following realistic range of assumptions must be made for the construction of the NLP model
The capability of the set of health centers I covers the demand for injured patient care during the occurrence of the earthquake. This assumption is chosen because in real disaster situations, the demand for medical attention exceeds the available capacity of health centers networks (Bartels and VanRooyen, 2012).
The set of health centers I and nearby roads (main corridors) are not affected/disrupted by the earthquake. This assumption is based on the premises that, first, hospitals and clinics are resilient, since they are built by using high standards of seismic resistance; and second, in the case of an earthquake, the priority of emergency teams is to clear out roads quickly (Van Wassenhove, 2006).
There is no minimum distance between any pair of the set of health centers I. The argument in favor of this assumption lies in the idea that the health centers can increase their capabilities and complementarity through the formation of clusters (Jahre and Jensen, 2010).
The objective function for the NLP model includes only one criterion: the minimization of the distance from the earthquake's affected areas to the health centers. This choice derives from the learning that long distances are a key indicator of poor-quality emergency management (Indriasari et al., 2010).
4.1.2 Notation
The objective function aims to minimize the distance from the affected zone to the health centers by using the following formula:Table 8
| Indexes | |
| I | set of health centers of city, i = {1 … 51} |
| J | set of affected zones of city, j = {1 … 71} |
| L | set of restricted areas for location, l = {1 … 36} |
| K | set of borderlines, k = {1 … 5} |
| Parameters | |
| Aj | coordinate on the x-axis of the affected zone j, j ∈ J |
| Bj | coordinate on the y-axis of the affected zone j, j ∈ J |
| BRk | parameter b of the borderline k, k ∈ K |
| Mk | parameter m of the borderline k, k ∈ K |
| Ci | capacity of the health center i, i ∈ I |
| PXl | location point on x-axis of restricted areas l, l ∈ L |
| PYl | location point on y-axis of restricted areas l, l ∈ L |
| MDl | minimum distance from coordinate (PXl, PYl) to restricted area l, l ∈ L |
| NAj | number of injured at the affected zone j, j ∈ J |
| HXi | coordinate on the x-axis of the health center i, i ∈ I |
| HYi | coordinate on the y-axis of the health center i, i ∈ I |
| HO | number of fixed health centers i, i ∈ I |
| Decision variables | |
| Xi | coordinate on the x-axis of the location of the health center i, i ∈ I |
| Yi | coordinate on the y-axis of the location of the health center i, i ∈ I |
| Nji | number of injured patients in the affected zone j attended by the health center i, i ∈ I and j ∈ J |
| with the set of decision variables α = {(Xi, Yi), Nij} | |
Subject to,
Constraint (Eq. 2) guarantees that the installed capacity of health centers to attend to the injured in the affected area is not exceeded. This assumption, though less plausible in practice, is necessary for the model to reach a solution within the feasible region. Constraint (Eq. 3) guarantees that all the injured patients in the affected areas are treated in health centers. Constraints (Eq. 4) and (Eq. 5) set the current location of health centers in the area where the indicated earthquake occurred.
In the present analysis, 18 health centers are fixed points of the set I, and it is assumed that they will not be relocated due to cost considerations. Constraints (Eq. 6) and (Eq. 7) guarantee that the coordinates of the 33 health centers to be relocated are within the geographic area of the city of Bogotá. Constraint (Eq. 8) guarantees that there is a minimum distance (MDl) between the restricted area selected on the map and the new location of the health center. As indicated in parameter l, there are 36 restricted areas in the city of Bogotá such as wetlands, recreational parks or airports. Finally, constraint (Eq. 9) restricts the values for coordinates (Xi, Yi) to the set of real numbers, and constraint (Eq. 10) prevents the values for Nij to the nonnegative, since the variable of the number of injured cannot be negative.
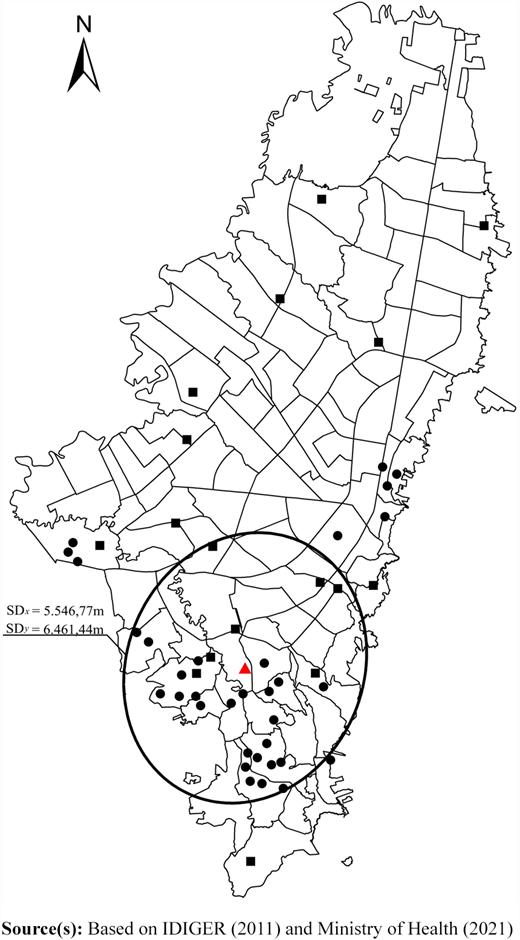
Figure 3 shows the optimal solution achieved by the NLP model. In the present analysis, this health centers network configuration is captured in the location pattern-1. However, it should be noted that location pattern-1 depicted in Figure 3 is not a global optimum but a constrained optimal solution (Wenyu and Yua, 2006), since 18 of the total of health centers considered are fixed points (see Figure 2). The circle in Figure 3 denotes the dispersion of data in terms of the standard distance (SD), and the red triangle symbol indicates the center of gravity of the health centers configuration. The exact geographic coordinates of all these health centers are provided in Table A2.
Geographic coordinates for health centers relocated (location pattern-1)
| Health center | Coord. X | Coord. Y |
|---|---|---|
| 1 | −74.088237 | 4.5152364 |
| 2 | −74.062814 | 4.6390343 |
| 3 | −74.090864 | 4.5469919 |
| 4 | −74.11666 | 4.5064801 |
| 5 | −74.114823 | 4.5442613 |
| 6 | −74.085357 | 4.6108305 |
| 7 | −74.115091 | 4.5439931 |
| 8 | −74.116438 | 4.515202 |
| 9 | −74.114933 | 4.5136976 |
| 10 | −74.114767 | 4.5135309 |
| 11 | −74.115063 | 4.5440206 |
| 12 | −74.062814 | 4.6390343 |
| 13 | −74.142594 | 4.5391776 |
| 14 | −74.115286 | 4.5140502 |
| 15 | −74.196618 | 4.6080922 |
| 16 | −74.142594 | 4.5391776 |
| 17 | −74.142594 | 4.5391776 |
| 18 | −74.11666 | 4.5064801 |
| 19 | −74.142594 | 4.5391776 |
| 20 | −74.115721 | 4.514485 |
| 21 | −74.142594 | 4.5391776 |
| 22 | −74.196618 | 4.6080922 |
| 23 | −74.065313 | 4.6192216 |
| 24 | −74.11871 | 4.5174742 |
| 25 | −74.115663 | 4.5566952 |
| 26 | −74.130059 | 4.5401906 |
| 27 | −74.062814 | 4.6390343 |
| 28 | −74.164791 | 4.5664457 |
| 29 | −74.164791 | 4.5664457 |
| 30 | −74.109846 | 4.549238 |
| 31 | −74.142594 | 4.5391776 |
| 32 | −74.196618 | 4.6080922 |
| 33 | −74.11666 | 4.5064801 |
4.2 Scenario analysis
The scenario analysis – or scenario development – is a subjective but systematic evaluation methodology that aims to answer two main questions: (1) How could a hypothetical situation arise? and (2) What alternatives exist so that the agents involved in the decision-making process can prevent, divert or manage the occurrence of said event (Ayyub, 2001; Gambelli et al., 2017). This solution methodology is used in this study to elicit information – or a set of decision variables β – from three experts in the field of humanitarian logistics – or expert group evaluation 1, based on their experience and knowledge. In this regard, it must be said that in terms of the completeness of the data (Emran, 2015), the set of decision variables ß is preferred over the set of decision variables α. The above argument is the primary justification for the inclusion of the scenario analysis methodology in this research. Equally important is the main assumption adopted for the application of the scenario analysis to this research: that the group of experts was required to undertake “robust actions,” that is, make decisions that produce the best possible results regardless of the associated costs or logistics required.
Specifically, the expert group selected were asked to place 33 icons, representing each of the number of health centers to be relocated, on the city map. They were asked to make this decision before the occurrence of a major earthquake – that is the scenario considered by the IDIGER (op.cit., 2011), taking into account three main variables: (1) the minimum distance between health centers and affected zones, (2) the number of injured and (3) the access to main corridors of the city. In addition to the above, the expert group was urged to include, in analyzing location, criteria other than those mentioned from previous experience and technical knowledge on the subject. All these aspects allowed for the definition of the set of decision variables β. The experts were also told the restricted areas of location on the city map. Figure 4 describes the model for the scenario analysis process applied in this study.
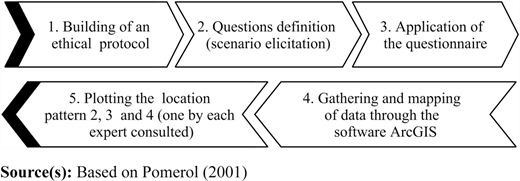
The first step consisted in providing an ethical protocol to protect the information and privacy of data collected. In the second step, the limits and specification area for relocating the 33 health centers was provided to the group of experts, and they were asked to answer 33 questions as follows: “Where do you think the best place is for the #-health center to be located on the city map?” In the third step, the questionnaire was administered on paper to the group of experts for about 60 min at different times, after which they were asked for their signed consent. Lastly, the data obtained from each expert were collected, organized and digitized in a spatial analysis software – ArcGIS v.10.8 – resulting in location patterns 2–4, as shown in Figure 5a–c, respectively.
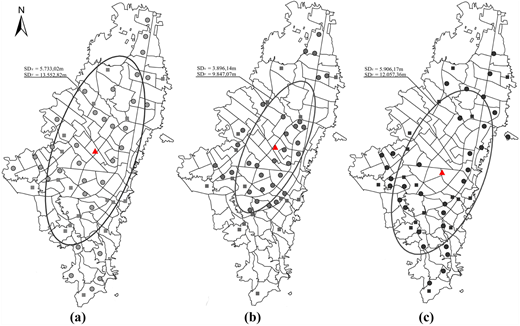
Location of health centers in the city of Bogotá using the scenario analysis approach
Location of health centers in the city of Bogotá using the scenario analysis approach
The standard distances (SDs) and center of gravity (the red triangle symbol) should be noted in each case in Figure 5a–c. The exact geographic coordinates of all these health centers in each configuration are provided in Table A3.
Geographic coordinates for health centers relocated (location patterns 2–4)
| Health center | Location pattern-2 | Location pattern-3 | Location pattern-4 | |||
|---|---|---|---|---|---|---|
| Coord. X | Coord. Y | Coord. X | Coord. Y | Coord. X | Coord. Y | |
| 1 | −74.111548 | 4.58193 | −74.122491 | 4.587579 | −74.070312 | 4.645915 |
| 2 | −74.128639 | 4.532573 | −74.154134 | 4.623603 | −74.045028 | 4.746269 |
| 3 | −74.07449 | 4.656208 | −74.070985 | 4.660284 | −74.132157 | 4.595356 |
| 4 | −74.08556 | 4.640032 | −74.049802 | 4.771935 | −74.181367 | 4.643852 |
| 5 | −74.120216 | 4.598736 | −74.073818 | 4.681064 | −74.100028 | 4.528673 |
| 6 | −74.151573 | 4.627679 | −74.092968 | 4.620228 | −74.101801 | 4.582394 |
| 7 | −74.059644 | 4.714024 | −74.10722 | 4.582483 | −74.169586 | 4.614186 |
| 8 | −74.048054 | 4.775107 | −74.132636 | 4.635069 | −74.174763 | 4.628181 |
| 9 | −74.041647 | 4.74355 | −74.102766 | 4.607606 | −74.12876 | 4.52874 |
| 10 | −74.04215 | 4.815198 | −74.044435 | 4.795367 | −74.098298 | 4.518737 |
| 11 | −74.107467 | 4.700025 | −74.082763 | 4.634738 | −74.103484 | 4.571415 |
| 12 | −74.182357 | 4.644788 | −74.11703 | 4.620242 | −74.151657 | 4.577909 |
| 13 | −74.13722 | 4.49709 | −74.147185 | 4.653837 | −74.103776 | 4.498144 |
| 14 | −74.154962 | 4.691574 | −74.070169 | 4.646567 | −74.072716 | 4.625318 |
| 15 | −74.130603 | 4.659287 | −74.063549 | 4.679954 | −74.078052 | 4.611076 |
| 16 | −74.101568 | 4.493367 | −74.044905 | 4.741654 | −74.038975 | 4.697338 |
| 17 | −74.06966 | 4.680419 | −74.034499 | 4.743933 | −74.022441 | 4.666958 |
| 18 | −74.101425 | 4.524549 | −74.089107 | 4.595274 | −74.040221 | 4.771497 |
| 19 | −74.042587 | 4.709667 | −74.098149 | 4.586671 | −74.074417 | 4.727168 |
| 20 | −74.085212 | 4.729026 | −74.127269 | 4.572255 | −74.082883 | 4.690202 |
| 21 | −74.085729 | 4.683132 | −74.089481 | 4.692699 | −74.152958 | 4.604559 |
| 22 | −74.11136 | 4.48041 | −74.111121 | 4.708978 | −74.134418 | 4.547463 |
| 23 | −74.209519 | 4.630614 | −74.068086 | 4.688642 | −74.170885 | 4.605213 |
| 24 | −74.120949 | 4.615113 | −74.131986 | 4.599325 | −74.167341 | 4.645913 |
| 25 | −74.098032 | 4.613137 | −74.165618 | 4.618091 | −74.121156 | 4.483011 |
| 26 | −74.120396 | 4.726484 | −74.175096 | 4.632209 | −74.055765 | 4.653476 |
| 27 | −74.160891 | 4.657342 | −74.100611 | 4.638073 | −74.103825 | 4.554892 |
| 28 | −74.055024 | 4.747274 | −74.146636 | 4.671937 | −74.158635 | 4.587447 |
| 29 | −74.127434 | 4.637077 | −74.115613 | 4.602241 | n.d | n.d |
| 30 | −74.044453 | 4.794777 | −74.122448 | 4.632284 | −74.134094 | 4.631967 |
| 31 | −74.175411 | 4.632115 | −74.061191 | 4.77455 | −74.099514 | 4.73388 |
| 32 | −74.096141 | 4.691605 | −74.085551 | 4.671653 | −74.052228 | 4.680198 |
| 33 | −74.166182 | 4.617491 | −74.088138 | 4.651739 | −74.053205 | 4.717182 |
Note(s): n.d.: no defined
4.3 Analytical network process (ANP)
Analytical Network Process (ANP) is the generalized form of its predecessor model, the Analytical Hierarchy Process (AHP). ANP is a robust multicriteria problem-solution methodology used to derive priorities for a decision among different alternatives based on experts' judgements – relative influence – and a normalized scale (Saaty and Vargas, 2006). ANP has been applied extensively in the literature to solve problems that cannot be structured as a linear network (Saaty, 2004). The literature also describes a high number of studies in which ANP methodology is used as a conjoint research tool (see e.g. Sipahi and Timor, 2010; Chen et al., 2019; Hülle et al., 2013). According to Saaty and Vargas (2006), the following are the steps are required to apply the ANP approach:
4.3.1 Step 1: decomposition of the problem of relocation of health centers
The first step consists of decomposing the research problem into its main components. The main components of the ANP methodology are made up of the set of decision variables γ added – that is capacity, coverage, risk, security and access to affected zone, the overall goal of the ANP analysis – the 33 health centers to be relocated – and the 5-solution scenarios considered for evaluation.
4.3.2 Step 2: selection of the criteria for the relocation of health centers
In the ANP methodology, the selection of the set of decision variables γ obeyed two main considerations. First, the expert group evaluation 1 suggested including criteria commonly used in this type of analysis, which prompted the search for similar studies on the relocation of health facilities in the event of natural disasters. The works of Gutjahr and Nolz (2015), Timperio et al. (2017) and Yilmaz and Kabak (2020) were all used as reference. The second consideration was the need to compare the current solution – location pattern-0, achieved through long-term and successive healthcare facilities planning processes – within a common framework of variables, γ, avoiding any information bias.
4.3.3 Step 3: design of the network for the relocation analysis
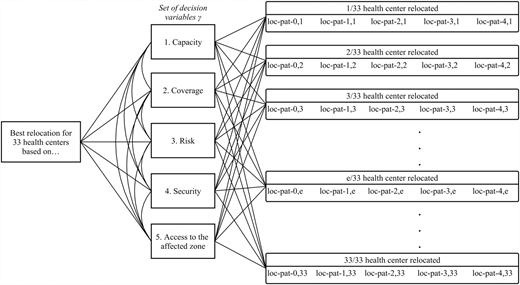
The network design consists of the evaluation of each of the 33 health centers to be relocated based on the set of decision variables γ for each one of the five location patterns considered. In the ANP model, each one of these 33 collections of elements configures a cluster, plus the set of decision variables γ, that is, 34 clusters in total. Figure 6 illustrates the lattice of the relocation network. Thus, for instance, “loc-pat-2,33” in the last row of Figure 6 denotes the location pattern-2 – from expert group evaluation 1 – for the relocation of the 33rd health center with respect to the set of decision variables γ considered.
4.3.4 Step 4: pairwise comparison, prioritization and calculation of the criteria weights
The ANP approach is applied in this analysis to jointly evaluate the five location patterns through the lens of the set of decision variables γ, as indicated in Figure 6. In this sense, the importance of choosing ANP as an integrating approach is to examine the inner/outer interaction between the indicated set of decision variables. For this, a differentiated group of three policy makers – or the expert group of evaluation 2 – was formed to carry out the comparison analysis and prioritization by pairs. The three experts did consulting work in emergency management agencies related to disaster recovery efforts in Colombia. Figure 7 describes the super-matrix of the relocation network. The resulting output of Figure 7 is a matrix of size 34 × 34, or 1,156 Wij blocks. Each block Wij is, in turn, a matrix of size 5 × 5. Each column of a block Wij in the super-matrix represents a principal eigenvector of the importance of the element i-th with respect to the element j-th being analyzed. For example, W1,34 in the first row of the super-matrix corresponds to a matrix of size 5 × 5 that indicates the importance between cluster 1 in the row – composed of the set of decision variables γ – and cluster 34 in the column – composed of the sub-set of solution scenarios m = 0 … 4 and e = 33.
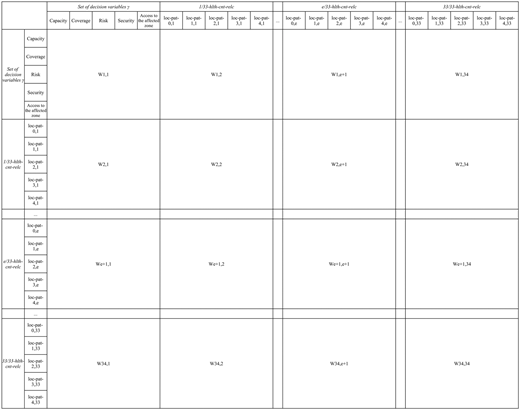
Thus, from the super-matrix of the relocation network mentioned above, only the sub-set of blocks [Wi=1, j=1 … 34] and [Wi=1 … 34, j=1] exhibit inner/outer interactions between their elements – that is they are different from zero. These blocks are the basis for the construction of the limit super-matrix of the relocation network, as described further.
4.3.5 Step 5: estimation of the limit super-matrix of the relocation network
The limit super-matrix provides the significant weights for each element i-th with respect to the element j-th analyzed. This result is achieved by multiplying the super-matrix in Table 2 by itself until it converges. As a result, the priorities for each element of the relocation network are obtained and then used to prioritize the 34-clusters identified in Step 3 of this analysis. The final step consists of selecting the location with highest evaluation in each one of the 34 clusters pointed out.
Distance from affected zones to closest health centers (in km)
| Health center | Current location | Best location pattern |
|---|---|---|
| 1 | 0.641 | 1.130 |
| 2 | 0.944 | 0.862 |
| 3 | 3.790 | 0.004 |
| 4 | 1.642 | 0.738 |
| 5 | 0.367 | 0.550 |
| 6 | 0.187 | 1.230 |
| 7 | 0.748 | 0.433 |
| 8 | 4.775 | 0.166 |
| 9 | 0.396 | 1.408 |
| 10 | 0.835 | 0.551 |
| 11 | 0.685 | 1.496 |
| 12 | 0.826 | 0.592 |
| 13 | 0.857 | 1.145 |
| 14 | 1.158 | 4.850 |
| 15 | 0.852 | 0.066 |
| 16 | 0.870 | 0.177 |
| 17 | 0.821 | 0.582 |
| 18 | 0.078 | 0.936 |
| 19 | 0.345 | 0.486 |
| 20 | 1.249 | 0.794 |
| 21 | 1.667 | 0.739 |
| 22 | 0.642 | 2.146 |
| 23 | 1.134 | 0.145 |
| 24 | 1.537 | 1.706 |
| 25 | 0.438 | 0.050 |
| 26 | 1.071 | 0.005 |
| 27 | 0.441 | 0.988 |
| 28 | 2.657 | 0.764 |
| 29 | 1.661 | 0.051 |
| 30 | 2.842 | 0.584 |
| 31 | 0.840 | 0.554 |
| 32 | 0.294 | 1.984 |
| 33 | 1.110 | 0.065 |
| Average | 1.164 | 0.848 |
4.3.6 Step 6: calculation of overall priorities for the relocation of the 33 health centers
Figure 7 depicts the solution derived from the ANP approach. In Figure 8, the shaded histograms show the best relocation for each location pattern m,e. Thus, for example, in the relocation of health center 7-of-33 (7/33 hlth-cnt-relc), the location pattern with the highest valuation corresponds to m = 2 and e = 7, with a normalized value equal to 23.12%. The full description of priorities, including limit values for each location-pattern m,e, is shown in Table A4.
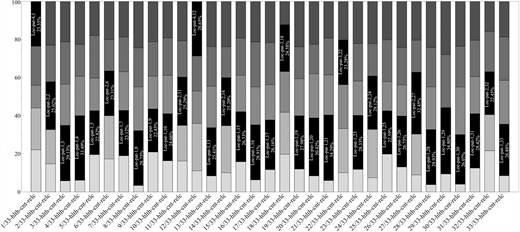
Priorities of health centers relocation
| Health center to relocate | Location pattern-m, e, m = 0 … 4 and e = 1 … 33 | Normalized by Cluster (%) |
|---|---|---|
| 1-of-33 health center to relocate | Location pattern-0,1 | 22.14 |
| Location pattern-1,1 | 21.94 | |
| Location pattern-2,1 | 11.90 | |
| Location pattern-3,1 | 20.47 | |
| Location pattern-4,1 | 23.55 | |
| 2-of-33 health center to relocate | Location pattern-0,2 | 14.79 |
| Location pattern-1,2 | 18.03 | |
| Location pattern-2,2 | 25.02 | |
| Location pattern-3,2 | 19.20 | |
| Location pattern-4,2 | 22.96 | |
| 3-of-33 health center to relocate | Location pattern-0,3 | 5.84 |
| Location pattern-1,3 | 29.13 | |
| Location pattern-2,3 | 21.63 | |
| Location pattern-3,3 | 22.19 | |
| Location pattern-4,3 | 21.21 | |
| 4-of-33 health center to relocate | Location pattern-0,4 | 6.41 |
| Location pattern-1,4 | 33.49 | |
| Location pattern-2,4 | 20.79 | |
| Location pattern-3,4 | 16.72 | |
| Location pattern-4,4 | 22.58 | |
| 5-of-33 health center to relocate | Location pattern-0,5 | 19.81 |
| Location pattern-1,5 | 22.82 | |
| Location pattern-2,5 | 17.15 | |
| Location pattern-3,5 | 22.30 | |
| Location pattern-4,5 | 17.92 | |
| 6-of-33 health center to relocate | Location pattern-0,6 | 17.31 |
| Location pattern-1,6 | 22.70 | |
| Location pattern-2,6 | 23.31 | |
| Location pattern-3,6 | 16.69 | |
| Location pattern-4,6 | 20.00 | |
| 7-of-33 health center to relocate | Location pattern-0,7 | 19.36 |
| Location pattern-1,7 | 23.12 | |
| Location pattern-2,7 | 20.61 | |
| Location pattern-3,7 | 18.22 | |
| Location pattern-4,7 | 18.68 | |
| 8-of-33 health center to relocate | Location pattern-0,8 | 3.40 |
| Location pattern-1,8 | 28.75 | |
| Location pattern-2,8 | 23.01 | |
| Location pattern-3,8 | 20.48 | |
| Location pattern-4,8 | 24.36 | |
| 9-of-33 health center to relocate | Location pattern-0,9 | 21.06 |
| Location pattern-1,9 | 22.45 | |
| Location pattern-2,9 | 17.31 | |
| Location pattern-3,9 | 18.02 | |
| Location pattern-4,9 | 21.17 | |
| 10-of-33 health center to relocate | Location pattern-0,10 | 16.35 |
| Location pattern-1,10 | 24.66 | |
| Location pattern-2,10 | 20.15 | |
| Location pattern-3,10 | 19.73 | |
| Location pattern-4,10 | 19.10 | |
| 11-of-33 health center to relocate | Location pattern-0,11 | 16.19 |
| Location pattern-1,11 | 18.75 | |
| Location pattern-2,11 | 25.29 | |
| Location pattern-3,11 | 19.08 | |
| Location pattern-4,11 | 20.69 | |
| 12-of-33 health center to relocate | Location pattern-0,12 | 11.11 |
| Location pattern-1,12 | 24.82 | |
| Location pattern-2,12 | 17.01 | |
| Location pattern-3,12 | 18.41 | |
| Location pattern-4,12 | 28.65 | |
| 13-of-33 health center to relocate | Location pattern-0,13 | 8.41 |
| Location pattern-1,13 | 25.41 | |
| Location pattern-2,13 | 21.63 | |
| Location pattern-3,13 | 20.80 | |
| Location pattern-4,13 | 23.75 | |
| 14-of-33 health center to relocate | Location pattern-0,14 | 10.09 |
| Location pattern-1,14 | 24.68 | |
| Location pattern-2,14 | 25.20 | |
| Location pattern-3,14 | 16.23 | |
| Location pattern-4,14 | 23.80 | |
| 15-of-33 health center to relocate | Location pattern-0,15 | 15.80 |
| Location pattern-1,15 | 26.33 | |
| Location pattern-2,15 | 19.10 | |
| Location pattern-3,15 | 19.45 | |
| Location pattern-4,15 | 19.33 | |
| 16-of-33 health center to relocate | Location pattern-0,16 | 6.33 |
| Location pattern-1,16 | 28.91 | |
| Location pattern-2,16 | 19.89 | |
| Location pattern-3,16 | 23.63 | |
| Location pattern-4,16 | 21.25 | |
| 17-of-33 health center to relocate | Location pattern-0,17 | 11.62 |
| Location pattern-1,17 | 26.16 | |
| Location pattern-2,17 | 18.51 | |
| Location pattern-3,17 | 22.02 | |
| Location pattern-4,17 | 21.69 | |
| 18-of-33 health center to relocate | Location pattern-0,18 | 19.74 |
| Location pattern-1,18 | 22.08 | |
| Location pattern-2,18 | 21.37 | |
| Location pattern-3,18 | 24.58 | |
| Location pattern-4,18 | 12.24 | |
| 19-of-33 health center to relocate | Location pattern-0,19 | 11.99 |
| Location pattern-1,19 | 27.98 | |
| Location pattern-2,19 | 19.45 | |
| Location pattern-3,19 | 16.74 | |
| Location pattern-4,19 | 23.84 | |
| 20-of-33 health center to relocate | Location pattern-0,20 | 8.42 |
| Location pattern-1,20 | 30.42 | |
| Location pattern-2,20 | 23.22 | |
| Location pattern-3,20 | 15.44 | |
| Location pattern-4,20 | 22.50 | |
| 21-of-33 health center to relocate | Location pattern-0,21 | 5.98 |
| Location pattern-1,21 | 34.29 | |
| Location pattern-2,21 | 21.13 | |
| Location pattern-3,21 | 19.30 | |
| Location pattern-4,21 | 19.30 | |
| 22-of-33 health center to relocate | Location pattern-0,22 | 10.11 |
| Location pattern-1,22 | 23.13 | |
| Location pattern-2,22 | 23.21 | |
| Location pattern-3,22 | 23.28 | |
| Location pattern-4,22 | 20.27 | |
| 23-of-33 health center to relocate | Location pattern-0,23 | 11.86 |
| Location pattern-1,23 | 28.33 | |
| Location pattern-2,23 | 17.98 | |
| Location pattern-3,23 | 19.71 | |
| Location pattern-4,23 | 22.12 | |
| 24-of-33 health center to relocate | Location pattern-0,24 | 7.44 |
| Location pattern-1,24 | 25.29 | |
| Location pattern-2,24 | 28.12 | |
| Location pattern-3,24 | 16.99 | |
| Location pattern-4,24 | 22.16 | |
| 25-of-33 health center to relocate | Location pattern-0,25 | 19.98 |
| Location pattern-1,25 | 22.59 | |
| Location pattern-2,25 | 15.32 | |
| Location pattern-3,25 | 21.95 | |
| Location pattern-4,25 | 20.15 | |
| 26-of-33 health center to relocate | Location pattern-0,26 | 13.10 |
| Location pattern-1,26 | 26.75 | |
| Location pattern-2,26 | 16.33 | |
| Location pattern-3,26 | 19.56 | |
| Location pattern-4,26 | 24.27 | |
| 27-of-33 health center to relocate | Location pattern-0,27 | 8.94 |
| Location pattern-1,27 | 21.44 | |
| Location pattern-2,27 | 32.45 | |
| Location pattern-3,27 | 16.82 | |
| Location pattern-4,27 | 20.35 | |
| 28-of-33 health center to relocate | Location pattern-0,28 | 3.82 |
| Location pattern-1,28 | 28.93 | |
| Location pattern-2,28 | 22.39 | |
| Location pattern-3,28 | 20.62 | |
| Location pattern-4,28 | 24.24 | |
| 29-of-33 health center to relocate | Location pattern-0,29 | 9.43 |
| Location pattern-1,29 | 34.80 | |
| Location pattern-2,29 | 27.88 | |
| Location pattern-3,29 | 27.88 | |
| 30-of-33 health center to relocate | Location pattern-0,30 | 4.05 |
| Location pattern-1,30 | 26.07 | |
| Location pattern-2,30 | 24.98 | |
| Location pattern-3,30 | 21.38 | |
| Location pattern-4,30 | 23.52 | |
| 31-of-33 health center to relocate | Location pattern-0,31 | 12.53 |
| Location pattern-1,31 | 28.42 | |
| Location pattern-2,31 | 19.56 | |
| Location pattern-3,31 | 19.11 | |
| Location pattern-4,31 | 20.38 | |
| 32-of-33 health center to relocate | Location pattern-0,32 | 21.66 |
| Location pattern-1,32 | 18.98 | |
| Location pattern-2,32 | 22.45 | |
| Location pattern-3,32 | 21.04 | |
| Location pattern-4,32 | 15.87 | |
| 33-of-33 health center to relocate | Location pattern-0,33 | 8.62 |
| Location pattern-1,33 | 26.88 | |
| Location pattern-2,33 | 23.09 | |
| Location pattern-3,33 | 22.67 | |
| Location pattern-4,33 | 18.74 |
Finally, Figure 9 illustrates the solution obtained from the application of the ANP methodology, including the standard distance (SD) for each coordinate (Xi, Yi) and the center of gravity of the configuration of health centers i. In the present analysis, this health center network configuration describes the best location for each one of the 33 health centers considered and marked with the square symbol. The exact geographic coordinates of all these health centers are provided in Annex Table A5.
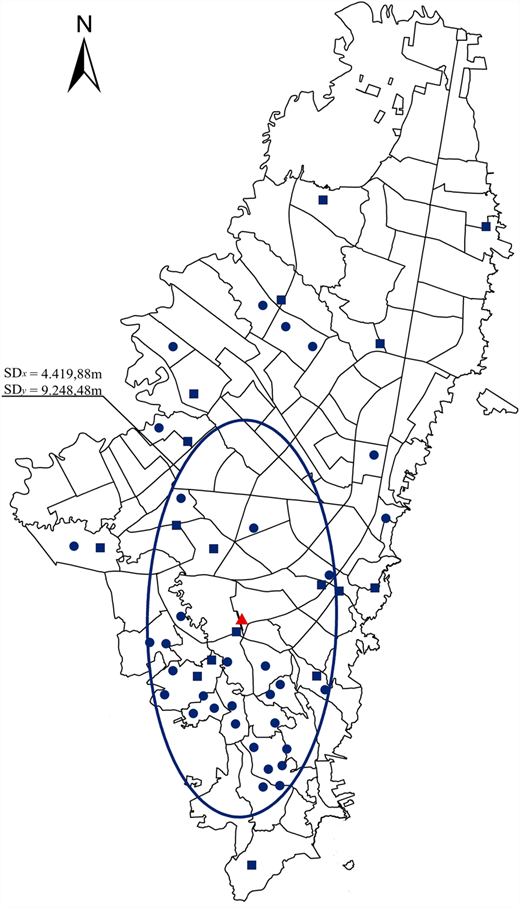
Location of health centers in the city of Bogotá by using the ANP methodology – best location pattern
Location of health centers in the city of Bogotá by using the ANP methodology – best location pattern
Geographic coordinates for health centers relocated (best location pattern)
| Health center | Coord. X | Coord. Y |
|---|---|---|
| 1 | −74.070312 | 4.645915 |
| 2 | −74.128639 | 4.532573 |
| 3 | −74.09090 | 4.54700 |
| 4 | −74.11000 | 4.50660 |
| 5 | −74.11400 | 4.54500 |
| 6 | −74.151573 | 4.627679 |
| 7 | −74.11200 | 4.53300 |
| 8 | −74.10900 | 4.51500 |
| 9 | −74.12090 | 4.52270 |
| 10 | −74.11480 | 4.51350 |
| 11 | −74.107467 | 4.700025 |
| 12 | −74.151657 | 4.577909 |
| 13 | −74.15850 | 4.54490 |
| 14 | −74.154962 | 4.691574 |
| 15 | −74.19670 | 4.60750 |
| 16 | −74.13200 | 4.55870 |
| 17 | −74.14220 | 4.54440 |
| 18 | −74.089107 | 4.595274 |
| 19 | −74.14640 | 4.53700 |
| 20 | −74.10700 | 4.52200 |
| 21 | −74.15500 | 4.55500 |
| 22 | −74.117121 | 4.708978 |
| 23 | −74.06530 | 4.61920 |
| 24 | −74.120949 | 4.615113 |
| 25 | −74.11600 | 4.55700 |
| 26 | −74.13010 | 4.54020 |
| 27 | −74.160891 | 4.657342 |
| 28 | −74.15790 | 4.56640 |
| 29 | −74.16480 | 4.56690 |
| 30 | −74.10980 | 4.54920 |
| 31 | −74.13760 | 4.53920 |
| 32 | −74.096141 | 4.691605 |
| 33 | −74.11700 | 4.50600 |
5. Discussion of results
The combination of different methodologies presented in this research to solve the problem of health centers' relocation is novel in the literature; therefore, so is the solution found. The central axis of the analysis revolved around the relocation of 33 health centers of the city's health network, which were selected for their relatively lower relocation cost. As described in the conceptual model in Figure 1, the ANP methodology is regarded as the sink node, requiring of five different inputs or location patterns: The location pattern-0 or the current configuration of the city's health network, which was achieved from successive strategic planning design in the city over the course of decades; the location pattern-1, derived from the NLP model and based on the set of decision variables α and, location patterns 2–4, all of them obtained from the expertise of a group of academics and based on the set of decision variables β.
In this analysis, each one of these solution patterns per se is considered a good result to the proposed research problem, but not the best. So, how can a better solution be found from the above alternatives? Instead of simply selecting the best alternative from the indicated five location patterns, in this research an integrating approach is applied to choose a superior solution, based on a more complete set of decision variables (γ) and a more homogeneous evaluation process. This solution was called “best location pattern.” Figure 10 shows the results of the spatial comparative analysis between the location pattern-0 – on the left – and the best location pattern – on the right. The density map in Figure 10a describes three marked clusters or hot spots, while the density map in Figure 10b has only one.
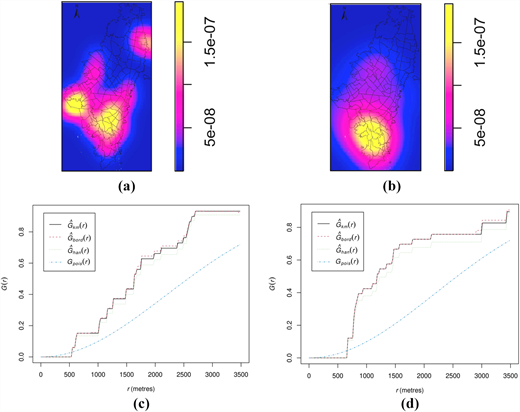
Overall, this result suggests that the current health centers' location in the city of Bogotá should be moved to the south because the highest number of injuries in the event of a major earthquake will occur there. It is well-known that this zone of the city houses the most vulnerable buildings and highest human population density. Similarly, the nearest neighbor distance functions G in Figure 10c–d reflect clustering patterns in the two configurations analyzed, since the function plot G in both cases () is above the expectation (). However, within an approximated range between 600 and 2,500 m, the compactness of the best location pattern in Figure 10d is more pronounced than the location pattern-0 in Figure 10c, confirming in this way the previous finding.
In practice, if the best location pattern found could be implemented, the distances from the affected zones to health centers would be shorter and, therefore, faster, thus increasing the responsiveness of the healthcare network of the city, as indicated in Table 2. As can be deduced from Table 2, the distance in km from the earthquake-affected zones to the current location pattern is greater on average compared to the same distance in the case of the best location pattern. Hence, following this line of thought, it is plausible to affirm that a more responsive healthcare network is inversely related to a fewer number of victims.
6. Conclusions and future research
6.1 Conclusions
This research addressed the relocation problem of the public health center network of a large city with a high population density in view of the occurrence of a major earthquake. Preliminary studies on natural disasters indicate that earthquakes are by far the most destructive and deadly natural phenomenon that can affect modern cities, which justifies this research endeavor. The combined solution approach that was applied allowed the obtaining of a location pattern that increases the response capacity of the city's healthcare network by reducing the distance to the zones affected by the earthquake. With implementation of this pattern, human suffering and deaths can be reduced.
This study maintains that the solution achieved is the “best location pattern” for the problem posed. This result, however, can only can be validated in real-risk scenarios. Despite this, due to the solution approach used is based on the input and feedback of experts in humanitarian logistics, and the distance of the solution pattern found being closer on average to the city's healthcare network, it is reasonable to assume that the “best location pattern” found is, at least, close to the optimum theoretical value. In this sense, this best location pattern for the city under consideration should not be taken by the corporate and municipal managers to be applied literally, but rather as a blanket policy to relocate the city's healthcare network in one direction: “move healthcare facilities south.” In any other cases considered, those directly in charge for emergency response planning in cities should always keep in mind that decisions derived from an analysis as performed involves long-term effects.
6.2 Future research
The present work opens four research avenues for investigation in future. First, faced with the technical impossibility of verifying in practice the location pattern with the best performance in the event of an earthquake, the application of more realistic discrete, continual or agents-based simulation models is suggested. Second, future works on the subject also should include a broader and dynamic set of information – for example more earthquakes or different population distribution scenarios, the concurrence of other types of risk – for example floods and/or landslides, or a more detailed typology of trauma – for example fracture, burn, head injury, etc. Hence, an alternative in the use of simulation-based models could be the application of robust/fuzzy programming optimization, since these solution models allow the integration and analysis of multiple scenarios at different levels. Third, likewise, in line with the combined solution approach used in this investigation, more research initiatives that use methodologies of a different nature are needed to address the complexities of the HFL-problem discussed. Fourth, another aspect to improve the scope of future research is related to the inclusion of cost criterion in the set of decision variables considered. Integrating cost criterion into the analysis can provide policy-makers with additional elements to make better decisions, especially when considering the long-term effects and the irreversibility of decisions related to the problem in question. In this sense, the inclusion of the above-mentioned criterion may be helpful to answer the question of “how the best location pattern found might be implemented.” Last but not least, other urban centers in the world that experience similar conditions to the city that is the object of this study could also benefit from the application of the general methodology of healthcare network relocation explained in this research.
Authors thank professors William Guerrero Rueda, Leonardo González Rodríguez and Diana Guzmán Cortés, all from the Universidad de la Sabana, for their comments and suggestions.
Authors are also grateful for the support of the Universidad Militar Nueva Granada.

