

The purpose of this paper is to identify key sustainability enablers that are crucial for resilient humanitarian supply chains (RHSCs) during natural calamities and pandemics. It also aims to subsequently rank them using the fuzzy analytic hierarchy process (AHP) to assess their importance. The goal is to enhance stakeholders’ understanding, enabling them to implement effective strategies to mitigate disruptions and safeguard RHSCs.
This study applied the fuzzy AHP as part of the multicriteria decision-making (MCDM) framework to prioritize sustainability enablers that are crucial for the resilience of humanitarian supply chains (RHSCs).
The research findings indicate that the operational enablers category is the most critical, followed by the infrastructural and environmental categories, which rank as the second and third most critical, respectively. Among the sub-categories, “Hyper-connectivity,” “Renewable energy sources for infrastructure” and “Sustainable procurement and sourcing practices” are identified as the top three, highlighting the urgency for immediate attention.
While this research provides valuable insights, it also presents some limitations and opens new avenues for future study. First, the study predominantly focuses on natural calamities and pandemics, potentially overlooking other catastrophic events that could jeopardize humanitarian supply chains. Second, to eliminate potential biases and develop a more robust model, it would have been beneficial to explore other modern MCDM methods. It is possible that these alternative MCDM techniques might yield better results than fuzzy AHP. Future research could explore a broader range of crises to comprehensively address the varied dynamics influencing Resilient Humanitarian Supply Chains (RHSCs) while also experimenting with different cutting-edge MCDM methods. Additionally, future research could dive deeper into the top-ranked technology enablers, particularly focusing on human-technology interactions within humanitarian supply chains, a topic that is currently being discussed among experts.
The manuscript emphasizes the importance of global preparedness and collaborative efforts among governments, nongovernmental organizations and communities. Through its discussion of social enablers, this study aims to develop RHSCs that prioritize the well-being of disaster-affected populations and individuals used in this field.
This research offers unique insights by ranking sustainability enablers for resilient humanitarian supply chains (RHSCs) amid natural calamities and pandemics, providing novel and actionable contributions.
1. Introduction
The resilient humanitarian supply chain (RHSCs) is a robust and adaptable network that effectively responds to and recovers from disastrous events, with sustainability being crucial for its long-term operational viability, minimal environmental impact and promotion of social equity. Sustainable practices in RHSCs contribute to resource efficiency, reduce waste and foster resilience against future challenges. Integrating sustainability into RHSCs not only strengthens immediate disaster response but also builds a foundation for continuous improvement and resilience in the face of evolving global challenges. In reality, RHSCs encounter sustainability-related challenges during natural disasters and pandemics (Ivanov, 2022). These sustainability-related issues greatly disrupt the efficient functioning of RHSCs (Sodhi and Tang, 2021; Malmir and Zobel, 2021), resulting in delayed responses, needless resource consumption, excessive carbon emissions and waste generation. Furthermore, sustainability challenges during natural calamities and pandemics can disrupt relief operations, exacerbate environmental impacts and deepen social and economic vulnerabilities among affected populations, as underscored in a report by McKinsey and Company (2020). It has been observed that, apart from the complications mentioned above, unethical practices and maltreatment of affected populations further intensify the sustainability issues encountered by RHSCs (Shrivastav and Bag, 2023; Haavisto and Kovács, 2014). The Russia-Ukraine conflict exemplifies significant sustainability challenges faced by supply chains, as highlighted by a KPMG (2022) report published in 2022 and a report from the Massachusetts Institute of Technology Center for Transportation and Logistics (2023). Similarly, the global COVID-19 pandemic significantly tested the resilience and sustainability of humanitarian supply chains (HSCs) (Dohale et al., 2024; Sharma et al., 2023). Years of extensive efforts and innovations have improved the resilience of HSCs; however, the path to ensuring sustainability remains uncertain and unresolved (Cao et al., 2021).
As time advances, the likelihood of natural calamities and pandemics increases due to factors such as the impact of population explosion, and the exploitation of natural resources, emergence of unknown and incurable diseases and other factors. This indicates the need for strengthening the sustainability of RHSCs, especially given the profound lessons learned from the abovementioned disruptive events. Managing and controlling the outcomes of unpredictable natural calamities and pandemics depends on how effectively we have strengthened the sustainability of RHSCs to ensure their resilience during these disastrous events. Unfortunately, there is a complete absence of literature addressing the sustainability of resilient HSCs in the specific context of natural calamities and pandemics (Kunz and Gold, 2017; Anjomshoae et al., 2022). In fact, Nawazish et al. (2023) highlight the absence of academic literature on sustainable humanitarian supply chain management (HSCM), pointing to a significant and timely gap that needs to be addressed. The research gap emerges from in-depth consultations with industry experts and a comprehensive analysis of existing literature, uncovering a deficiency in the existing literature. The discussion in this section, along with the literature review in Sub-section 2.0, has helped in the identification of research gaps. Consequently, the research questions and objectives have been formulated in Sub-section 2.3. Additionally, the rationale for conducting this research is highlighted in the literature review section. The manuscript is organized as follows: Section 2 reviews relevant literature to identify the research gap, which leads to the establishment of research questions and objectives. Section 3 details the research methodology, while Section 4 presents the sensitivity analysis of the results. Section 5 offers a brief discussion of the findings. Sections 6, 7 and 8 address the implications and contributions of the research, the conclusion and the study’s limitations, in that order.
2. Literature review
This section focuses on two key themes, which will be extensively explored in the following discussion. Additionally, a subsection will address research gaps, research questions and objectives. These identified themes were also used as search keywords while searching within diverse databases.
2.1 Sustainability of resilient humanitarian supply chains
The purpose of this section is to critically evaluate relevant literature, identify gaps and highlight how this research can fill those gaps. In their study, Singh et al. (2018) used interpretive structural modeling in conjunction with fuzzy Matrice d’Impacts Croisés Multiplication Appliquée à un Classement (Cross‐Impact Matrix Multiplication Applied to Classification) analysis to elucidate the structural interconnections existing among a dozen distinct elements pivotal to fortifying the HSC’s resilience. This study inspired the current research to conduct an in-depth exploration of supply chain resilience and the applicability of multicriteria decision-making (MCDM) techniques in this domain. A study by Papadopoulos et al. (2017) examined how big data contributes to the comprehension of disaster resilience within supply chains, particularly in the context of sustainability. Although this study extensively discusses sustainability in the context of resilient supply chains, it lacks a comprehensive approach to achieving it. An attempt by Stewart and Ivanov (2022) suggested a framework for incorporating design redundancy as a strategic measure to mitigate the inherent risks associated with HSCs, particularly those functioning within conflict zones. Nevertheless, this research was limited to regions of conflict, with no reference to enablers contributing to sustainability. This study analyzes various alternative supply chain designs for humanitarian operations. The design that exposes decision-makers to fewer risks compared to others is recommended. However, while the study addresses HSC risks, it does not effectively tackle their reduction. Kaur and Singh (2022) proposed advanced models for disaster-resilient proactive and reactive procurement within the context of HSCs. While the model is effectively solved for moderately sized problems, computational complexity increases with the number of decision variables in larger instances. Similarly, Ivanov and Dolgui (2020) assessed the capacity of the supply chain to withstand and adapt during the global spread of the COVID-19 pandemic to ensure continued viability.
This analysis offers limited usefulness for recovery efforts, as it is confined to the predisruption stage and applicable only to very generalized scenarios. Progressing further, Matin et al. (2022) examined the sustainability and resilience of blood supply chains with the intention of enhancing the health-care system. A major limitation is the neglect of stochastic data in the model, which raises questions about the outcomes given its likely presence in real-world scenarios. Similarly, Bechtsis et al. (2022) and Behl and Dutta (2019) attempted to address the sustainability of resilient supply chains. These studies have two major drawbacks: they overly rely on data to develop risk management paradigms and fail to effectively address sustainability, thereby leaving a significant research gap. Furthermore, Dubey et al. (2020) discussed concisely the ways in which blockchain technology enhances trust, fosters collaboration, and strengthens resilience within HSCs. The authors acknowledge insufficient data collection during this research; thus, its outcomes should be considered with this limitation in mind. A study conducted by Bag et al. (2020) emphasizes the critical role of key enablers in promoting green practices within HSCs. This research serves as both an impetus and a strong foundation for the present study. This study is partly inspired by Shaikh (2023), who examines the enablers of postpandemic supply chain resilience in an emerging economy. Additional studies examined to complete this work include Nawazish et al. (2023) and Iakovou et al. (2014). In addition to the literature discussed above, several other studies, including Perdana et al. (2022), Queiroz et al. (2022) and Abdul Rahman et al. (2022), were reviewed in this context. Accordingly, we systematically examined high-quality studies relevant to the topic. The field of resilient HSCs is a specialized area, particularly when focused on natural calamities and pandemics. This section highlights a significant gap due to the lack of studies investigating sustainability enablers for resilient HSCs. Consequently, this identified gap is pursued as a primary focus of this manuscript.
2.2 Sustainability enablers in resilient humanitarian supply chains and in global supply chains context
In the course of this research, “sustainability enablers” stands out as a pivotal keyword. Consequently, a comprehensive examination of literature pertaining to this keyword becomes necessary. This study aims to assess the extent of existing research efforts and identify gaps that warrant further investigation. First and foremost, a recent study by Nawazish et al. (2023) highlights the lack of quality academic literature on sustainable HSCM, underscoring the significance and timeliness of the current manuscript as it seeks to address this gap. Akbari and Hopkins (2022) and Cherrafi et al. (2022) focused solely on digital technologies as key enablers for supply chain sustainability. However, several other, more impactful factors beyond digital technologies contribute to achieving sustainability. This study aims to highlight these broader and more critical factors. Similarly, Agarwal et al. (2020) developed a model for supply chain enablers to achieve resilience, while Sharma et al. (2023) examined grade rank analysis system enablers within the context of fresh food supply chains. Likewise, Naz et al. (2022) considered artificial intelligence (AI) as an enabler for supply chain resilience post-COVID-19. Another study by Agarwal et al. (2022) examined restorative measures to mitigate the effects of the COVID-19 pandemic through circular economy enablers. Finally, Anjomshoae et al. (2023) conducted a systematic literature review and proposed research directions related to sustainable HSCs. In addition to the studies reviewed in this section, a few others exist, such as those by Koberg and Longoni (2019), Kannegiesser and Günther (2014) and Brandao and Godinho-Filho (2022). However, none of these have assessed sustainability enablers for resilient HSCs in the context of natural calamities and pandemics. This notable research gap is the focus of the current manuscript.
2.3 Research gap, research questions and research objectives
Based on an extensive review of the literature on sustainability enablers and resilient humanitarian supply chains (RHSCs), it is evident that while research on HSCs has surged recently, the focus on the sustainability of RHSCs remains in its early stages. Numerous studies highlight the risks and vulnerabilities within HSCs. In response, several theoretical frameworks have been proposed to enhance the sustainability of HSCs. However, comprehensive work exploring sustainability enablers in the context of RHSCs is lacking. A recent study by Nawazish et al. (2023) concludes that there is insufficient high-quality academic literature on sustainable HSCM. Additionally, it has been observed that most existing studies are qualitative, with limited efforts dedicated to developing analytical models specifically for RHSCs in the context of natural disasters and pandemics. While theoretical and quantitative models have been proposed, there is a scarcity of studies evaluating their effectiveness during actual natural disasters and pandemics. In light of these research gaps, the following research questions will guide this study:
What are the key sustainability enablers in resilient humanitarian supply chains (RHSCs)?
How do sustainability enablers interrelate and impact the resilience of humanitarian supply chains (RHSCs) amid natural disasters and pandemics?
How will stakeholders benefit from this study?
To answer the above research questions, the following research objectives have been established. The categories and subcategories of sustainability enablers are comprehensively presented in Table 1:
Categories and sub-categories of sustainability enablers
| Sr. no. | Major categories of enablers | Code | Sub-categories of enablers | Source |
|---|---|---|---|---|
| 1 | Infrastructural enablers (IFEs) | IFE1 | Resilient transportation networks | Kunz and Reiner (2012); Kunz and Gold (2017); Delphi method |
| IFE2 | Green logistics hubs and distribution centers | |||
| IFE3 | Renewable energy sources for infrastructure | |||
| IFE4 | Waste disposal facilities | |||
| IFE5 | Water and sanitation facilities | |||
| IFE6 | Smart technology and communication systems | |||
| IFE7 | Resilient health-care infrastructure facilities | |||
| IFE8 | Emergency infrastructure for quick response to crises | |||
| 2 | Environmental enablers (ENEs) | ENE1 | Carbon footprint reduction initiatives | Bag et al. (2020); Delhi method |
| ENE2 | Sustainable resource management (water and energy) | |||
| ENE3 | Resource conservation | |||
| ENE4 | Biodiversity conservation measures | |||
| ENE5 | Adoption of eco-friendly materials and products | |||
| ENE6 | Pollution prevention and waste reduction | |||
| ENE7 | Environmental impact assessments | |||
| ENE8 | Circular economy adoption | |||
| ENE9 | Building resilience to climate change | |||
| 3 | Operational enablers (OPEs) | OPE1 | Process optimization | Delhi method |
| OPE2 | Hyper-connectivity | |||
| OPE3 | Technology integration and strategic collaborations | |||
| OPE4 | Resilient inventory management | |||
| OPE5 | Sustainable procurement and sourcing practices | |||
| OPE6 | Risk management and contingency planning | |||
| OPE7 | Resilient supply chain network design | |||
| OPE8 | Reverse logistics and recycling programs | |||
| 4 | Social enablers (SOEs) | SOE1 | Ethical labor practices and fair working conditions | Bag et al. (2020); Kunz and Reiner (2012); Delphi method |
| SOE2 | Health and safety standards for workers | |||
| SOE3 | Gender equality and diversity policies | |||
| SOE4 | Community engagement and development programs | |||
| SOE5 | Respect for human rights throughout the humanitarian supply chains | |||
| SOE6 | Local sourcing and support for small businesses | |||
| SOE7 | Collaboration with local authorities and NGOs | |||
| SOE8 | Control fake news and notifications among society during crises | |||
| SOE9 | Cultural sensitivity |
To identify the key sustainability enablers in resilient humanitarian supply chains (RHSCs).
To evaluate the key sustainability enablers in RHSCs by using the fuzzy AHP method.
To propose the top-ranked sustainability enablers and discuss their impact on RHSCs.
To propose implications and contribution of this study to the related stakeholders.
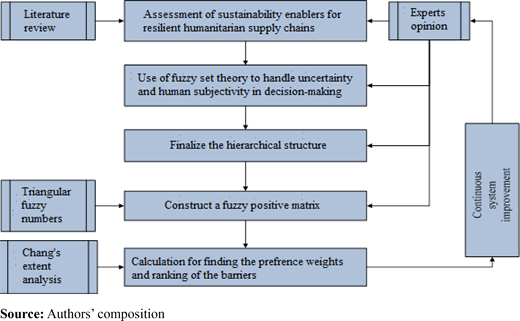
3. Research methodology
This research introduces a fuzzy analytic hierarchy process (AHP) methodology for evaluating and prioritizing the enablers that facilitate sustainability in building resilient HSCs. The proposed research framework is depicted in Figure 1. Initially, a decision group undertook the task of investigating, identifying and determining the sustainability enablers for robust HSCs. Subsequently, the fuzzy integrated AHP approach is used to evaluate all the identified criteria and subcriteria. The enablers were identified through an exhaustive literature review and feedback from the expert decision group. The panel comprises individuals with expertise in the subject matter. Table 2 provides the specifics regarding the involved experts. The decision-making group identified 34 enablers categorized into four groups. Alongside in-person interviews with selected decision-makers, researchers organized several well-attended online and offline sessions with these experts. The decision-making team’s input was eventually consolidated through a series of extensive e-mails and phone conversations. The responses received were subsequently refined. Following a meticulous assessment and a few adjustments, a consensus was reached among the researchers. The relative importance of the impediments was then ascertained using the fuzzy analytic hierarchy process (FAHP) approach. The ease of use and ability to deliver more reliable and consistent results are the primary reasons for using this decision framework. By transforming a crisp scale into a fuzzy scale, decision-makers’ opinions are evaluated in a fuzzy environment. The decision-makers’ centroid is highlighted by the triangular fuzzy numbers (TFN) used, which demonstrate an even distribution of their interval values. Moreover, the involvement of the decision-makers directly enhances the rationality and consistency of choice information. Researchers and practitioners are, therefore, encouraged to apply this decision system, given the value proposition of this integrated methodology in solving research challenges, improving management transparency and reducing complexity. Below is a detailed discussion of the steps involved in this procedure.
Profile of the respondents
| Sr. no. | Affiliation of interviewed individuals | Number of individuals | Average work experience (in years) | Gender | Ethnicity of the respondents | |
|---|---|---|---|---|---|---|
| Male | Female | |||||
| 1 | Humanitarian aid suppliers | 5 | 15.5 | 4 | 1 | New Zealand = 2 Japan = 1 India = 1 and Indonesia = 1 |
| 2 | Nongovernmental organizations (NGOs) | 4 | 15 | 2 | 2 | Bangladesh = 2 India = 1 and Indonesia = 1 |
| 3 | Disaster response groups/forces | 4 | 15.5 | 3 | 1 | New Zealand = 1 Japan = 1 India = 1 and Indonesia = 1 |
| 4 | Government agencies | 4 | 17.5 | 2 | 2 | India = 1 USA = 1 Indonesia = 1 and New Zealand = 1 |
| 5 | Logistics strategists in disaster and natural calamities | 4 | 13 | 3 | 1 | USA = 2 Switzerland = 1 and France = 1 |
| 6 | Humanitarian logistics and supply chain organizations | 3 | 16 | 2 | 1 | Japan = 2 and Indonesia = 1 |
| 7 | Academic and research institutions | 3 | 12.5 | 2 | 1 | USA = 2 and China = 1 |
| 8 | Health-care logistics experts | 3 | 18 | 2 | 1 | USA = 3 |
| Total respondents = 30 | Average work experience of all the respondents = 15.37 years | Total males = 20 | Total females = 10 | |||
3.1 Delphi survey
To comprehensively explore the research problem, a systematic literature investigation alone is insufficient. Therefore, it was deemed necessary to involve industry experts through focused group discussions. A total of 100 mid-level and senior-level industry experts were approached for consultation; however, only 30 provided valuable feedback. The respondents’ areas of expertise are delineated in Table 2. Furthermore, they possess substantial experience in the specified work profiles. Initial contact was made via e-mail, followed by subsequent communication through rounds of video conferences and phone calls. A questionnaire was distributed among these 30 respondents to collect pertinent data; however, they requested that their anonymity be maintained. The table below presents the background information of the interviewed experts, all of whom possess diverse expertise related to HSCs. It is worth noting that these experts operate in countries frequently affected by disasters concerning HSCs.
3.2 Phase II FAHP method
The AHP method, which bases its evaluation on linear programming, concurrently evaluates quantitative and qualitative factors numerically. For this reason, it is referred to as a multicriteria decision-making process. The advantages of using AHP over other MCDM approaches [Best-worst method, multi-attribute utility theory, VlseKriterijumska Optimizacija I Kompromisno Resenje (Multi-criteria optimization and compromise solution), preference ranking organization method for enrichment evaluation, (PROMETHEE) decision-making trial and evaluation laboratory, etc.] can be comprehended from this: it is easy to apply, has a smaller number of pair-wise comparisons and provides the relative importance of the considered criteria in the decision-making process for decision-makers. Some methods may primarily rely on quantitative data, and representing qualitative aspects may require additional transformations or considerations. It establishes a linear relationship and demonstrates the performance of the decision variables through structural dependency compared to analytic network process. But using AHP in a crisp environment has few drawbacks owing to its subjective nature and unstable measurement scale. These issues can be overcome by using the fuzzy concept. Some methods, like PROMETHEE or technique for order preference by similarity to ideal solution, may not inherently handle fuzzy or uncertain information as effectively. They often rely on crisp numerical data, which might not capture the full spectrum of uncertainty. Therefore, the fuzzy-based AHP method is more precise, rational and consistent, which enhances its application and encourages researchers and analysts to use it in various domains. Moreover, fuzzy AHP is well-suited for modeling complex systems with multiple criteria and alternatives, considering interactions and dependencies among criteria. This method also provides significant transparency in the decision-making process, and some other methods might not offer as clear insights into the decision rationale. In practice, triangular fuzzy numbers (TFNs) are frequently used, as illustrated in Table 2.
The FAHP process is carried out using Chang’s extent analysis. This method uses the following TFNs to calculate the values of the extent method for each criterion, and the processes of Chang’s analysis are illustrated below.
Step 1: The fuzzy synthetic extent value is calculated for each condition.
Steps 2 and 3: The degree of probability must be weighed against all other criteria to calculate the respective criterion weights:
Step 4: A normalizing approach is used to acquire the parameters’ normalized weights:
3.3 Obtain the weightage score
The decision team has assigned ratings to compare four groups of enablers and 34 subgroups by allocating fuzzy scores, as presented in Table 3, which is specified in Table 2. The FAHP approach discussed above has been applied to calculate the weight scores of each barrier (please refer to Table 3). Similarly, the weights of the subgroups have been obtained for specific categories of the enablers, as highlighted in Tables 4–8.
Evaluation scale
| Linguistics representation | Dispensed TFN |
|---|---|
| EI-Equally important | (1, 1, 1) |
| VL-Very low important | (1, 2, 3) |
| LI-Low important | (2, 3, 4) |
| AI-Average important | (3, 4, 5) |
| HI-Higher important | (4, 5, 6) |
| VHI-Very high important | (5, 6, 7) |
| ABI-Absolutely important | (7, 8, 9) |
Comparison matrix and weightage score of the barriers
| IFE | ENE | OPE | SOE | Weightage score | Rank | |
|---|---|---|---|---|---|---|
| IFE | (1, 1, 1) | (2, 3, 4) | (0.2, 0.25, 0.33) | (1, 2, 3) | 0.25350 | 2 |
| ENE | (0.25, 0.33, 0.5) | (1, 1, 1) | (3, 4, 5) | (0.2, 0.25, 0.33) | 0.21839 | 4 |
| OPE | (3, 4, 5) | (0.2, 0.25, 0.33) | (1, 1, 1) | (2, 3, 4) | 0.28865 | 1 |
| SOE | (0.33, 0.5, 1) | (3, 4, 5) | (0.25, 0.33, 0.5) | (1, 1, 1) | 0.23945 | 3 |
Weightage score and ranking of the IFEs category
| IFEs | Weightage score | Priority list |
|---|---|---|
| IFE1 | 0.15448 | 2 |
| IFE2 | 0.09028 | 8 |
| IFE3 | 0.16628 | 1 |
| IFE4 | 0.10641 | 6 |
| IFE5 | 0.09974 | 7 |
| IFE6 | 0.11821 | 5 |
| IFE7 | 0.14149 | 3 |
| IFE8 | 0.12312 | 4 |
Weightage score and ranking of the ENEs category
| ENEs | Weightage score | Priority list |
|---|---|---|
| ENE1 | 0.14817 | 1 |
| ENE2 | 0.07447 | 9 |
| ENE3 | 0.13365 | 2 |
| ENE4 | 0.08701 | 8 |
| ENE5 | 0.11545 | 5 |
| ENE6 | 0.12274 | 3 |
| ENE7 | 0.09115 | 7 |
| ENE7 | 0.12177 | 4 |
| ENE8 | 0.10560 | 6 |
| ENE9 | 0.14817 | 1 |
Weightage score and ranking of the OPE category
| OPEs | Weightage score | Priority list |
|---|---|---|
| OPE1 | 0.08643 | 8 |
| OPE2 | 0.16318 | 1 |
| OPE3 | 0.09955 | 7 |
| OPE4 | 0.12438 | 5 |
| OPE5 | 0.14138 | 2 |
| OPE6 | 0.11439 | 6 |
| OPE7 | 0.13979 | 3 |
| OPE8 | 0.13089 | 4 |
Weightage score and ranking of the SOE category
| SOEs | Weightage score | Priority list |
|---|---|---|
| SOE1 | 0.09005 | 9 |
| SOE2 | 0.12918 | 2 |
| SOE3 | 0.09602 | 7 |
| SOE4 | 0.09492 | 8 |
| SOE5 | 0.10879 | 5 |
| SOE6 | 0.10261 | 6 |
| SOE7 | 0.11593 | 3 |
| SOE8 | 0.11530 | 4 |
| SOE9 | 0.14720 | 1 |
After calculating the weights of the category enablers, the global weights of the specific enablers are obtained by multiplying the category weights by the specific subcategory weights. The final ranking is then derived based on the highest weights received by the enablers. The weights and resulting rankings are highlighted in Table 9.
Overall priority order
| Category | Score | Rank | Sub-category | Score | Ranking | Global score | Global rank |
|---|---|---|---|---|---|---|---|
| IFE | 0.25350 | 2 | IFE1 | 0.1545 | 2 | 0.0392 | 5 |
| IFE2 | 0.0903 | 8 | 0.0229 | 29 | |||
| IFE3 | 0.1663 | 1 | 0.0422 | 2 | |||
| IFE4 | 0.1064 | 6 | 0.0270 | 19 | |||
| IFE5 | 0.0997 | 7 | 0.0253 | 23 | |||
| IFE6 | 0.1182 | 5 | 0.0300 | 14 | |||
| IFE7 | 0.1415 | 3 | 0.0359 | 8 | |||
| IFE8 | 0.1231 | 4 | 0.0312 | 12 | |||
| ENE | 0.21839 | 3 | ENE1 | 0.1482 | 1 | 0.0324 | 11 |
| ENE2 | 0.0745 | 9 | 0.0163 | 34 | |||
| ENE3 | 0.1337 | 2 | 0.0292 | 15 | |||
| ENE4 | 0.0870 | 8 | 0.0190 | 33 | |||
| ENE5 | 0.1154 | 5 | 0.0252 | 24 | |||
| ENE6 | 0.1227 | 3 | 0.0268 | 20 | |||
| ENE7 | 0.0912 | 7 | 0.0199 | 32 | |||
| ENE8 | 0.1218 | 4 | 0.0266 | 21 | |||
| ENE9 | 0.1056 | 6 | 0.0231 | 27 | |||
| OPE | 0.28865 | 1 | OPE1 | 0.0864 | 8 | 0.0249 | 25 |
| OPE2 | 0.1632 | 1 | 0.0471 | 1 | |||
| OPE3 | 0.0995 | 7 | 0.0287 | 16 | |||
| OPE4 | 0.1244 | 5 | 0.0359 | 7 | |||
| OPE5 | 0.1414 | 2 | 0.0408 | 3 | |||
| OPE6 | 0.1144 | 6 | 0.0330 | 10 | |||
| OPE7 | 0.1398 | 3 | 0.0404 | 4 | |||
| OPE8 | 0.1309 | 4 | 0.0378 | 6 | |||
| SOE | 0.23945 | 4 | SOE1 | 0.0901 | 9 | 0.0216 | 31 |
| SOE2 | 0.1292 | 2 | 0.0309 | 13 | |||
| SOE3 | 0.0960 | 7 | 0.0230 | 28 | |||
| SOE4 | 0.0949 | 8 | 0.0227 | 30 | |||
| SOE5 | 0.1088 | 5 | 0.0260 | 22 | |||
| SOE6 | 0.1026 | 6 | 0.0246 | 26 | |||
| SOE7 | 0.1159 | 3 | 0.0278 | 17 | |||
| SOE8 | 0.1153 | 4 | 0.0276 | 18 | |||
| SOE9 | 0.1472 | 1 | 0.0352 | 9 |
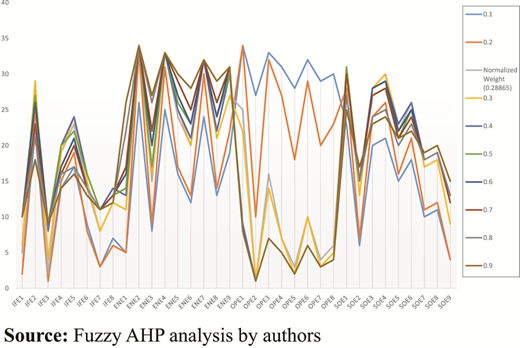
4. Sensitivity analysis
Sensitivity analysis is conducted in the fuzzy AHP problem-solving to examine how altering input data or criteria weights (especially of the top-ranked alternative) affects the final decision or ranking of the other alternatives (refer Figure 2). It helps determine the stability of the results by showing how sensitive the outcomes are to variations in assumptions or judgments. This analysis highlights which factors exert the most influence on the decision, offering insights into the reliability of the conclusions. Additionally, it identifies areas where greater accuracy is needed, ensuring that the decision-making process remains resilient to uncertainties. Ultimately, sensitivity analysis enhances confidence in the results generated by the fuzzy AHP model. The sensitivity analysis executed in this manuscript demonstrates that the operational enablers (OPEs) rank first with the highest weight value among all enablers. Thus, the OPE has the potential to influence other enablers (Garg et al., 2023; Kashav et al., 2022). As a result, it is desirable to change the weights of all enablers to assess the priority rating (Rawat and Garg, 2021; Dogan, 2021; Buran and Erçek, 2022), as seen in Table 10. Despite the OPEs value being adjusted from 0.1 to 0.9, the OPE2 enabler remains in the top spot, while environmental enablers (ENE2) retains the last place (refer Tables 10 and 11). In fact, most of the subcategories remain in their current positions regarding ranking. From the sensitivity analysis (refer Figure 2), the following inferences can be drawn. The consistent ranking of subcategories, despite significant changes in the OPE’s value, indicates that the results are robust. This suggests that the influence of the OPE is stable across different scenarios:
Enablers’ weighted score when the varies
| Barriers | The weightage score of the enablers | ||||||||
|---|---|---|---|---|---|---|---|---|---|
| IFE | 0.3164 | 0.2831 | 0.2497 | 0.2164 | 0.1831 | 0.1497 | 0.1164 | 0.0831 | 0.0497 |
| ENE | 0.2813 | 0.2479 | 0.2146 | 0.1813 | 0.1479 | 0.1146 | 0.0813 | 0.0479 | 0.0146 |
| OPE | 0.1 | 0.2 | 0.3 | 0.4 | 0.5 | 0.6 | 0.7 | 0.8 | 0.9 |
| SOE | 0.3023 | 0.2690 | 0.2357 | 0.2023 | 0.1690 | 0.1357 | 0.1023 | 0.0690 | 0.0357 |
| Total | 1 | 1 | 1 | 1 | 1 | 1 | 1 | 1 | 1 |
Final ranking of the enablers
| Enablers | Final ranking when the varies | |||||||||
|---|---|---|---|---|---|---|---|---|---|---|
| 0.1 | 0.2 | Normalized (0.28865) | 0.3 | 0.4 | 0.5 | 0.6 | 0.7 | 0.8 | 0.9 | |
| IFE1 | 2 | 2 | 5 | 6 | 10 | 10 | 10 | 10 | 10 | 10 |
| IFE2 | 22 | 25 | 29 | 29 | 27 | 27 | 26 | 23 | 21 | 18 |
| IFE3 | 1 | 1 | 2 | 4 | 8 | 9 | 9 | 9 | 9 | 9 |
| IFE4 | 14 | 15 | 19 | 19 | 20 | 20 | 17 | 16 | 16 | 14 |
| IFE5 | 17 | 19 | 23 | 24 | 24 | 22 | 21 | 20 | 17 | 16 |
| IFE6 | 9 | 8 | 14 | 15 | 16 | 16 | 14 | 14 | 14 | 13 |
| IFE7 | 3 | 3 | 8 | 8 | 11 | 11 | 11 | 11 | 11 | 11 |
| IFE8 | 7 | 6 | 12 | 12 | 14 | 13 | 13 | 13 | 12 | 12 |
| ENE1 | 5 | 5 | 11 | 11 | 13 | 14 | 16 | 17 | 22 | 26 |
| ENE2 | 26 | 33 | 34 | 34 | 34 | 34 | 34 | 34 | 34 | 34 |
| ENE3 | 8 | 9 | 15 | 16 | 17 | 17 | 20 | 22 | 26 | 27 |
| ENE4 | 25 | 31 | 33 | 33 | 33 | 33 | 33 | 33 | 33 | 33 |
| ENE5 | 16 | 17 | 24 | 25 | 25 | 26 | 27 | 29 | 30 | 30 |
| ENE6 | 12 | 13 | 20 | 20 | 21 | 23 | 23 | 25 | 28 | 28 |
| ENE7 | 24 | 30 | 32 | 32 | 32 | 32 | 32 | 32 | 32 | 32 |
| ENE8 | 13 | 14 | 21 | 21 | 22 | 24 | 24 | 26 | 29 | 29 |
| ENE9 | 19 | 22 | 27 | 27 | 30 | 30 | 31 | 31 | 31 | 31 |
| OPE1 | 34 | 34 | 25 | 22 | 9 | 8 | 8 | 8 | 8 | 8 |
| OPE2 | 27 | 10 | 1 | 1 | 1 | 1 | 1 | 1 | 1 | 1 |
| OPE3 | 33 | 32 | 16 | 14 | 7 | 7 | 7 | 7 | 7 | 7 |
| OPE4 | 31 | 27 | 7 | 7 | 5 | 5 | 5 | 5 | 5 | 5 |
| OPE5 | 28 | 18 | 3 | 2 | 2 | 2 | 2 | 2 | 2 | 2 |
| OPE6 | 32 | 29 | 10 | 10 | 6 | 6 | 6 | 6 | 6 | 6 |
| OPE7 | 29 | 20 | 4 | 3 | 3 | 3 | 3 | 3 | 3 | 3 |
| OPE8 | 30 | 23 | 6 | 5 | 4 | 4 | 4 | 4 | 4 | 4 |
| SOE1 | 23 | 28 | 31 | 31 | 31 | 31 | 30 | 30 | 27 | 25 |
| SOE2 | 6 | 7 | 13 | 13 | 15 | 15 | 15 | 15 | 15 | 17 |
| SOE3 | 20 | 24 | 28 | 28 | 28 | 28 | 28 | 27 | 24 | 23 |
| SOE4 | 21 | 26 | 30 | 30 | 29 | 29 | 29 | 28 | 25 | 24 |
| SOE5 | 15 | 16 | 22 | 23 | 23 | 21 | 22 | 21 | 20 | 21 |
| SOE6 | 18 | 21 | 26 | 26 | 26 | 25 | 25 | 24 | 23 | 22 |
| SOE7 | 10 | 11 | 17 | 17 | 18 | 18 | 18 | 18 | 18 | 19 |
| SOE8 | 11 | 12 | 18 | 18 | 19 | 19 | 19 | 19 | 19 | 20 |
| SOE9 | 4 | 4 | 9 | 9 | 12 | 12 | 12 | 12 | 13 | 15 |
The OPE is likely to have a strong and consistent impact on the overall decision-making process. Even when its value changes within a wide range, it remains the dominant factor, reinforcing its critical importance.
The model shows resilience, implying that the ranking of subcategories is not easily affected by fluctuations in the OPE’s weight. This suggests that the overall decision framework is reliable and less sensitive to variations in this specific factor.
The fact that the rankings remain unchanged indicates that the system may have limited sensitivity to changes in the OPE’s value, implying that other criteria or factors in the model may have less influence on altering the overall rankings.
Such consistency enhances confidence in the decision-making process, as the analysis indicates that decisions based on the AHP model are unlikely to shift dramatically with moderate changes in the value of the OPE.
5. Discussion on analysis
The analysis conducted in this manuscript using the fuzzy AHP technique ranks the sustainability enablers. The results reveal that OPEs ranked first, highlighting their pivotal role in maintaining efficient operations during crises, followed by infrastructure enablers (IFEs) in second place, emphasizing the significance of resilient infrastructure. ENEs attained the third rank, underscoring their role in making RHSCs environmentally friendly, while social enablers (SOEs) secured the fourth rank, indicating their contribution to community engagement. Sodhi and Tang (2021) highlighted that sustainability-related challenges significantly disrupt the efficient functioning of RHSCs. Consequently, OPEs received first place, indicating their high effectiveness in the efficient functioning of RHSCs. Similarly, Shrivastav and Bag (2023) and Haavisto and Kovács (2014) discussed the social challenges to the sustainability of RHSCs. In response to these issues, the current study has identified and ranked SOEs to effectively manage social challenges during natural calamities or pandemics. Given the significant negative impact of natural calamities and pandemics on HSCs (Ivanov, 2022; Dohale et al., 2024), this study aims to explore sustainability enablers, as potential solutions. A recent study by Cao et al. (2021) underscores the ongoing uncertainties in sustainability, which this study aims to provide with concrete findings. It would be accurate to say that Singh et al. (2018) laid the foundation with their study on enhancing the resilience of HSCs. This study takes a step further by strengthening the sustainability of RHSCs. Moreover, it addresses the gap left by Papadopoulos et al. (2017), that inadequately covered the sustainability of RHSCs. Among the 34 subcategories, “Hyper-connectivity” i.e. OPE2, indicates that an extensively interconnected network claimed the top spot, followed by “Renewable energy sources for infrastructure” i.e. IFE3 in second place, the emphasizing adoption of sustainable energy solutions. Furthermore, “Sustainable procurement and sourcing practices” i.e. OPE5 ranked third, while “Resilient supply chain network design” (OPE7) ranked fourth, emphasizing adaptive systems. Similarly, “Resilient transportation networks” i.e. IFE1 is ranked fifth. Conversely, “Biodiversity conservation measures” with code ENE4 and “Sustainable resource management (water and energy)” with code ENE2 are ranked 33rd and 34th, respectively. The following subsections provide a deeper overview of the rankings achieved by categories and subcategories of enablers.
5.1 Operational enablers
In the analysis, OPEs achieved the top ranking with a priority weight of 0.28865. According to Singh et al. (2018), Haavisto and Kovács (2014) and Venkatesh et al. (2019), OPEs are essential for maintaining RHSCs during natural calamities and pandemics. The identification of OPEs as a critical enabler aligns with findings from a prior study conducted by Bag et al. (2020), but the context in that study was green HSCs. In contrast, Agarwal et al. (2020) failed to emphasize OPEs in their study on HSC enablers, whereas the current study fills this gap by identifying and underscoring their significance and criticality. Among OPEs, “Hyper-connectivity,” coded as OPE2, holds the foremost position within this group, gaining a preference weight of 0.1632. OPE2 also claims the leading spot among 34 subcategories of enablers. “Hyper-connectivity” facilitates sustainability in RHSCs by improving real-time communication, data sharing (Nguyen et al., 2022) and stakeholder coordination during natural disasters and pandemics. This fosters an agile response, informed decision-making and optimized resource allocation in crises, improving the efficiency, adaptability and effectiveness of HSC operations. Next, “Sustainable procurement and sourcing practices,” coded as OPE5, achieved second rank among the set of OPEs, with a priority weight of 0.1414. Furthermore, within the 34 subcategories, it secured the third rank. The enabler OPE5 enhances resilience in HSCs by conserving resources, diversifying suppliers and fostering adaptability. Moreover, within the set of OPEs, “Resilient Supply Chain Network Design” (OPE7) secured the third position, with a priority weight of 0.1398. It also ranked fourth among the 34 subcategories. This enabler plays a crucial role in enhancing sustainability within RHSCs, improving adaptability and recovery during calamities and pandemics. By optimizing structure, it reduces waste, lowers emissions and aligns with long-term environmental and social goals. Furthermore, “Reverse Logistics and Recycling Programs” (OPE8) holds the fourth position in terms of priority weight (0.1309) among OPE subcategories. Additionally, within the 34 subcategories, it ranks sixth with a priority weight of 0.0378. Moving forward, the fifth position is captured by OPE4, “Resilient Inventory Management,” this is followed by OPE6, “Risk Management and Contingency Planning,” in sixth place. The seventh spot is occupied by OPE3, “Technology Integration and Strategic Collaborations,” while the eighth position is secured by OPE1, “Process Optimization.” These rankings are determined by applying the priority weights assigned during the analysis, reflecting the varying degrees of criticality associated with each respective subcategory.
5.2 Infrastructural enablers
The assessment determines that infrastructural enablers (IFEs) hold the second rank, with a priority weight of 0.25350. The rationale behind this ranking is evident, as IFEs play a critical role in managing disruptions related to HSC infrastructure during natural calamities (Chari et al., 2021; Comes et al., 2018; Shareef et al., 2022). In fact, during pandemics, supply chain network infrastructure breaks down, leading to numerous challenges (Thompson and Anderson, 2021). Despite extensive work on HSC enablers by Agarwal et al. (2020) and Bag et al. (2020), they did not comprehensively address IFE. This study effectively bridges that research gap by providing detailed insights into this aspect. Among IFEs, IFE3 – “Renewable energy sources for infrastructure” – secured the first rank, with a priority weight of 0.1663. Likewise, IFE3 ranked second among 34 subcategories of sustainability enablers. IFE3 serves as a crucial driver of sustainability, enhancing the resilience of HSCs in various ways. First, it ensures energy security and reliability in disaster-prone regions where traditional energy sources may fail. By using solar, wind and hydropower, critical facilities can maintain operations, such as communication, medical services and refrigeration, even in postdisaster scenarios. Second, the adoption of renewable energy sources aligns with sustainability objectives by reducing reliance on fossil fuels, thereby mitigating environmental consequences and addressing the long-term effects of climate change.
5.3 Environmental enablers
In the assessment, ENEs emerge as the third most pivotal factor, with a priority weight of 0.21839. During natural calamities or pandemics, the environment invariably bears the initial brunt (Pateman et al., 2013). Inadequate measures to counter these events can lead to severe environmental degradation (Singh et al., 2018). Similar to other categories, Agarwal et al. (2020) and Bag et al. (2020) produced high-quality work on HSC enablers but did not provide a detailed analysis or discussion on environmental enablers. Within the ENEs, ENE1, i.e. “Carbon footprint reduction initiatives,” ranked first with a priority weight of 0.1482. By curbing carbon emissions, these efforts enhance environmental resilience, resource efficiency and stakeholder collaboration. They encourage localized operations, spur innovation and reduce health impacts, ensuring long-term adaptability and regulatory compliance. Thereafter, “Resource conservation” (ENE3) ranked second with a priority weight of 0.1337 within the pool of ENEs. ENE3 optimizes resource use, extending supply chain operations and reducing environmental impact. This leads to improved resilience, equitable distribution and continued infrastructure functionality. Moreover, it empowers communities, saves costs, supports long-term preparedness and fosters public awareness. Furthermore, ENE6, i.e. “Pollution prevention and waste reduction,” ranked third with a priority weight of 0.1227. By efficiently using resources, protecting the environment, ensuring health and safety and maintaining operational continuity, these practices play a pivotal role in enhancing supply chains during crises. They promote community well-being, sustainability, collaboration and adaptability, thereby increasing overall effectiveness. Similarly, ENE8, referred to as “Circular Economy Adoption,” is ranked fourth among the ENEs, with a priority weight of 0.1218. Adopting a circular economy strategy significantly strengthens the resilience of HSCs during natural calamities and pandemics. By focusing on resource efficiency, localized production and waste reduction, this approach ensures the optimal use of essential materials even during crises. It encourages the development of resilient infrastructure, promotes repair and reuse and fosters community engagement and economic stability. Furthermore, the strategy’s emphasis on supply chain diversity and innovation facilitates swift adaptation to changing circumstances. According to the assigned priority weights, the subcategories ENE5, ENE9, ENE7 and ENE4 are ranked fifth, sixth, seventh and eighth, respectively.
5.4 Social enablers
The analysis further assesses SOEs to comprehend their degree of importance. These enablers are frequently overlooked by researchers; however, without a concentrated focus on SOEs, the fundamental objectives of HSCs cannot be fulfilled (Behl and Dutta, 2019; Haavisto and Kovács, 2014). The literature review clearly indicates that previous studies have neglected the significance and implications of SOEs for stakeholders, a gap that this current study aims to fill. These enablers, assigned the lowest rank (fourth) with a priority weight of 0.23945, are pivotal for enhancing sustainable RHSCs in the face of natural calamities and pandemics (Jeble et al., 2020). SOEs encompass community engagement, local knowledge and grassroots organizations that enhance disaster preparedness and response. They leverage social networks for effective communication, respect cultural sensitivities and mobilize local resources, reducing dependency on external supply chains (Shrivastav and Bag, 2023). Moreover, SOEs offer psychosocial support, promote adaptive learning, advocate for policies and use technology for data collection and citizen engagement. SOE9, namely, “Cultural sensitivity,” is ranked one with a priority weight of 0.1472 among the pool of SOEs. This enabler plays a vital role in strengthening the resilience of HSCs during natural calamities and pandemics. It involves understanding and respecting cultural differences, which have several benefits. First, it facilitates clear and effective communication with diverse communities, preventing misunderstandings and panic. Second, it builds trust by showing respect for local customs and values, leading to better cooperation between aid providers and the affected population. Similarly, SOE2, that is, “Health and safety standards for workers,” is ranked second with a priority weight of 0.1292. SOE2 serves as a critical SOEs in building resilient HSCs during natural calamities and pandemics. By prioritizing worker well-being, these standards ensure a steady and motivated workforce capable of maintaining operations in crisis situations. This reduces absenteeism and turnover, enhances rapid response capabilities and strengthens community trust. Further, SOE7, that is, “Collaboration with local authorities and NGOs,” is ranked third with a priority weight of 0.1159. SOE7 is a vital SOE that boosts the resilience of HSCs during natural calamities and pandemics. By teaming up with these local entities, disaster relief efforts benefit from their on-ground knowledge, rapid response capabilities and community trust. This partnership ensures swift information sharing, targeted aid delivery and access to hard-to-reach areas. Further, according to the assigned priority weights, the subcategories coded as SOE8, SOE5, SOE6, SOE3, SOE4 and SOE1 are ranked fourth, fifth, sixth, seventh, eighth and ninth, respectively.
6. Implications and contributions of the study
This section is divided into three segments: the first discusses implications and contributions to the existing literature, the second outlines recommended actions for industry managers based on the results of the analysis and the third addresses social implications and contributions.
6.1 Theoretical implications and contributions of the study
The identification of key sustainability enablers for resilient HSCs presents pivotal theoretical implications and contributions to the field. In the context of RHSCs with a focus on sustainability, there is a scarcity of scholarly works. This study was inspired by Nawazish et al. (2023), who concluded that there was a lack of quality academic literature on sustainable HSC management. We advocate for the adoption of crucial sustainability enablers for RHSCs, distinguishing our work through an in-depth exploration of these enablers in the context of natural disasters and pandemics, extending beyond the scope of prior literature, such as Singh et al. (2018). While Singh et al. (2018) explored sustainability and resilience dimensions, their analysis was limited to 12 factors. In contrast, our study has identified and evaluated 34 sustainability enablers. Although Kaur and Singh (2022), Stewart and Ivanov (2022) and Dubey et al. (2020) examined models for resilient HSCs, our study offers a novel contribution by focusing on how to sustain this resilience during natural calamities and pandemics. This study demonstrates extensive depth and breadth, significantly exceeding the contributions of previous attempts. While similar attempts by Papadopoulos et al. (2017) and Bag et al. (2020) offer some parallels, our study’s unique context (specifically targeting natural calamities and pandemic-like situations) makes it both novel and timely. This study effectively opens an unexplored area where resilient HSCs face sustainability challenges amid natural calamities and pandemics, which are likely to become increasingly frequent. Identifying and prioritizing enablers like “Hyper-connectivity,” ranked first, highlights the need for hyper-integration among stakeholders during crises, a topic not extensively covered in the existing literature. Further, “Renewable energy sources for infrastructure” and “Sustainable procurement and sourcing practices” are novel in this context as they emphasize the integration of green energy and responsible sourcing, which has been less explored in this context. Their inclusion indicates a proactive approach to reducing environmental impact and ensuring operational continuity during crises, thus contributing to the theoretical implications by expanding the scope of sustainability for RHSCs. In this manner, these ranked sustainability enablers not only advance the academic discourse on supply chain resilience and sustainability but also provide actionable insights for practitioners managing the intricacies of humanitarian operations. In conclusion, to the best of our knowledge, this study represents one of the pioneering efforts, if not the most significant, to evaluate sustainability enablers for resilient HSCs in the context of natural calamities and pandemics.
6.2 Implications and contributions for the industry managers
In today’s dynamic and unpredictable world, managing HSCs presents unforeseen challenges. The situation becomes even more uncertain when natural calamities and pandemics occur, making it nearly impossible for industry managers to maintain control and manage the circumstances effectively. Unfortunately, previous sections have highlighted that no existing studies address the integration of sustainability and resilience within HSCs in the context of natural disasters and pandemics. Upon identifying this gap, current research emphasizes the need to assess and prioritize sustainability enablers to enhance the resilience of HSCs, enabling them to mitigate the impacts of such crises. The integration of sustainability principles, along with the identification and prioritization of critical sustainability enablers using the fuzzy AHP method, offers a promising approach for industry managers to strengthen the resilience and effectiveness of their operations. These enablers not only address the immediate needs of disaster-stricken areas but also contribute to the overall sustainability and long-term viability of RHSCs. This study aids practitioners in optimizing resource utilization across all phases of the disaster relief cycle-mitigation, preparedness, response and recovery. By incorporating the insights from this research, managers can identify and address weaknesses in the delivery of relief items to those affected by humanitarian crises. As mentioned earlier, the lack of relevant literature is a primary reason for the limited awareness among managers and stakeholders about the appropriate course of action. This study has identified 34 subcategories of sustainability enablers. Notably, it expands on the work of Singh et al. (2018), which was limited to just 12 enablers and may not have provided comprehensive insights for managers. This research also addresses the findings of Nawazish et al. (2023), who highlighted a deficiency in high-quality academic literature on sustainable HSC management. Based on the analysis, it is crucial for managers to prioritize the implementation of at least the top ten ranked enablers. Once these are successfully implemented, additional measures can be taken for the remaining ones. This section, therefore, focuses on the relevance of the highest-ranked enablers for managers. For instance, ranking “Hyper-connectivity” as the top sustainability enabler greatly benefits managers and stakeholders in resilient HSCs by ensuring real-time data exchange, enabling swift decision-making and responding to dynamic situations. It facilitates seamless coordination among various actors, improving resource allocation and reducing inefficiencies. Enhanced communication networks also support the integration of advanced technologies such as Internet of Things (IoT) and AI, which optimize supply chain operations. Similarly, “Renewable Energy Sources” are critical for managers and stakeholders in resilient HSCs due to their ability to ensure uninterrupted power supply during disasters, reducing dependency on vulnerable traditional energy grids. These sources facilitate the deployment of mobile and off-grid solutions, enhancing operational continuity in remote or affected areas. They significantly reduce the carbon footprint, aligning humanitarian efforts with global sustainability goals. Similarly, “Sustainable Procurement and Sourcing Practices” are crucial for industry managers and stakeholders in resilient HSCs. These practices ensure the availability of resources during disruptions by diversifying suppliers and prioritizing ethical and reliable sources. This approach reduces dependence on single suppliers, thus mitigating risks associated with supply chain interruptions. It also fosters long-term partnerships with suppliers, enhancing collaboration and trust, which are crucial during emergencies. By integrating sustainability into procurement, organizations can achieve cost efficiencies through waste reduction and resource optimization. Furthermore, “Resilient Supply Chain Network Design” is essential for industry managers and stakeholders, as it facilitates the strategic prepositioning of resources and facilities, ensuring a rapid response to disasters. This design enhances flexibility and adaptability, enabling rapid adjustments to supply chain disruptions caused by natural calamities and pandemics. By incorporating advanced technologies like AI and IoT, the design improves real-time monitoring and decision-making capabilities, ensuring efficient resource allocation and reducing response times. Thus, each of these sustainability enablers has the potential to guide industry managers in taking appropriate actions to prepare HSCs before future calamities or pandemics. This study will assist industry managers in identifying weaknesses in their HSCs and implementing these crucial sustainability enablers to prevent potential damage.
6.3 Social implications and contributions
The social implications of the article extend to the broader global community by emphasizing the importance of preparedness and sustainability in the face of calamities and pandemics. The findings underscore the need for collaborative efforts among governments, NGOs and communities to enhance the social aspects of HSCs. Additionally, the inclusion of SOEs in the identified categories recognizes the roles of community engagement, social cohesion and cultural considerations in building resilient supply chains. For example, key SOEs, such as “cultural sensitivity,” “health and safety standards for workers” and “collaboration with local authorities and NGOs,” are essential for maintaining the sustainability of resilient HSCs during natural calamities and pandemics. Cultural sensitivity ensures that aid is effectively tailored to the local context, fostering trust and cooperation among affected communities. Adhering to health and safety standards protects workers from harm, thereby ensuring the smooth and efficient delivery of aid without compromising their well-being. Collaboration with local authorities and NGOs enhances coordination, leverages local knowledge and mobilizes resources more effectively. Collectively, these enablers improve the speed and efficiency of relief efforts, reduce the risk of miscommunication and conflict and build stronger, more adaptable supply chains that can better withstand and recover from disasters. Socially, these enablers contribute to greater community resilience, improved working conditions and more inclusive and effective humanitarian interventions. In essence, the research article not only enriches scholarly discussions on HSCs but also offers actionable insights that have the potential to improve the social fabric of disaster-affected communities. By highlighting the social dimensions within the identified sustainability enablers, the study advocates for a more people-centric and community-resilient approach to managing and mitigating the impacts of calamities and pandemics. The contributions of these sustainability enablers extend beyond immediate crisis response. By incorporating these enablers into their strategies, industry managers can foster a more sustainable, resilient and efficient approach to HSCM, thereby contributing to the industry’s evolution and growth in the face of ever-changing challenges.
7. Conclusion
The resilience of humanitarian supply chains (RHSCs) critically relies on their sustainability to effectively withstand natural calamities and pandemics, ensuring smooth operations during catastrophic events. RHSCs play an essential role in delivering relief aid and maintaining a steady flow of essentials to disaster-affected populations. Any disruptions caused by unforeseen challenges that compromise sustainability can lead to significant delays and disturbances in aid delivery, underscoring the need for substantial attention from stakeholders. Recent events, such as the Russia-Ukraine conflict and the COVID-19 pandemic, exemplify these challenges. This research aims to identify and analyze the key sustainability enablers for RHSCs in the context of natural calamities and pandemics. Through a comprehensive literature review and the Delphi technique, we identified four major categories and 34 subcategories of enablers. We then applied the fuzzy AHP to evaluate and rank these enablers based on their criticality. Additionally, we performed a sensitivity analysis to test the robustness of the model developed using the fuzzy AHP. In the analysis, operational and infrastructural enablers were identified as the most critical, while environmental and social enablers were considered less important in comparison. Among the 34 subcategories evaluated, “Hyper-connectivity,” “Renewable energy sources for infrastructure” and “Sourcing practices for sustainable procurement” were ranked as the top three, respectively. Furthermore, the findings and recommendations of this research offer valuable insights for stakeholders to enhance the effectiveness of RHSC operations in meeting humanitarian needs.
8. Limitations of current study and future research direction
While this research provides valuable insights, it also presents some limitations and opens new avenues for future study. First, the study predominantly focuses on natural calamities and pandemics, potentially overlooking other catastrophic events that could jeopardize HSCs. Second, to eliminate potential biases and develop a more robust model, it would have been beneficial to explore other modern MCDM methods. It is possible that these alternative MCDM techniques might yield better results than fuzzy AHP. Future research could explore a broader range of crises to comprehensively address the varied dynamics influencing Resilient Humanitarian Supply Chains (RHSCs) while also experimenting with different cutting-edge MCDM methods. Additionally, future research could dive deeper into the top-ranked technology enablers, particularly focusing on human-technology interactions within HSCs, a topic that is currently being discussed among experts.
8.1 Executive summary
Given the challenges faced by resilient HSCs in maintaining smooth operations during natural calamities and pandemics, it is crucial to conduct an in-depth study of their sustainability. This study will provide valuable insights into how these supply chains can better withstand such disruptions and continue to function effectively under adverse conditions. The research highlights the scarcity of literature and insights in this domain, attributing the limited success in addressing sustainability challenges to this gap. Consequently, this study uses the fuzzy AHP methodology of MCDM to assess four major categories of sustainability enablers, comprising 34 subcategories that cover infrastructural, operational, environmental and social aspects. The study ranks these categories and sub-categories based on their importance and precedence. In the analysis, OPEs are identified as the highest priority, ranking first, followed by infrastructural and environmental enablers. Conversely, SOEs are ranked as the least important. Similarly, the subcategories are ranked based on their individual critical importance. The findings hold profound implications for stakeholders in the HSC sector, providing valuable guidance for managing future disruptions. By addressing existing literature gaps, this study significantly contributes to enhancing industry managers’ ability to navigate sustainability challenges within RHSCs. Its relevance lies in offering actionable insights to enhance the sustainability of RHSCs, ultimately aiding in effective crisis management and response.
 Vishal Kashav (First Author and Corresponding Author) is an Assistant Professor in the Department of Energy and Transportation at the School of Business, UPES, Dehradun, India. He holds a PhD in Logistics and Supply Chain Management from the University of Petroleum and Energy Studies, Dehradun. Additionally, he earned an MBA in Port and Shipping Management and a bachelor’s degree in Shipping with a subspecialization in Multimodal Transportation. Kashav has completed two diploma programs in Transport Economics and Management and Multimodal Logistics and Containerization from the Ministry of Railways, Government of India. He has published ten research papers and participated in several reputed international conferences. With over a decade of professional experience in both industry and academia, Kashav has published in top-tier journals such as the Journal of Business and Industrial Marketing, Transportation Research Part D, Annals of Operations Research and Environment, Development and Sustainability. His research interests include Digital Supply Chain Management, Multimodal Transportation and Sustainability.
 Chandra Prakash Garg (Second Author) is an Assistant Professor in the Department of Operations Management and Quantitative Techniques at the Indian Institute of Management, Rohtak, India. Dr Garg’s research interests encompass transportation research, aviation management, sustainability, e-waste management, reverse logistics, green supply chain management and inventory control. He holds a master’s degree in mathematics, an MBA, and a PhD in Operations and Supply Chain Management from IIT Roorkee, India. Dr Garg has published extensively, with his research appearing in esteemed journals such as the Journal of Cleaner Production, Journal of Manufacturing Systems, Sustainable Production and Consumption, Production Planning and Control, Resources, Conservation and Recycling, Transportation Research Part A, Annals of Operations Research and Transportation Research Part D. He has published over 50 research papers in prestigious journals and conferences.
The authors sincerely express their gratitude to UPES and IIM Rohtak for their unwavering support and resources throughout this research. The authors also extend their heartfelt thanks to the editors and reviewers for their valuable feedback and insightful suggestions, which significantly enhanced the quality of their work.
