Advanced driving assistance system (ADAS) has been applied in commercial vehicles. This paper aims to evaluate the influence factors of commercial vehicle drivers’ acceptance on ADAS and explore the characteristics of each key factors. Two most widely used functions, forward collision warning (FCW) and lane departure warning (LDW), were considered in this paper.
A random forests algorithm was applied to evaluate the influence factors of commercial drivers’ acceptance. ADAS data of 24 commercial vehicles were recorded from 1 November to 21 December 2018, in Jiangsu province. Respond or not was set as dependent variables, while six influence factors were considered.
The acceptance rate for FCW and LDW systems was 69.52% and 38.76%, respectively. The accuracy of random forests model for FCW and LDW systems is 0.816 and 0.820, respectively. For FCW system, vehicle speed, duration time and warning hour are three key factors. Drivers prefer to respond in a short duration during daytime and low vehicle speed. While for LDW system, duration time, vehicle speed and driver age are three key factors. Older drivers have higher respond probability under higher vehicle speed, and the respond time is longer than FCW system.
Few research studies have focused on the attitudes of commercial vehicle drivers, though commercial vehicle accidents were proved to be more severe than passenger vehicles. The results of this study can help researchers to better understand the behavior of commercial vehicle drivers and make corresponding recommendations for ADAS of commercial vehicles.
1. Introduction
Transportation system has caused a lot of concern in many aspects including efficiency (Gao et al.,2020; Wu et al., 2020; Li et al., 2019), environmental protection (Gao et al., 2021; Xu et al., 2021; Qu et al., 2020) and safety (Meng and Qu, 2012; Kuang et al., 2015; Shi et al. 2021). Due to the serious consequences of road accidents on property and human life, road safety has been widely studied by relevant researchers for decades. Road accidents is expected to increase from the ninth factor of mortality to the seventh by 2030, which cause approximately 1.8 million deaths per year (World Health Organization, 2018). In addition, when focusing on accident severity and consequences, those involving large-size commercial vehicles can bring more severe consequences and further influences.
According to previous researches, approximately 90% of road crashes are related to human factors (Treat et al., 1979). Various efforts have been made to better understand drivers’ driving behavior to improve road safety (Liu et al., 2020; Wang et al., 2020; Cao et al., 2020). Commercial vehicle drivers are full-time drivers with the skills to safely operate large vehicles. To improve commercial vehicle drivers’ behavior and safety, various advanced driving assistance systems (ADAS) have been widely installed in commercial vehicles. Among all these functions of ADAS, the most common ones are forward collision warning (FCW) and lane departure warning (LDW) systems.
The effectiveness of FCW and LDW systems has been evaluated by various studies ever since the application of ADAS (Pan et al., 2021; Zhao et al., 2021). Shinar and Schechtman (2002) carried out an experiment containing 43 drivers. They are required to drive vehicles without FCW system for three weeks and with FCW system for another three weeks. After the experiment, the time of drivers spent in short headways (<0.8 s) reduced by approximately 25%, and the time of drivers spent in safer headways (>1.2 s) increased by nearly 20%. A real-world driving trial containing two scenarios (with FCW system and without FCW system) was carried out by Birrell et al. (2014). They found that the average time headway increased from 1.5 s to 2.3 s after the installation of the system. The performance of the FCW system was evaluated by Yang and Kim (2018) in public transportation. The results showed that 75% of the drivers have significant differences in driving behavior after the installation of FCW system and 40% of them have confidence in this system. Puente Guillen and Gohl (2019) proposed a comfort boundary (CB) model to select appropriate warning timing for FCW system. They found that participants had a higher acceptance of the system with the warning outside the CB.
A research by LeBlanc (2006) indicated that the application of LDW system can bring positive influence on drivers. The frequency of lane departure behavior decreased by 63%, and the use of turning signals become more frequent. Scanlon et al. (2015) explored the LDW system by microsimulation; they found a 26% reduction of lane departure crashes for those vehicles with LDW systems compared to those without LDW systems. Saito et al. (2016) evaluated a driver assistance system with a dual control scheme by using driving simulators. Three scenarios were included, and 20 students participated in this study. The results show that the system can provide LDW signals timely under fatigue driving situation and conduct safety control rapidly. After considering the factors including severity, vehicle type and driver demographics, Cicchino (2018) indicated that vehicles equipped with LDW were involved in fewer crashes than those without LDW. Gaspar and Brown (2020) conducted a study to examine the effectiveness of LDW as a function of driver distraction. They found that LDW systems are more effective when drivers are distracted. Drivers with LDW respond faster and has less severe lane departures than those without LDW.
As well as measuring the performance of FCW and LDW systems, some efforts have also been made to explore the key factors influencing drivers’ acceptance of these two systems. A comprehensive review relating to FCW systems was carried out by Vahidi and Eskandarian (2003). After the review, warning timing was found to be a significant influence factor on driver acceptance. Another study by Muhrer et al. (2012) applied driving simulators to evaluate drivers’ react on an enhanced FCW system with auto braking. Based on the drivers’ gaze behavior, they argued that the application of this system did not lead to a stronger involvement in secondary tasks. However, Wege et al. (2013) reported a negative adaptation of FCW system in their study based on 30 Volvo trucks with nearly 40,000 h and four million kilometers. The results indicated that FCW system may cause dangerous situations due to an “eyes-off-road effect” caused by the visual signals during warning periods.
Drivers with different age, gender and driving skills may have different attitude toward ADAS. A study conducted by Shaheen and Niemeier (2001) indicated that ADAS can provide support for elderly drivers on motion perception, peripheral vision, selective attention and information process speed, which can significantly improve diving safety for elderly drivers. Li et al. (2015) evaluated the driver acceptance of ADAS in Chinese road conditions. They found that there are significant differences in driver acceptance with the variation of driver gender and driver age. By considering the influence of age, gender and road environment, Son et al. found that drivers with different age and gender have significant differences on the acceptance of ADAS. Female drivers and young drivers have less acceptance on ADAS, while road environment also have influence on drivers’ acceptance.
Based on the researches, the application of FCW and LDW systems can reduce crashes significantly (Kusano and Gabler, 2015). On the other side, most commercial vehicle drivers are skilled ones and may have different attitudes toward ADAS under different situations. A single warning standard for all situations without considering various factors may lead to the decline of commercial driver acceptance. The exploration of influencing factors on commercial vehicle drivers’ acceptance toward FCW and LDW systems is necessary.
Therefore, smarter systems have been investigated to improve the acceptance by considering surrounding environments and drivers’ reaction. The intelligent algorithms are mainly divided into two categories. One category contains several risk models in one system and selects the most suitable one based on drivers’ real-time behavior (Hirose et al., 2004). One example of this category is the study carried out by James et al. (2004). They developed an FCW model based on driver reaction and acceptance. The model can select the most adequate risk model based on drivers’ brake behaviors. Another category applies one risk model with a continuous adjustable parameter. The parameter value can be adjusted based on autonomic learning of driving behavior (Rajaonah et al., 2008; Chang and Chou, 2009). Wang et al. (2015) applied this kind of method and proposed an FCW model with an adjustable parameter. The model can match driver characteristics throughout a long driving period and adjust the model parameter in a timely manner.
Many efforts have been made to explore the influence factors of driver acceptance on FCW and LDW systems and improve system efficiency. However, the majority of the studies focus on private cars; few studies have paid attention to commercial vehicle drivers’ acceptance on FCW and LDW systems. Targeted ways to improve FCW and LDW systems for commercial vehicles are rare. It is essential to investigate the characteristics and influence factors of commercial vehicle driver acceptance on FCW and LDW systems to help develop more targeted systems for commercial vehicles.
This article focuses on exploring the influence factors of commercial drivers’ acceptance on FCW and LDW systems. Driver response and several relevant variables including driver characteristics, vehicle status and road environments were collected and analyzed. A random forests model was applied. The results of this study can help system designers better understand the influence mechanism of FCW and LDW systems on commercial vehicles and discover the differences of commercial vehicle drivers’ acceptances on FCW and LDW systems. The findings can help make corresponding recommendations for ADAS of commercial vehicles and design a differentiated ADAS system for commercial vehicles based on various factors.
2. Method
2.1 Data extraction
The naturalistic driving data applied in this study is from the intelligent data platform of commercial vehicles in Jiangsu province. In Jiangsu province, all commercial vehicles are required to install an ADAS system to improve safety. The system state and commercial vehicle drivers’ behavior are recorded and uploaded to the official platform for further analysis and research. In this study, FCW and LDW warning information from 24 vehicles (12 buses and 12 trucks) from November 1 to December 21 in 2018 were applied. There were 24 male drivers since the majority of commercial vehicle drivers are male. Nine young drivers (18–35 years old), 11 mid-aged drivers (35–50 years old) and four older drivers (more than 50 years old) were involved in this study. Each record contains several variables including driver ID, warning start time, warning end time, vehicle speed before warning, vehicle speed after warning, vehicle steering angle, vehicle GPS. After preprocessing, 1,706 FCW data and 43,221 LDW data were finally obtained.
To identify the location of each warning, we transferred the GPS data to Baidu coordinate system and applied Baidu map API service. GPSspg xGeocoding software was used, and the road type (urban road or freeway) were finally obtained.
Driver acceptance of FCW and LDW systems was measured by their response to warning signals. For FCW system, driver mainly respond to the signal by decelerate vehicle speed. The driver was regarded as “response” if the vehicle speed before FCW signals is larger than the speed after FCW signals, otherwise, the driver is regarded as “no response.” For LDW system, driver mainly respond the signal by correct the direction. The driver was regarded as “response” if the steering angle is larger than 0, otherwise, the driver is regarded as “no response.”
2.2 Random forests algorithm
With the development of computer science, various machine learning methods have been applied in driver behavior analysis and road safety researches due to the accurate fitting results and outstanding performance of handling large amounts of data (Ngxande et al., 2017; Yao et al., 2018). Compared to traditional generalized linear models, machine learning methods do not need any pre-hypothesis or any equations, which can avoid the limitations of expression forms and improve accuracy.
Random forests algorithm proposed by Breiman (2001) was applied in this study. Compared to other machine learning methods, for the problem of fewer types of features, random forests performs better in most and has higher interpretability by calculating the importance of influence factors with out of bag (OOB) data. Random forests consists of numerous decision trees. Each decision tree is independent. The result of random forests can be obtained by combining the results of all decision trees.
2.2.1 Decision trees
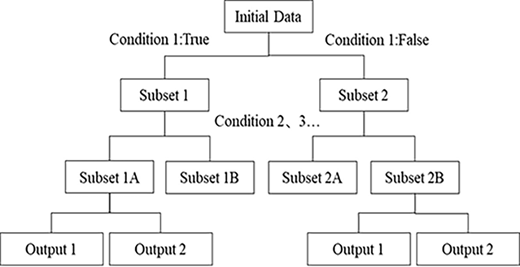
Before explaining random forests, decision tree is first introduced. A decision tree can also be called a classification tree or regression tree, depending on the output variable type (classified variable or continuous variable). It is the subunit of random forests (Quinlan, 1987). Figure 1 shows an example of binary decision tree. In a decision tree, each internal node means a “test” on an attribute, each branch means the different result of the test and each leaf node means a class label. The process from root to leaf represents classification rules.
Decision rules play the most important role during the process of tree establishment (Lunetta et al., 2004). In this study, Gini index was applied to measure the purity of the data. Gini index can help to confirm the best criterion of internal nodes and choose the best split point. This rule is one of the most widely used methods for data purity measurement and can also be used to divide the characteristics. Equation (1) shows the expression of a Gini index:
Gini(D) represents the probability that the categories of two samples are inconsistent when randomly select 2 samples from data set D. pi represents the probability of category i in the whole data set D. If condition A is selected as a classification standard, the Gini index after the split can be expressed as:
The Gini index gain value can be calculated as:
Therefore, the largest ΔGini(A) was selected when choosing the best criterion of internal nodes.
2.2.2 Random forests
Decision tree has been proven to be effective for classification problems. However, in most practical problems, a single decision tree cannot obtain a satisfactory result. Therefore, the concept of ensemble was applied to solve the inherent shortcomings of a single decision tree. The random forests algorithm is then proposed based on this concept. In random forests, we conduct several decision trees and combine them together. The result of random forests is obtained by considering the results of all decision trees.
When using random forests, there are mainly four steps. The detailed steps were summarized as follows:
Step 1: For each decision tree of the random forests, bagging method is applied for the selection of training set. This method draws the training set by sampling with replacement, which is one unique characteristic of random forests. After selecting, about one third of the data is left out of the samples. These are called out-of-bag (OOB) data (Breiman, 1996). This kind of data can be used in the following steps to evaluate the model accuracy and estimate the importance of the variables.
Step 2: After sample selecting, the input and output variables are run down the tree. Each tree is grown to the maximum depth to draw the final result of the decision tree. In the end, the results of the random forests are obtained by averaging all the results of the individual decision trees. The generalization error of random forests is limited since there are a large amount of decision trees. In other words, random forests can handle over-fitting problems superiorly.
Step 3: After getting the results, OOB data is applied to estimate the OOB error. Cross-validation or separate test set is not necessary in random forests since the unbiased estimate of the result has already been estimated internally during the run by estimating OOB error [37]. The OOB error of the prediction can be calculated by:
where I(*) represents the indicator function; n represents thenumber of trees in the random forests; Xi represents the input of ith OOB data; Yi represents the actual output of ith OOB data; and YOOB(Xi) represents the predicted output calculated by random forests.(4)Step 4: At the end of the algorithm, the importance of each variable should be calculated. Permutation importance and GINI importance are two common methods for the calculation. If the input variables have both classified variables and continuous variables, the accuracy of permutation importance is a little higher than GINI importance. Therefore, we apply permutation importance in this study. VIMOOB is used to represent the permutation importance of the variable. It can be calculated by:
where F(*) represents the indicator function; represents the number of OOB data in jth decision tree. Yp represents the actual output of pth OOB data; represents the predicted result after Xi is permuted.
Finally, the permutation importance can be calculated by:
Python software was used in this study to develop the random forests algorithm and calculate the OOB error and importance.
3. Results
In this part, both FCW and LDW records and relative variables were applied to the random forests. Among various variables, significant variables were preliminarily screened by variance analysis. After the selecting, six significant variables were used in random forests for FCW and LDW records, separately.
3.1 Analysis of drivers’ acceptance on forward collision warning system
Total, 1,706 valid FCW records were identified during 51 days. After variance analysis, six significant variables including vehicle speed, warning hour, duration time, road type, driver age group and vehicle type were selected for the random forests. Among these variables, vehicle speed represents the speed when the alarm signal starts. Warning hour represents the alarm time, from 1 o’clock to 23 o’clock. Duration time means the time interval from warning start time to warning end time. Detailed characteristics of each variable were listed in Table 1. In Table 1, SD means standard deviation.
Driver acceptance was measured by driver reaction, which was separated as a binary variable, 0 means no response and 1 means response. In total, 1,186 response cases were found among 1,706 records. The acceptance rate of FCW was 69.52%.
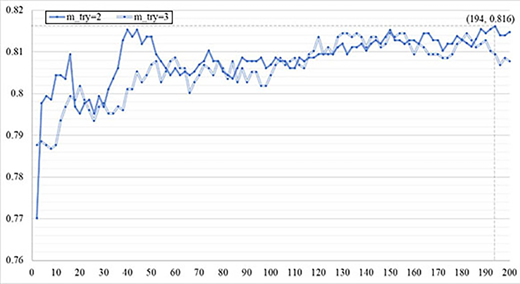
Random forests was then conducted using the above variables. In this method, two parameters, m_try and n_tree, should be tuned to obtain an optimal performance. m_try means the number of input variables in each decision tree. n_tree means the number of decision trees in a random forests algorithm.
For the selection of m_try, the common value is confirmed by , where N represents the total number of input variables. In this case, six different variables were applied as inputs, so the value of m_try can be 2 or 3. In addition, n_tree is identified as a value that provides stable OOB errors. The common value of n_tree can be confirmed by comparing the OOB error of different values from low to high. To achieve the most suitable value, a line graph was drawn to represent the accuracy tendency (1-ER) when n_tree increases. Both m_try = 2 and m_try = 3 were drawn in this figure.
From Figure 2, we can find that the accuracy increases with the increase of n_tree in the beginning and then gradually becomes stable. The accuracy reaches the maximum value when m_try = 2 and n_tree = 194. Therefore, m_try = 2 and n_tree = 194 were chosen in the final random forests algorithm. The final accuracy of the model is 0.816. It is relatively high, and the results of the model can be used for further analysis.
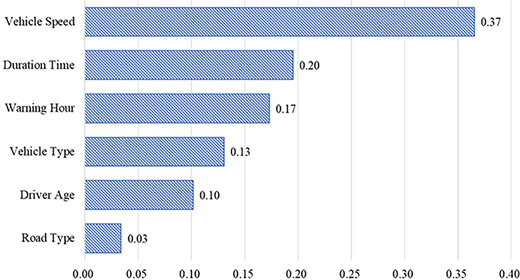
After running the random forests, the permutation importance of each variable was also calculated. The normalized importance for each factor is displayed in Figure 3. Among all influence factors, vehicle speed is found to be the most important variable. The importance value is 0.37. Duration time and warning hour also have significant influence on driver reaction. The values are 0.20 and 0.17, respectively. Road type has the lowest importance among 6 variables – the importance is only 0.03.
Three key variables, vehicle speed, duration time and warning hour, were selected for further analysis of the potential characteristics of driver reaction and relevant influence factors.
3.1.1 Vehicle speed
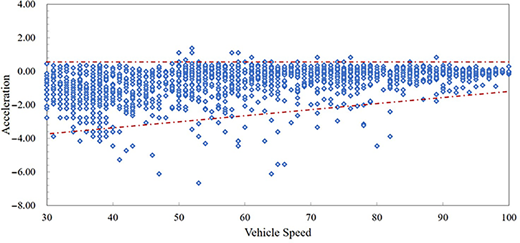
The relationship between vehicles speed and acceleration after FCW signals is shown in Figure 4. Vehicle speed represents the speed when the alarm signal starts, while acceleration represents the average acceleration from warning start time to warning end time. Drivers’ reaction is more obvious if the absolute value of acceleration is larger.
From Figure 4, we can conclude that most drivers have an obvious reaction to FCW signals when the initial vehicle speed is low (30–60 km/h). The degree of driver reaction reduced with the increase of vehicle speed. When vehicle speed is larger than 60 km/h, the acceleration value becomes small (less than −2.00 m2/s).
Therefore, the commercial vehicle drivers’ acceptance of FCW system decreases with the increase of vehicle speed. It may be attributable to the fact that commercial vehicles have greater size and weight than private cars. Sharp decelerate during high vehicle speed may cause many other potential risks. Drivers prefer to maintain the speed and do not brake hard when the original speed is high.
3.1.2 Duration time
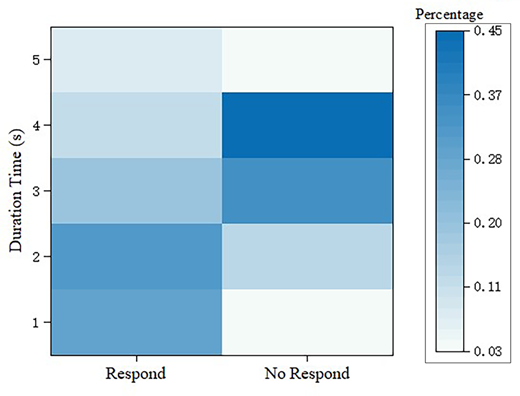
The number of FCW records for two types of responses were counted based on different duration time (from 1 s to 5 s) and are shown in a heatmap (Figure 5). In this heatmap, darker color represents higher percentage. Most duration times are 1 s (28.83%) or 2 s (31.45%) when drivers respond to the FCW signals, while the duration times are usually 3 s and 4 s if the drivers failed to respond to FCW signals, which indicates that drivers did not take any steps to respond after a long warning period.
Therefore, we can find that commercial drivers prefer to respond to FCW signals right away, mainly in less than 2 s. If they choose to ignore the warning, longer warning signals will not have a significant effect.
3.1.3 Warning hour
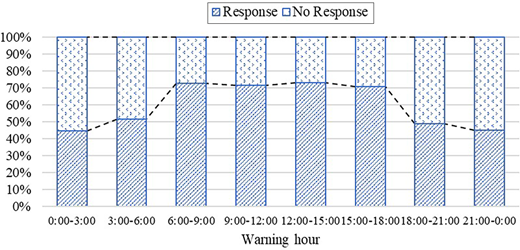
Figure 6 shows the histogram of warning hour. In this Figure, eight time periods (each period contains 3 h) were defined during one day. The percentage of respond and no respond in each time period was calculated and drawn as a bar.
From this figure, we can observe that commercial vehicle drivers have higher response percentage on FCW signals between 6:00 and 18:00, which are mainly falls within daytime periods. The percentages are all larger than 70% during these time periods. In other words, commercial vehicle drivers have higher response percentages on FCW signals during daytime than at night. For one side, drivers may easier to identify and respond to the danger situations warned by FCW systems when the light condition is good. While the day becomes dark, they may harder to make decisions in a short time period and prefer to trust their own judgements. For the other side, FCW systems may generate more false alarms when the light condition is poor.
Therefore, three key influence factors, vehicle speed, duration time and warning hour, are found affecting commercial drivers’ acceptance toward FCW systems. Commercial vehicle drivers have higher acceptance of FCW systems during daytime when commercial vehicles’ speeds are relatively low. The acceptance may decrease at night when commercial vehicles’ speeds are relatively high. They respond to FCW systems sensitively and timely in most instances, usually within 2 s.
3.2 Analysis of drivers’ acceptance on lane departure warning system
After the analysis of FCW system, commercial vehicle drivers’ acceptance toward LDW system have also been discussed. Total, 43,221 valid LDW records were collected in this case. After variance analysis, six significant variables including vehicle speed, warning hour, duration time, road type, driver age group and weather were selected for the random forests. Detailed characteristics of LDW records were listed in Table 2.
In this case, only one factor, weather, is different from FCW analysis. 1 means good weather (sunny, cloudy) and 2 means bad weather (rain, snow). For LDW records, 16,793 response cases were found among 43,221 records. The acceptance rate of LDW was 38.76%, which is significantly lower than FCW records. We can speculate that FCW records have higher acceptance than LDW records since FCW records means more urgent situations.
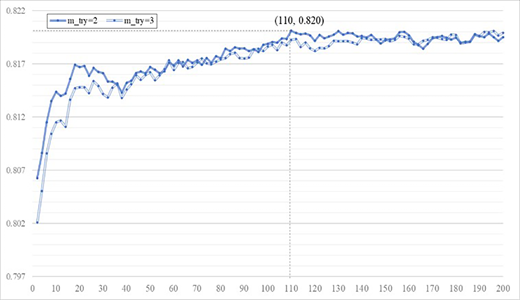
Random forests was also conducted in this part. Six different variables were applied as inputs, so the value of m_try can also be 2 or 3. To achieve the most suitable value for LDW analysis, we also drew a line graph to represent the accuracy tendency (1-ER) when n_tree increases. Both m_try = 2 and m_try = 3 were considered when drawing this Figure 7.
In the random forests for LDW records, the accuracy reaches the maximum value when m_try = 2 and n_tree = 110. Therefore, these two values were selected as the parameter for random forests algorithm. The final accuracy of the model is 0.820 and can be used for further analysis.
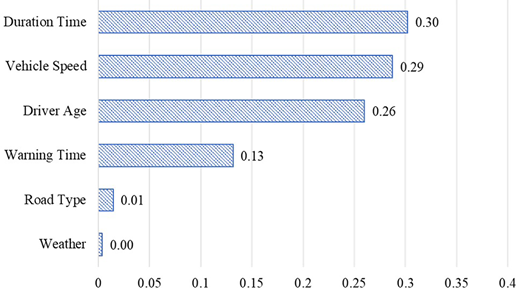
Normalized permutation importance of each influence variable for LDW signals is shown in Figure 8. For LDW signals, duration time and vehicle speed are most important ones. Duration time has the importance of 0.30, and vehicle speed has the importance of 0.29. Another important variable is driver age, with the importance of 0.26. These three variables were chosen for further analysis of the potential characteristics of driver reaction and relevant influence factors for LDW systems.
3.2.1 Duration time
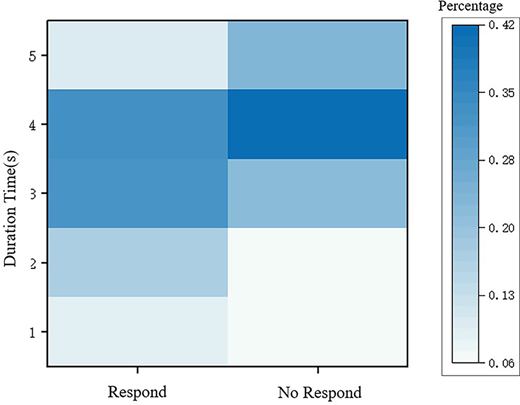
The number of LDW records for two types of responses were also obtained based on different duration time. The heatmap was show in Figure 9. From this figure, we can find that most respond cases fall in the duration time of 3 s (31.15%) and 4 s (33.06%). For no respond cases, most duration time are between 3 s and 5 s. Therefore, we can conclude that the reaction time of drivers for LDW signals are relatively slow than FCW signals. In addition, longer duration time has little efforts on commercial vehicle drivers’ acceptance since most no respond cases are with longer duration time.
3.2.2 Vehicle speed
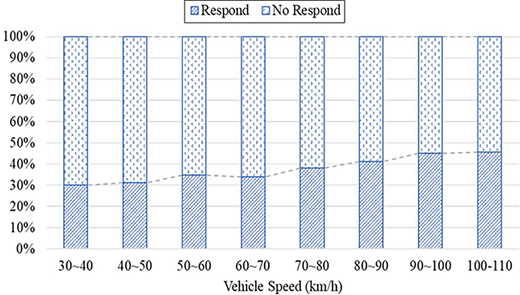
The relationship between vehicle speed and driver response type was measured and is shown in Figure 10. Based on this figure, we can find that commercial vehicle drivers’ respond percentage increases gently as vehicle speed increases. From 29.95% under 30–40 km/h to 45.59% under 100–110 km/h. In other words, the acceptance of commercial vehicle drivers on LDW systems increases with the increase of vehicle speed.
3.2.3 Driver age
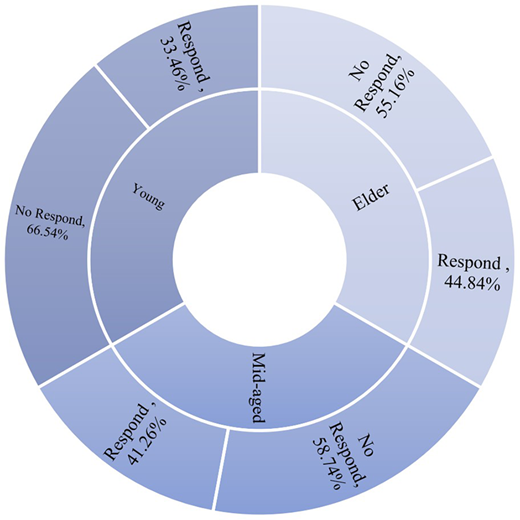
Different from FCW systems, another important factor influencing the acceptance of LDW systems is driver age. Figure 11 indicates the respond percentage for different age groups. The respond cases of young, mid-aged and elder drivers for LDW signals are 33.46%, 41.26% and 44.84%, respectively. The percentage increases with the increase of age. In addition, all the respond cases for three age groups are less than 50%. Therefore, we can find that commercial vehicle drivers’ acceptance for LDW systems is relatively low. The acceptance rate increases with the increase of driver age.
Therefore, duration time, vehicle speed and driver age are three key influence factors affecting commercial vehicle drivers’ acceptance toward LDW systems. Commercial vehicle drivers’ acceptance toward LDW systems are significantly lower than FCW systems. Moreover, the response of drivers to LDW signals are relatively slow. Drivers have higher acceptance of LDW systems when vehicle speed is higher and driver age is older.
4. Conclusion
Drivers’ acceptance of ADAS has been a hot topic of concern in road safety and human factors research. Some efforts have been made to explore drivers’ attitudes toward ADAS in different situations and identify the significant contributing factors. However, the majority of the studies only paid attention to private cars; few of them focused on commercial vehicles, which is inadequate since commercial vehicles have different vehicle structures (size, weight, etc.) from private cars, and commercial vehicle drivers’ acceptance of ADAS may be different from normal drivers. Therefore, this paper focused on exploring the acceptance of commercial vehicle drivers’ on ADAS. Two most widely used functions, FCW and LDW systems, were chosen for the analysis and the contributing factors were explored by developing a random forests model.
FCW and LDW records and relevant variables of 24 commercial vehicles (12 buses and 12 trucks) were collected from the intelligent data platform of commercial vehicles in Jiangsu province. The data includes 51 days from 1 November to 21 December in 2018. Total, 1,706 FCW records and 43,221 LDW records were finally selected. From the records, we can calculate that the acceptance rate of FCW is 69.52% and the acceptance of LDW is 38.76%. The result indicates that the acceptance of FCW is significantly higher than LDW. This mainly because that FCW is a high-level and more severe warning, while LDW is a relatively low-level warning and mainly for regulate driver behavior. Drivers prefer to respond to FCW in most situations and sometimes ignore LDW signals.
Random forests was applied in this study. Two parameters m_try and n_tree were tuned, and the accuracy of FCW and LDW records after tuning are 0.816 and 0.820, respectively. The accuracy is relatively high and can be used for further analysis. The permutation importance of each variable was calculated and normalized for both FCW and LDW records.
For FCW records, vehicle speed is found to be the most important variable affecting drivers’ acceptance with the importance of 0.37. Duration time and warning hour are another two key factors with the importance of 0.20 and 0.17, respectively. After further analysis, we found that commercial vehicle drivers’ acceptance of FCW system decreases with the increase of vehicle speed. They prefer to respond to FCW signals during daytime and in a timely manner, usually in less than 2 s. Therefore, it may be beneficial to reduce the threshold of FCW systems during daytime under low vehicle speed and increase the threshold of FCW systems at night when vehicle speed is high. This may improve the acceptance of the system by commercial vehicle drivers. The alarm form for FCW warnings can be short and rapid signals since the responses to FCW signals are timely.
For LDW records, duration time and vehicle speed are most important ones. Duration time has the importance of 0.30 and vehicle speed has the importance of 0.29. Another important variable is driver age, with the importance of 0.26. After further analysis, we found that the acceptance rate of LDW system is low and commercial vehicle drivers’ response to this system is relatively slow. The acceptance rate is higher when vehicle speed is higher and driver age is older. Therefore, to improve the effectiveness of LDW, we can improve the threshold to reduce the warning frequency. The threshold can decrease with the increase of driver age and vehicle speed. The warning of LDW can use gentle and longtime signals to help drivers adjust vehicle status smoothly and avoid other risk situations.
Therefore, this paper investigated commercial vehicle drivers’ acceptance toward ADAS under different situations and gave several suggestions on commercial vehicle ADAS designment. The results can help researchers better understand the behavior of commercial vehicle drivers and make corresponding recommendations for ADAS of commercial vehicles.
In this study, the accuracy of ADAS is regarded as relatively high and be consistent at all times since Mobileye is a leading company of ADAS systems and has high quality of products. However, we did not make specific measurements to obtain the actual accuracy of the system. In the future, we will try to identify the accuracy of FCW system under different situations and combine commercial vehicle drivers’ attitude with system accuracy to further understand the characteristics.
This study was sponsored by the National Natural Science Foundation of China (number 52072070), the Foundation for Jiangsu Key Laboratory of Traffic and Transportation Security (TTS2020-04), and the Fundamental Research Funds for the Central Universities (number 2242021R10112).