


This paper aims to introduce vehicular network platform, routing and broadcasting methods and vehicular positioning enhancement technology, which are three aspects of the applications of intelligent computing in vehicular networks. From this paper, the role of intelligent algorithm in the field of transportation and the vehicular networks can be understood.
In this paper, the authors introduce three different methods in three layers of vehicle networking, which are data cleaning based on machine learning, routing algorithm based on epidemic model and cooperative localization algorithm based on the connect vehicles.
In Section 2, a novel classification-based framework is proposed to efficiently assess the data quality and screen out the abnormal vehicles in database. In Section 3, the authors can find when traffic conditions varied from free flow to congestion, the number of message copies increased dramatically and the reachability also improved. The error of vehicle positioning is reduced by 35.39% based on the CV-IMM-EKF in Section 4. Finally, it can be concluded that the intelligent computing in the vehicle network system is effective, and it will improve the development of the car networking system.
This paper reviews the research of intelligent algorithms in three related areas of vehicle networking. In the field of vehicle networking, these research results are conducive to promoting data processing and algorithm optimization, and it may lay the foundation for the new methods.
1. Introduction
The advancement of computer technology in recent years has allowed researchers to develop efficient optimization techniques for solving large-scale problems in various fields and helped practitioners to incorporate some of these techniques into their planning activities through specific integrated decision support systems (Jin and Meng, 2010; Chiong and Weise, 2011). Despite this, many real-world problems still cannot be solved within reasonable computational time using exact algorithms because of the complexities associated with the large number of decision variables involved and the extent of the constraints imposed (Chetty et al., 2010). As a consequence, non-exact methods such as custom designed heuristics, search algorithms and meta-heuristic approaches have become increasingly popular due to algorithmic efficiency, ease of implementation, flexibility for adaption and quality of solutions (Chiong et al., 2012). Among them, intelligent computing approaches inspired by principles of nature such as evolutionary algorithms, swarm intelligence algorithms, artificial neural networks and fuzzy logic have emerged as a rapidly growing research area. These approaches have been applied to various problems in different fields (Çatay et al., 2013; Jin and Hammer, 2014).
With the rapid development of the key technology of wireless networks, intelligent computing and other intelligent technologies, networking industry makes the vehicular networks enter a new stage of research, research on cross car networking involves many subjects, including the automotive industry, transportation, information and communication technology (Liu et al., 2010). The promising applications of vehicular ad hoc networks (VANET) are collision warning, location tracking, emergency brake notification, signal violation notification, parking lot availability, weather information and major information services on the road (Saravanan and Arunkumar, 2014; Saravanan and Arunkumar, 2016). At the same time, some of applications such as routing algorithms (Ratnasamy et al., 2002; Golden et al., 2010), data mining (Kargupta et al., 2004; Kargupta, 2010), positioning enhancement (Golestan et al., 2015; Du et al., 2015) and others have been widely used in the vehicular networks on the basis of intelligent computing.
In Section 2, this paper discusses the methods vehicular network platform and data quality assessment, and it also compares performance metrics. In Section 3, a routing and broadcasting methods in vehicular networks is drawn into this paper, and the effect has been improved obviously than before. We propose a method of vehicle positioning enhancement named CV-IMM-EKF in Section 4. Finally, this paper will sum up the three sections in Section 5.
2. Methods vehicular network platform and data quality assessment
Focus on our topic on internet of vehicle, vehicular network data need to be of high quality to reflect the operation pattern and running status of the vehicle, including vehicle fuel consumptions and traveling route (Tian et al., 2015). However, due to abnormalities of sensors and the unreliability of wireless communication environment, some data of vehicular sensors are inaccurate or incomplete. Hence, the quality of vehicular data is difficult to be guaranteed, which has strong relation to the validity and accuracy of data mining results (Hou et al., 2016; Chen et al., 2017). Therefore, quality control and analysis on these data is indispensable, to assessment the quality level of the data or to detect the sensor error, filter out the vehicle with inferior data quality.
In this section, we give a brief introduction of vehicular network big data platform and its data quality problem, including the database and outlier situation. Then we introduced a classification framework based on data fusion and machine learning approach to assess the quality of vehicular data.
2.1 Vehicular network data platform and data quality problem
A brief system framework of integrated vehicular network contains cellular networks and vehicle-to-vehicle (V2V) communication (Biswas and Giaffreda, 2014). The topic and data set introduced in this paper is from a vehicular network platform, which contain the vehicle running state data from thousands of vehicles. These data consist of global positioning system (GPS) coordinates, speeds, driving direction angle, fuel level value and so on. Figure 1 shows the real-time big data platform of our vehicular network and the data types of database. However, there are several types of abnormal situation during the process of fuel level data acquisition.
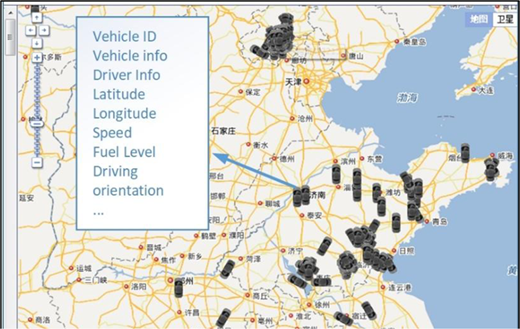
Vehicular network big data platform
Vehicular network big data platform
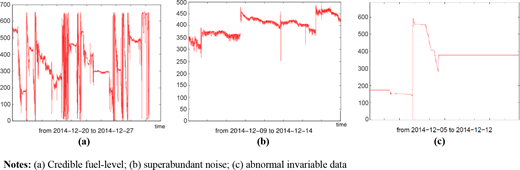
It is well-known that there should be positive correlation between the correct fuel consumption and the speed data, which is the fuel level should decline when the vehicle is running (Chen and Zhao, 2014). Contrary to the common sense, the fuel level of some vehicles remains unchanged while the vehicle is moving over an extended period. In some other conditions, same values appear frequently, while the uploaded fuel-level data are float numbers which should always fluctuate in a lesser range. We suppose that the possible causes of these abnormal situations are in the following items:
The sensors of vehicles may have too much noise or their errors are too large.
The terminal equipment may upload or read wrong values or error codes in communication with the sensors.
The information processing system on the server side may read and update wrong or null values into the database.
2.2 Data quality analysis for vehicular network data
Data quality problem is a further topic of anomaly detection, which is generally statistical approach (Chen et al., 2017). It could make use of the historical distribution of data. As a result, the classification approach is much stronger connected to their application area; this is often achieved by building rules. Multi-sensor data fusion generally provides significant advantages in data mining procession. In addition to the statistical advantage gained by obtaining an improved estimate of a physical phenomenon through redundant observations. The use of multiple types of sensors may increase the accuracy with which a phenomenon can be observed.
In this study, we tried to find the vehicles with large amounts of outliers which are defined as typical samples with abnormal data through observing the fuel level-time curve. The typical fuel level-time curves of two sample sets are as Figure 2. From the comparison of these figures, Figure 2(a) shows a typical fuel level curve of the sample with relatively credible data, while Figure 2(b) and (c) shows the opposite situation.
2.2.1 Features extraction based on data fusion and discrete wavelet transform
Data fusion with vehicular sensor data. To assess the data quality of the speed data, we compute the travel speed according to the GPS coordinates and compare it with the speed which is collected from running cars on real time (Smith et al., 2011). The travel speeds could be computed by latitudes φand longitudesλ, and we compute the relative error ratio of the uploaded speeds vu with the calculated travel speeds v*t. We use these calculated travel speeds to evaluate the accuracy of the uploaded speeds and the GPS coordinates, and found that these data are credible to some extent. In equation (1), t is the timestamp and i means the ith data point in the series:
Classification algorithm needs the input of the feature attributes before training. There is a relationship between fuel level and speed value; hence, we use standard deviation (STD) of these data and correlation coefficient between these multi-dimension data as features for classifier.
In the preprocessing procedure of many types of sensor data, the original series data may contain variety of noise and anomaly pattern. With the decomposition with discrete wavelet transform (Rodgers and Nicewander, 1988), the set of approximation coefficients Ak retained the main profile of the original data, which is a smooth serious with less noise. On the other hand, the set of detail coefficients D*k represented the noise and slope which contains anomaly pattern in different scaling function. The signal is decomposed simultaneously using a high-pass filterH. The outputs give the detail coefficients from the high-pass filter and approximation coefficients from the low-pass. However, as half the frequencies of the signal have now been removed, half the samples can be discarded:
2.2.2 Data quality assessment with machine learning algorithm
Bayesian network is a useful and powerful algorithm for uncertainty reasoning. For a data set S with attribute set X={X1,…,Xn} and class label Y={y1,…,yn},t={x1,…,xn} is a sample in S, the classifier predicts the class label of t by calculating probability. To overcome the limitation of conditional independent assumption, functional dependency is an important part of relational database, which represents the constraint relations among different attributes. Some existing research studies have found some similarities between relational database and probabilistic inference. Then we have:
In semi-supervised learning, as the joint likelihood of the labeled and unlabeled data is not in closed form, usual solutions to this would be to use expectation maximization (Chen and Zhao, 2014; Bishop, 2006). The algorithm initials model parameters from limited amount of labeled data and uses these to get probabilistic labels for each unlabeled sample in E-step. M-step gets the parameters using these labels for unlabeled instances. A regulating variable λ is used in the proposed method. This parameter moderates the unlabeled data by reduce the learning rate η and the weight of the unlabeled samples in step M. θt is current estimator of the model parameters. gives the count of feature in instance x. Conditional estimates of from labeled data improve the accuracy of Bayesian approach:
In the vehicular network data quality problem, the quality states of this deployment are adopted from the flagging scheme. There are flags associated with particular processing tasks. The quality flags are designed to indicate the level of uncertainty involved in the sensor reading. Sometimes, sensor readings associated with abnormal events may be incorrectly labeled. These labels belong to four different classes of the classification problem. The data that we used in the experiments were labeled into four classes:
good data;
probably good data;
bad data which are potentially correctable; and
bad data.
Figure 3 shows a labeled data series after separated into many pieces of length; thus, a long series of data can be evaluated for each period.
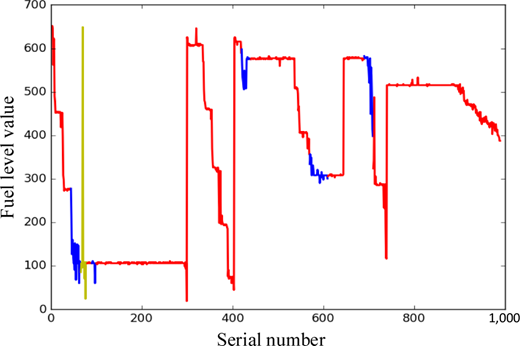
The blue lines denoted the probably good or bad curves, and the yellow one is series with bad flag.
This work presents our experiences for big data analytics based on a vehicular network big data testbed, in terms of sensors data management, multi-dimension data fusion and data quality assessment for the vehicular sensor data. In this section, we have investigated the problem of multidimensional analysis of vehicular network testbed data. Some statistical indicators are introduced and applied in data quality evaluation, and a novel classification-based framework is proposed to efficiently assess the data quality and screen out the abnormal vehicles in database. Our experiments on large real data sets show the feasibility and utility of proposed methods.
3. Routing and broadcasting methods in vehicular networks
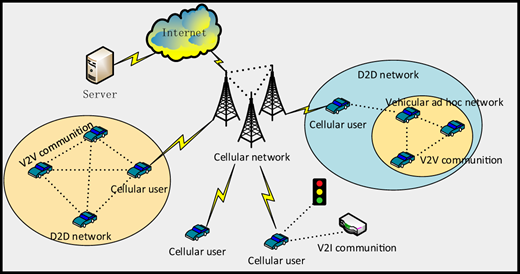
With the development of wireless communication technologies and increasing demand for high-data-rate communication, the integration of the cellular network with other access networks has become a popular trend. Device-to-device (D2D) communication is an example of an integrated network technology that appears to be a vital component in next generation communication technologies (5G). The D2D technology allows for direct message delivery between terminals that are near each other to lighten the load of node base stations, improve spectral reuse and enhance system capacity. Therefore, mobile ad hoc networks (MANETs) are expected to be popularized in the future based on D2D communication (Mumtaz et al., 2015). VANETs, as a special application of MANETs in transportation, have attracted increasing academic and industry attention in recent years. These networks can help to realize a variety of vehicular safety and intelligent applications, such as cooperative collision avoidance, road obstacle warning, self-adapted cruise control system, multimedia streaming and other telematics services (Panichpapiboon and Pattara-Atikom, 2012). Nevertheless, VANETs have a highly dynamic characteristic due to the fast movement of vehicles, which results in a number of great challenges such as dynamic network topology, frequent disconnections, changing node density, and a lack of centralized control. For example, the urban road net is a complex network system. The vehicle’s movement appears as a frequent entrance and departure to the area networks, which results in a lack of instantaneous end-to-end paths; hence, the VANET is considered as a type of delay and disruption-tolerant networks (DTNs). As a common phenomenon in large cities, traffic congestion causes the vehicular network to become very dense, which has an influence on the subsequent data dissemination. In addition, traffic scenes or phenomena such as freeways, platoons or cluster driving and tide traffic may lead to many specific network changing modes. The integrated vehicular network is shown in Figure 4, including internet, cellular network and D2D networks.
As the high mobility of vehicles leads to increased uncertainty in the opportunistic transmission between vehicles, many of the traditional MANET routing protocols and message dissemination models that depend on the maintenance of an end-to-end transmission path are no longer suitable for VANETs. Therefore, the development of a feasible and efficient broadcasting mechanism for message dissemination is necessary. The fundamental ability of any kind of communication network is the transportation or routing of data from a source to a destination. Communication paths determine the communication quality and transmission delay to a great extent. Routing is the process to select the best communication paths in a network. There has been much research concerning the optimal routing methods in ad hoc networks. The simplest approach may be to let the source or a moving relay node carry or retransmit the message to the destination. A suitable method to perform routing in delay tolerant networks is epidemic routing through use of the “store-carry-forward” mechanism. This mechanism is referred to as an epidemic broadcast, as an analogy of the transmitting behavior of viruses.
In epidemic broadcasts, messages are spread among nodes. When a node with a message labeled as an infected node contacts other nodes without a message, the infected node sends a copy of the message to those susceptible nodes. For more detail, a mobile node stores a message in its local memory after receiving this message from a source and carries the message along the movement path until the next hop moves into the communication range. Once it encounters another node, this infected node duplicates and forwards the copy to the new node. This “store-carry-forward” process will be repeated until the message is forwarded to the destination. In VANETs, every vehicle can be such a mobile infected node, and thus the information packet will be able to propagate from the source to the other distant vehicles. In a dense road scene, a continuous communication path without cellular network can be found, this message dissemination process is shown in Figure 5.
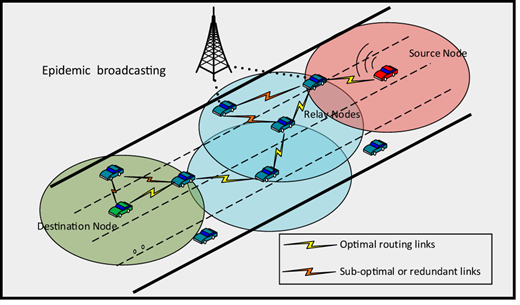
Epidemic-based message dissemination on the road
Epidemic-based message dissemination on the road
3.1 Epidemic broadcasting simulation based on a realistic traffic scene
Simulation is the predominant tool used in research related to VANET (Liu et al., 2009). We will discuss a simulation that was based on real-world road traffic conditions on the Nast Fourth Ring Road in Beijing (Figure 6). We performed a field survey and collected historical data from the East Fourth Ring Road to obtain reliable simulation parameters such as speed, density and congestion distribution. In Figure 6(a), the real-time traffic is colored in green, indicating that free-flow traffic conditions existed, where vehicles could travel at high speeds and at low densities. Under these conditions, drivers could arrive at their destinations within the prediction time. In Figure 6(b), the selected segment was mainly yellow, which indicated that traffic was moving at a relatively slower speed (approximately 45 km/h) and at densities on the middle level. In Figure 6(c), traffic congestion conditions were apparent, where both yellow and red sections were present on the selected segment. The red and yellow colors were distributed in two different directions on the road, where one direction was mainly yellow and the other direction was mainly red, indicating that vehicles were at low speeds and high densities.
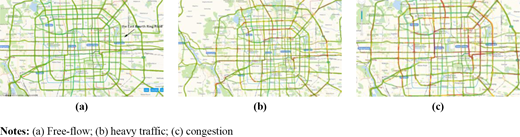
Distribution of traffic conditions in Beijing
Distribution of traffic conditions in Beijing
3.2 Simulation setting
We simulated the data packages broadcasting in three scenarios (i.e. the free-flow traffic, heavy traffic and congestion scenarios), according to the traffic state of a road section of the East Fourth Ring Road of Beijing. To simplify the simulation, we simulated the traffic in a single lane for both directions. The length of the section was 5 kilometers. Two devices were located at each end of the section: the source node, which could generate data packages and the destination node, which would receive the message. In each scenario, the simulation interval was 1 s and the time was 150 s. The source node generated data packages every 5 s. Two vehicles could communicate only when their distance was less than 150 meters. When two vehicles were within communication range, one vehicle copied its particular data packages and sent them to the other. If two vehicles had the same data packages, there were no packages transmitted between them. The lifetime of each copy was 60 s. In the free-flow, heavy traffic and congestion scenarios, we set the average speed at 70, 50 and 25 kilometers per hour, respectively, and the number of vehicles in a lane was set to be 50, 250 and 400, respectively.
3.3 Results and analysis
We used the aforementioned simulation setting to simulate the process of data package broadcasting. In each scenario, we performed the simulation ten times within the same simulation setting. Figure 7 shows the results of the number of copies versus the time variation in the three scenarios. Based on the results, the destination node in the congestion traffic condition could receive more copies than in the free-flow condition. This result was as expected because the vehicles density is high in the congestion condition; thus, the copies can be more easily relayed than in the non-congestion condition.
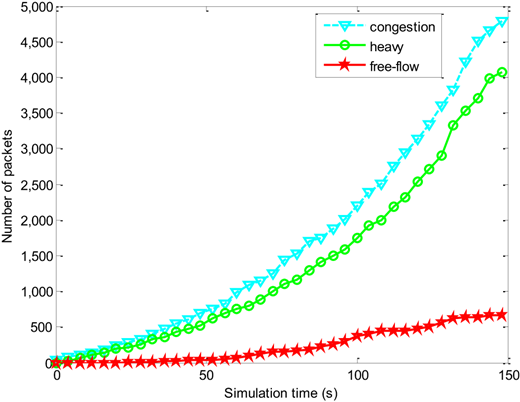
Distribution of the number of copies over the simulation times for different traffic conditions
Distribution of the number of copies over the simulation times for different traffic conditions
We also observed the number of relays for a copy before it arrived at the destination node. Figure 8 shows the results of the number of copies versus the number of relays in the three scenarios. Intuitively, more relays were required to send the message when the vehicle density was higher. The average number of relays in the three scenarios (free-flow, heavy and congestion) were 39.8, 47.5 and 49.7, respectively, which was considered to be reasonable. In addition, we observed the time taken by a copy to arrive at the destination node, as shown in Figure 6. The average times obtained from the three scenarios (free-flow, heavy and congestion) were 9.3, 11.3 and 9.5 s, respectively. The reasons why the average times in the free-flow and congestion scenarios were less than that in the heavy traffic scenarios were attributed to the high vehicle speed in the free-flow scenario and the high vehicle density in the congestion scenario, both of which benefited the message transmission. In addition, we observed that many copies could arrive at the destination once they were generated. In the free-flow and heavy traffic scenarios, approximately 70 per cent of the copies could arrive at the destination node within 10 s, whereas approximately 80 per cent could arrived in the congestion scenario. Nevertheless, some copied packets were unable to reach the destinations when the density of vehicles in the free-flow scenario was too low.
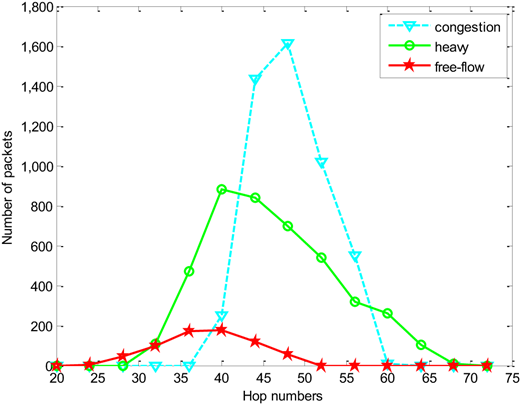
Relationship between the number of copies and the number of relays for different traffic conditions
Relationship between the number of copies and the number of relays for different traffic conditions
In the case study, we performed a broadcasting simulation based on real-road traffic conditions from the East Fourth Ring Road in Beijing, and observed that different vehicle densities can dramatically affect message transmission. Moreover, experiment results showed that when traffic conditions varied from free–flow to congestion, the number of message copies increased dramatically and the reachability was also improved. Nevertheless, the high network density may introduce other issues, such as the broadcast storm problem.
4. Vehicular positioning enhancement with connected vehicle
The availability of high-accuracy location-awareness is essential for a diverse set of vehicular applications including intelligent transportation systems, location-based services, navigation and a couple of emerging cooperative vehicle-infrastructure systems (Alam and Dempster, 2013). However, it still faces a big challenge in the areas with inconsistent availability of satellite networks, especially in dense urban areas where the standalone global navigation satellite systems (e.g. GPS).
To tackle the aforementioned problems, a new class of cooperative positioning (CP) methods that relies on V2V communications and data fusion filtering (Sayed et al., 2005; Win et al., 2011; Alam et al., 2012) has been presented in recent years, which can further improve the accuracy of positioning. Actually, such concern raised in CP is the reliability of the localization approaches in heavy multipath and NLOS scenarios, which is similar to that in indoor environment (Sayed et al., 2005; Gu et al., 2009). An exploration into CP from theoretical foundations to specific applications, including advanced technologies and cooperative algorithms was presented in Win et al. (2011). Several CP techniques have been proposed to achieve lane-level vehicular positioning using DSRC signals broadcasted by onboard both units (OBUs) and RSUs (Alam et al., 2012; Dao et al., 2007).
Because of the low speed of vehicles, the DFS is too difficult to be extracted from noise, and thus for DFS vehicular positioning methods, the STD of positioning error increases as the relative speed between the target vehicle (TV) and the other vehicles decreases. So we will investigate the method to overcome this problem. In this section, we will focus on the scenario that the neighbor vehicles travel in the opposite direction of the TV, for this case can provide obviously detectable Doppler effect.
4.1 Problem statement
The problem to be solved is to estimate the position of a TV moving on a 2D road, where there are many other neighbors around the TV. All of the vehicles are able to know their own state information, including position and velocity, provided by coarse GPS receiver, and they can know the neighbors’ state information via vehicular communications as well. Consequently, this case can be treated as a simple but practical CV scenario. A TV is considered as a research object for positioning enhancement based on CV, and a neighbor is considered as the vehicle who is within a certain communication range to the TV and travel in the opposite direction of the TV. Each vehicle is assumed to be with an offshore banking unit providing both the DSRC and the DFS measurements (Duan et al., 2015).
Considering the ith moving vehicle at time instantkwith a state vector ,i=1,…,np, where the and denote the ith vehicle’s position and velocity, respectively, n*p is the total number of the vehicles driving on the road and T is a transpose operator. The dynamic state can be modeled by the following system:
where is the state transition matrix, and is the noise distribution matrix. is the control vector and is zero-mean white Gaussian noise with covariance matrix .
For the dynamic model presented by equation (6), the following observation model can be defined:
where is a nonlinear observation vector in terms of θk. is the DFS of the received signal from the jth neighbor, j=1,…,n*k,nk<n*p, and nk is the total number of the neighbors on the road. Υk(re) is the observation noise that can be used to describe the M types of observation errors by assuming a set of another covariance matrixes. The transition among M types of the errors is generally modeled as a first-order M-state homogeneous Markov chain r*e, e=1,2,…,M.
Specifically, assuming that the DFS measurements from the OBU can be modeled in a derivative form of the DSRC carrier frequency, f, as follows:
where c is the speed of light, is the relative distance between the TV and its neighbor j and is the DFS observation noise of neighbor j.where and is the position and velocity vector of the neighbor j. To solve this nonlinear observation function, with the first-order Taylor expansion of (8) around an arbitrary state vector, h can be transformed to a fixed form of matrix, in which all of the components are supposed to obtain from both the GPS and OBU. As a result, the observation model of the TV can be reformulated as a linear one:
with the observation transition matrix Hk.
Based on the aforementioned models from equation (6) and (9), it is reasonable to assume that and in the system model are invariable at both each time instant and vehicle. Therefore, the position estimation of the TV can be formulated as the problem of linear filtering for M-state jump Markov systems and the model can be simplified as:
Because H*k can be estimated by data fusion from both the GPS and OBU at each time instant k, a CV-enhanced interacting multiple model extended Kalman filter (IMM-EKF) can be deployed.
4.2 Connected vehicles-enhanced interacting multiple model extended Kalman filtering for vehicular postioning
4.2.1 Mixing probabilities and state estimates:
where μk+1,s|t is known as the mixing probability in the IMM estimator, μk,s is the probability of the event that the sth motion model is in effect at time step k, s,t=1,2,…,M, correspond to the s,tth mode of the Markov chain re and c*t is a normalization constant:
4.2.2 Mode update and prediction steps:
The CV-IMM-EKF advanced prediction is given by:
The State prediction error covariance matrix is as follows:
From the previous data, the CV-IMM-EKF gain is given by:
where φk(N) and re(N) are functions of N and can change the dimension of the observation transition matrix H*k and the covariance matrix Rk, respectively.
The CV-IMM-EKF update steps are given by:
The CV-IMM-EKF prediction steps are given by:
4.2.3 Estimates combination:
4.3 Numerical study
A basic set with N neighbors for the TV can be formed through Algorithm CV-IMM-EKF. Considering a section of urban roads, which is with a width of four lanes (each one is 3.5m wide) and a length of 1 kilometer. It is assumed that the traffic density of the road section is 20vehicies/km and the average speed of traffic is generated stochastically in duration from 50km/h to 60km/h following a uniform distribution.
The noise vector , with covariance matrix where the elements and are the acceleration noises along the x and y-axis, respectively, with STD in m/s2. The covariance matrix R(r*e) of observation noise Υk(re)∼N(0,R(r*e)) is described as a first-order Markov chain switching between two models and , of which the elements are with STDs in units of m,m/s2 and Hz. The transition probability for this Markov chain is , and their initial probability is . According to the achievable performance discussed in Alam and Dempster (2013) and Tian et al. (2015), as the number of the neighbors is increasing, the performance enhancement can be less obvious and lead to more additionally computational burden.
Therefore, we set N=4, which is a relatively conservative number of the neighbors for the basic set, which is mentioned in algorithm CV-IMM-EKF.
In the simulations, the sampling period and length are taken to be 0.2 and 100, respectively, and the communication range of the DSRC is 300 m. As the DFS measurements presented in Tian et al. (2015) and Schmidl and Cox (1997), the probability density function (PDF) of the DFS is approximately zero-mean asymmetric Gaussian with the left and right STDs of 100 and 120Hz, when the vehicles travel at the speed of 60km/h, broadcasting the DSRC packets with a frequency of 5.89GHz and a rate of 100packets. It is worth noting that the PDF of the DFS remains a fairly consistent estimation from LOS to NLOS. Considering the noise of the DFS measurements as zero-mean Gaussian with two states of STDs: σw*N(r1)=100Hz and σwN(r2)=120Hz. Specifically, the state of the observation noise remains unchanged in r1 between 0 and 6 s, and changes in the following 10 s to r2. Finally, the state changes back to r1 for another 4 s. The position and velocity measured by GPS are assumed to be added noise with the variance and , respectively.
To quantify the performance of the proposed approach, the root mean square error (RMSE) of vehicular positioning is calculated to assess the closeness of the estimated trajectory (p^x,k,p^y,k) to the true trajectory (p*x,k,py,k) at each time instant over N*m=500 Monte Carlo simulations. In equation (28), (p^x,k(m), p^y,k(m)) denotes the estimated position vector in the mth Monte Carlo run at the kth step:
The performance comparison between the proposed CV-IMM-EKF and the GPS-only approach is shown in Figure 10 with respect to the RMSE in distance. It is obvious that the proposed CV-IMM-EKF method outperforms the GPS alone localization. To indicate the enhancement of vehicular positioning of the proposed approach, the enhancement indicator μ is calculated as follows:
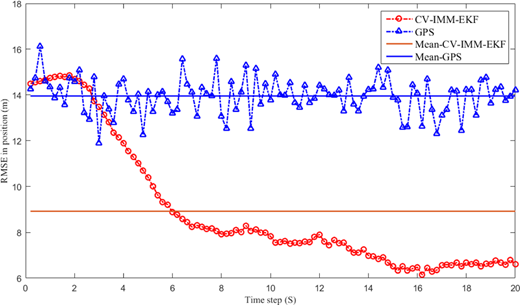
CV-IMM-EKF and GPS performance in positioning error
CV-IMM-EKF and GPS performance in positioning error
The enhancement of vehicular positioning is shown in Table I. Compared to the GPS-based localization, the proposed CV-IMM-EKF approach achieves the enhancement of μ=35.59per cent.
If AR*MSE is better than BR*MSE, μ will be greater than 0. The increase of μ is link to the good performance of AR*MSE. By describing the transition of the measurement noise as a first-order M-state jump Markov chain, the proposed CV-IMM-EKF approach has been proved to achieve better performance in a scenario that is similar to a practical one.
5. Conclusions
In this paper, we discuss three applications of intelligent computing in vehicular networks and their performance and effect is better. In vehicular networks, based on the intelligent computing, multidimensional analysis of vehicular network testbed data, the number of message copies increased dramatically, and the reachability and vehicular positioning enhancement have been improved. So the application of intelligent computing in the vehicle network system will be more extensive, and the computing intelligence will be an important technical means of car networking and improve the development of the car networking system.
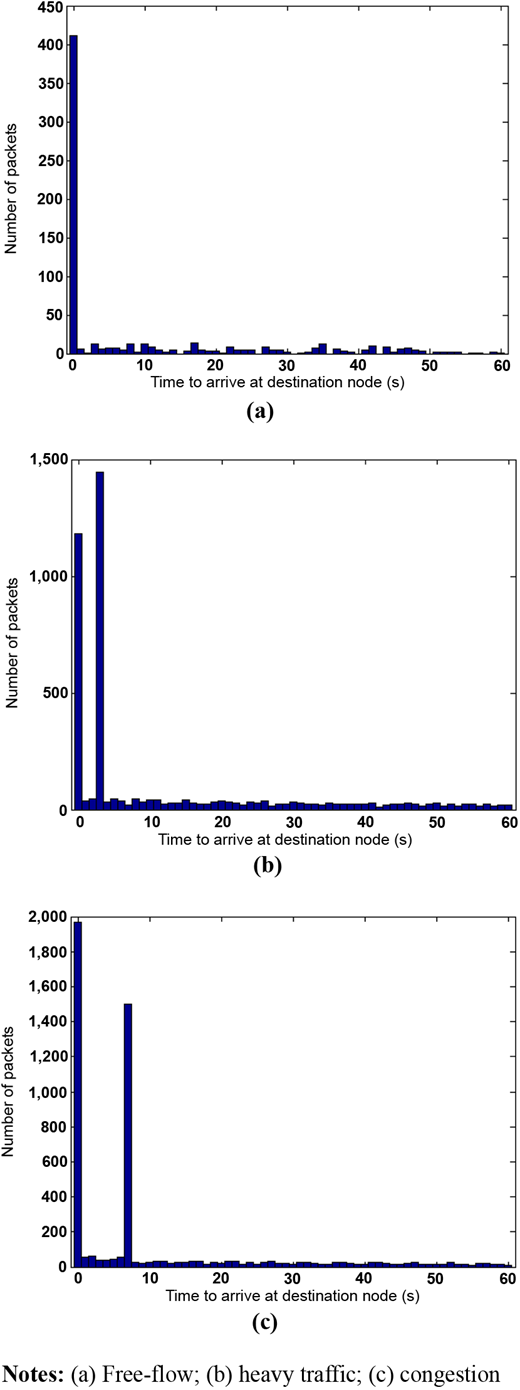
Relationship between the number of copies and the time required for the copy to arrive at the destination node in different traffic condition scenarios
Relationship between the number of copies and the time required for the copy to arrive at the destination node in different traffic condition scenarios
This research was supported in part by the National Natural Science Foundation of China under Grant Nos. 61672082, U1564212.

