This paper aims to explore the spatio-temporal patterns of Chinese foreign direct investment (FDI) since the inception of the Belt and Road Initiative (BRI) in 2013 as an extended version of geographically weighted regression.
The panel data are used to examine spatial and temporal dynamics of the magnitude and the direction of China's outward FDI stock and its flow from 2011 to 2015 at a country level. Using the geographically and temporally weighted regression (GTWR), spatio-temporal distribution of FDI is explained through Logistic Performance Index, the size of gross domestic product (GDP), Shipping Linear Connectivity Index and Container Port Throughput.
A comparative analysis between participating and non-participating countries in the BRI shows that the size of GDP and Container Port Throughput of the participating countries have a positive effect on the increases of China's outward FDI Stock to Asia especially after 2013, while non-participating countries, such as North America, Western Europe and Western Africa, have no significant effect on it before and after the implementation of the BRI.
The findings, however, will not necessarily provide insight into the needs of China's outward FDI in certain countries to develop their economy. The findings provide the evidence to inform policy making to help identify the winners and losers of the investment, scale and direction of investment and the key drivers that shape the distributive investment patterns globally.
The study provides the empirical evidence to inform investment policy and strategic realignment by quantifying scale, direction and drivers that shape the spatio-temporal shifts of China's FDI.
The analysis also guides the Chinese government improve bilateral trade, build infrastructure and business partnerships with preferential countries participating in the BRI.
There is an urgent need to adopt a new perspective to unfold the spatial temporal complexity of FDI that incorporates space and time dependencies, and the drivers of the situated context to model their effects on FDI. The model is based on GTWR and an extended geographically weighted regression (GWR) allowing the simultaneous analysis of spatial and temporal decencies of exploratory variables.
1. Introduction
The Belt and Road Initiative (BRI) is a strategy that was formally launched in 2013 by the Chinese President Xi Jinping. The vision of the BRI is to enhance connectivity between China and Europe by constructing better infrastructure (Yang et al., 2022). At the beginning, China's outward FDI flows in 2009 was USD48bn (Zhang and Daly, 2011) and in 2022, China's outward FDI Flow reached to a USD149bn (OECD, 2023). One of the arguments gaining momentum in recent media commentaries is that the BRI could be used as an instrument to reconfigure the investment landscape of Chinese foreign direct investment (FDI). Some commentators argue that the BRI could lead to an increase in Chinese FDI in participating countries (Üre et al., 2023; Zou et al., 2022). There are limited studies that examined the regional patterns of Chinese FDI by applying econometric methods to model the drivers of the variability in FDI over time (Zhang and Daly, 2011; Coughlin and Segev, 2000). Typically, these studies have used regions or countries as a unit of analysis to differentiate the growth patterns of FDI. There are also studies that examined these patterns using panel techniques which explored temporal variability in FDI across regions or countries (Coughlin and Segev (2000), Khadaroo and Seetanah (2010), Kalotay and Sulstarova (2010), Vadlamannati et al., 2009; Zhang and Daly 2011). However, there are no major studies that have incorporated spatial and temporal dependencies in modelling the growth patterns of FDI at a country level. Inflow pattern of FDI is dynamic; thus it is space and time dependent (Coughlin and Segev, 1999; Zhao et al., 2012). It is important to consider these dependencies to ensure the validity and reliability of statistical models and results.
Moreover, spatial-economic structures and the spatial contiguity factor influence investment decisions in foreign countries. Examples of spatial-economic structures are the size of the gross domestic product (GDP), the logistics infrastructure and the connectivity with global supply chains, all of which directly impact the location choices for FDI to increase the likelihood of a higher return on investment. The spatial contiguity factor reflects the spatial adjacency effect, in which the likelihood of two adjacent countries receiving FDI is more significant than those far apart. The BRI is another critical factor that drives geostrategic trade partnerships between China and the participating countries, which include 44 nations in Sub-Saharan Africa, 35 nations in Europe and Central Asia, 25 nations in East Asia and the Pacific, 21 nations in Latin America and the Caribbean, 18 nations in the Middle East and North Africa, and 6 nations in South East Asia (Yang et al., 2022). It may affect the country's FDI decision-making. The apparent assumption is that BRI member countries (e.g. Southeast Asia, South Asia, etc.) that have demonstrated allegiance through alliance are likelier than non-members to receive an increase in FDI.
Though there are innumerable studies (Chaplyuk et al., 2022; Ingale et al., 2023) that have explored the distribution and drivers of FDI, yet there is a lack of study that theorise location choices of FDI by the Chinese Government using a spatio-temporal theoretical perspective. There is an urgent need to adopt a new perspective to unfold the spatial temporal complexity of FDI that incorporates space and time dependencies, and the drivers of the situated context to model their effects on FDI. The model is based on geographically and temporally weighted regression (GTWR) and an extended geographically weighted regression (GWR), allowing simultaneous spatial and temporal analysis of exploratory variables. GTWR is applied to panel data of China's outward FDI Stock and FDI Flow from 2011 to 2015 to investigate spatial and temporal trends of the magnitude and direction of the dominant variables at the country level. The GTWR was developed to address a spatial and temporal effect. In the model, the Logistic Performance Index, the GDP size, the Shipping Linear Connectivity Index, and the Container Port Throughput are the primary determinants of the FDI Stock and Flow. In the context of the BRI, a comparison is made between participating and non-participating countries to examine the differences in the size and direction of FDI.
The remainder of the paper's structure is as follows: The subsequent section reviews previous research on BRI and FDI factors. The third section describes the research methodology, which includes the study area, the data employed, and the methods used. Section 4 then explains and discusses the modelling results. The paper's final section discusses this research's essential findings and limitations.
2. Literature review
FDI is significant in driving economic growth, making it a crucial factor in national development, particularly in developing (Kim et al., 2003; Pekarskiene and Susniene, 2015; Sen et al., 2014). FDI acts as a crucial innovation catalyst at the regional level in developing. Its multiplier effects such as growth, employment, technology transfer, industry competitiveness, infrastructure development, and government revenues, are found to generate economic stability and achieve targeted economic growth in developing countries (Narantuya et al., 2022; Nguyen et al., 2022; Sohail and Li, 2023). Historically, there have been substantial FDI flows from developed to developing nations. Deregulation of trade and globalisation have accelerated this relatively unrestricted flow of FDI between countries and influenced its direction, magnitude and temporal dynamics. Deregulation of trade and globalisation, for instance, have created new markets for businesses, encouraging them to invest abroad to gain access to larger consumer bases. In contrast, a different body of research (Agbloyor et al., 2013, 2014; Raza and Jawaid, 2014) indicates that FDI may also be detrimental to economic growth and regional development.
Logistics infrastructure is crucial for attracting and facilitating FDI. A well-developed logistics infrastructure is essential for FDI because it ensures efficient supply chain management, improves connectivity and accessibility, supports just-in-time manufacturing, enables distribution and market access, facilitates international trade, and promotes cost efficiency. These factors create a favourable investment climate and entice foreign firms to invest in specific countries. Most studies (Ellyne and Yu, 2017; Lee et al., 2018; Li et al., 2018; Tsagkanos et al., 2019) investigated the connections between FDI and economic, financial, demographic, political and social indicators. However, few empirical studies (Li et al., 2018; Liang and Liu, 2020; Üre et al., 2023) connect FDI to logistics performance indicators. It is crucial to comprehend this relationship, as FDI seeks to promote logistics infrastructure to increase trade through enhanced transport connectivity. It is a crucial deciding factor for infrastructure investment projects in the countries along the Belt and Road such as Pakistan, Nepal, Sri Lanka, Bangladesh and Afghanistan. FDI is significantly influenced by macroeconomic indicators such as GDP size and GDP per capita. Multiple studies demonstrate a positive correlation between GDP and FDI (Boateng et al., 2015; Chakraborty and Basu, 2002; Kalotay and Sulstarova, 2010; Singhania and Gupta, 2011; Tang et al., 2014).
In the context of the BRI, logistics services and infrastructure are indispensable for establishing connectivity. FDI is crucial in promoting economic growth and regional development, so their promotion is crucial (Lee et al., 2022). According to Khan et al. (2017), there is a strong relationship between FDI inflows and the logistics industry's expertise and infrastructure. Their research indicates that improved logistics performance will likely attract more FDI. Forte and Santos (2015) observed similar results in Latin American countries such as Chile, Panama, Uruguay and Costa Rica, where improved logistics performance influenced FDI inflows positively. Recent research by Lee et al. (2022), Li et al. (2018), Palit (2017) and Heng and Po (2017) supports this hypothesis, highlighting the role of logistics performance in driving economic growth not only in China but also in several developing countries.
Medda and Caschili (2015) have developed a structural equation model to examine the association between port infrastructure attractiveness and investment. According to their research, the port attractiveness index influences investment strategies in African ports, which include factors such as adequate infrastructure, port location, port fees and port administration/efficiency. This finding is supported by Cho et al. (2015) in Korea case study, which indicates that an improved logistics infrastructure increases Korea's global market competitiveness and investment. Negara (2012) also confirms the significant positive relationship between logistics network connectivity (land, maritime and air connectivity) and public-private partnerships in ASEAN and India. Unver (2016) also found a correlation between liner shipping connectivity and FDI levels. Connectivity facilitates economic integration within and across regions (Negara, 2012; Patalinghug, 2015). However, as a policy instrument, FDI aims to improve the logistics efficiency of countries with less developed infrastructure and services through strategic investments. If Chinese FDI flows directly to regions with superior logistics infrastructure, the policy of FDI-driven economic development's broader goals and planning objectives can be questioned. Therefore, logistics infrastructure and services are crucial to investment decisions.
The extant of knowledge in this field demonstrates that FDI inflows are frequently directed toward countries with a larger GDP and better logistics infrastructure (Unver, 2016). With increased globalisation and the construction of infrastructure to connect nations, examining whether the spatial relationship between nations influences investment decisions is essential. For instance, a country with high logistics performance surrounded by countries with low logistics performance is equally attractive to FDI as a country with high logistics performance surrounded by countries with high logistics performance (Üre et al., 2023). Spatial spillover effects influence both economic growth and regional development. In comparison to countries with deteriorating infrastructure (e.g. certain regions of Africa and Asia), spatially concentrated nations with a robust logistics infrastructure (e.g. Western Europe) are desirable destinations for FDI (Adhikary, 2011; Ellyne and Yu, 2017). However, these arguments require other policy debates and academic scrutiny.
The current body of knowledge is primarily limited to econometric analysis, with macroeconomic variables predominantly used to predict FDI Flows at the aggregate level. Neither space nor time was explicitly accounted for in explaining the global distribution patterns of FDI from China. Theoretically, spatial and temporal dependence is crucial for establishing the context in which the spatial dynamics of FDI behave within a globalised and interconnected global economic system.
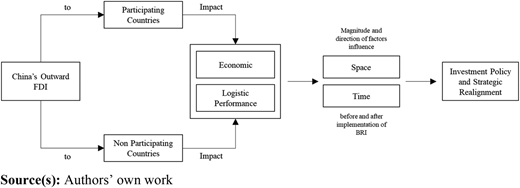
Figure 1 depicts the temporal and spatial effects of China's Outward FDI on the economic and logistics performance variables of participating and non-participating nations. The magnitude and direction of factors influencing China's Outward FDI may vary at various times and locations. Foreign direct investment affects investment policy and strategic realignment.
This literature review reveals that the relationship between FDI, the dependent variable, and economic and infrastructure factors, the independent variables, is significant, e.g. economic size (e.g. GDP, GDP per capita), labour productivity, coastal location, wages, illiteracy rates and transportation infrastructure, were established by regression models (Chaplyuk et al., 2022; Kalotay and Sulstarova, 2010), time series analysis (Ingale et al., 2023; Mugableh, 2015; Singhania and Gupta, 2011), auto regressive integrated moving average (Singhania and Gupta, 2011), generalised autoregressive conditional heteroskedasticity (Ang, 2008), structural cointegration model (Chakraborty and Basu, 2002) and panel data analysis (Zhang and Daly, 2011). Although the significance of temporal and spatial dimensions in the model has been widely acknowledged, their incorporation into modelling has received relatively little attention. Emerging methods such as GTWR will permit the development of a new methodological framework to demonstrate how FDI is influenced by time, place and other economic factors. Few studies have investigated the impact of logistics performance and connectivity on FDI inflow in the context of BRI. In other words, none of these studies have modelled FDI using spatial techniques. GTWR could be utilised to address a portion of these limitations.
The variables and methods used to establish their relationships with FDI are summarised in Table 1. Typical independent variables include GDP, market size, inflation rate and trade openness, as shown in Table 1. Few studies have examined the role of space and time in FDI from a modelling standpoint. Using panel data, the majority of studies (Erdogan and Unver, 2015; Ingale et al., 2023; Unver, 2016; Zhang and Daly, 2011) have developed either econometric or time series models. In addition, the studies do not include quantification or visualisation of the localised effects of these independent variables, which would accurately illustrate their varying influences on FDI inflows at the local level. Most of these are global econometric models that estimate the coefficients between FDI and its explanatory variables.
Existing models of FDI have neglected the spatial and temporal aspects. These models have predominantly focused on socio-economic factors as drivers of FDI Outward, disregarding the significance of space and time. Notably, variables such as economic conditions, political environment, institutions and human capital have received attention in analysing FDI drivers. This study addresses these gaps by introducing a model that considers the interplay between space, time and specifically emphasises the role of logistic infrastructures.
3. Method and data
3.1 Method
To define GTWR, it is important to describe the traditional regression technique and the generic GWR. Ordinary least square (OLS) is a common regression technique for analysing the relationship between a predictor and explanatory variables. This technique involves modelling the dependent variable as a linear function of a set of explanatory variables (Fotheringham et al., 1997, 1998, 2003), as follows:
where is the observation at location of dependent variable (i.e. FDI Flow for model 1 and FDI Stock for model 2), represents the observation at location of the k th independent variable, and the s are independent normally distributed error terms with zero means. The coefficient associated with the th independent variable is denoted by . It is determined from an -observations sample. Typically, the least squares method is used to estimate the s; this can be expressed using matrix notation as follows:
where the independent observations are the columns of , and the dependent observations are the single column vector . The vector contains the coefficient estimates.
The GWR is an extension of the OLS technique that considers local variations so that the estimated coefficients are unique to a location (Fotheringham et al., 2003). They are not global estimates according to OLS modelling. According to Fotheringham et al. (2003), the following is the model's formulation:
where represents th parameter's value at location . Here, Equation (1) is a particular case of (3) in which all coefficient estimates are constant across space (Fotheringham et al., 1997, 2003). Using the GWR for , the parameters can be estimated as follows:
where is an x diagonal matrix whose elements denote the geographical weighting of observation data for observation at location . Fotheringham et al. (2003) shows that the weight matrix, , is computed for each because the weight matrix in GWR represents the different degree of importance of each individual observation in the dataset. Fotheringham et al. (2003) notes that the weight matrix, , denotes the connectivity between observations. The closer is the observation to location s, the greater is the weight and vice versa. Each location, thus, has a unique weight matrix.
When data points are collected across time and space at a specific set of locations (s, t), the GWR model in equation (3) is then modified into GTWR. The model of GTWR is formulated as follows:
where represents the value of the th parameter at location observed at time period .
However, the difference between GWR and GTWR lies in the weight matrix W(s,t), which is constructed differently to account for spatial and temporal effects (Fotheringham et al., 2015). Similar to GWR, the GTWR model typically estimates parameters in the presence of presumably interdependent variables. This process requires an analysis to define the interdependence form and limits and to formalise the influence of one location on another during a lag time (Wallace and Wallace, 1983; Wrenn and Sam, 2014).
3.2 Data used
The purpose of this study is to primarily examine the impact of the BRI during its initial implementation in 2013 by gathering data from the period spanning 2011 to 2015. From the 2015 Statistical Bulletin of China's Outward FDI, this study gathered data from 244 countries relating to 2011 and 2015. FDI is represented by two dependent variables: FDI Stock and FDI Flow. FDI Stocks measure the total value of the direct investments at a specific point in time, typically the end of a quarter or a year (Beugelsdijk et al., 2010; OECD, 2020). The outward FDI Stock is the value of resident investors' equity and net loans to foreign enterprises (Alfaro et al., 2004; OECD, 2020). FDI Flows are the value of international transactions associated with direct investment at a given time (Yeyati et al., 2007; OECD, 2020). Outward flows are transactions that increase the investments made by investors in the reporting economy in enterprises in foreign economies. FDI Stock displays the investment position at a particular time (such as the year's or quarter's end) (OECD, 2020), while Flows indicate a country's allure, they are not the only factor to consider.
Using FDI Stock and FDI Flow, this study investigates the spatial-temporal patterns caused by certain explanatory variables, such as GDP, Logistic Performance Index, etc. The country-level FDI Stock and Flow panel data from 2011 to 2015 were used as explanatory variables. As macroeconomic indicators, GDP and GDP per capita were used. Lead Time to Export (DURS), Efficiency of Customs Clearance Process (CUST), Quality of Trade and Transport-related Infrastructure (INFR), Ease of Arranging Competitively Priced Shipments (ITRN), Competence and Quality of Logistic Services (LOGS), Frequency with which shipments reach consignee within scheduled or expected time (TIME), Ability to Track and Trace Consignments (TRAC), and Total Logistic Performance Index (OVRL) are logistics performance variables (Beysenbaev and Dus, 2020). These variables are measured on a scale from 1 to 5, with 5 representing the highest performance and 1 the lowest. The variable air freight, represented by AF, is the number of containers delivered via air transport. The variables Shipping Liner Connectivity Index (LINSIP) and Container Port Throughput (CONTP) are also utilised.
In addition, these variables serve as surrogates for the infrastructure's capacity to handle the freight volume. The variable OPEN is used to represent international trade openness. It is the ratio between the total value of exports and imports and the GDP (Fujii, 2019). The intersection dummy variable of BRI, denoted by BRI, indicates the participating and non-participating member nations. The variables used in the FDI Flow and FDI Stock model are listed in Table 2.
4. Results and findings
Results and findings are presented in two sections. The first section investigates FDI's spatial and temporal patterns across various geographical units. In the second section of the analysis, the outcomes of statistical models are presented. Specifically, traditional OLS models were used to analyse the data points and determine the correlation between China's outbound FDI and various spatial variables associated with economic characteristics, logistics performance and BRI membership.
4.1 Spatial-temporal analytics of FDI
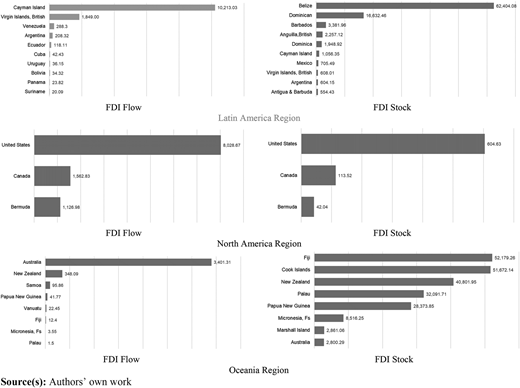
The mean of China's outward FDI Stock and Flow in each region is displayed in Table 3. From 2011 to 2015, China's Stock and Flow of FDI outward increased in East Asia, the Pacific region and North America. In contrast, China's outward FDI Stock in Europe, Central Asia and Sub-Saharan Africa has decreased from 2011 to 2015, while China's outward FDI Flow has increased in these regions. China's FDI Stock and Flow in South Asia have increased post-BRI. China has invested heavily in Pakistan, Nepal, Bangladesh and Sri Lanka. In contrast, China's outward FDI Stock has decreased in the post-BRI period in the Middle East, Latin America and North Africa.
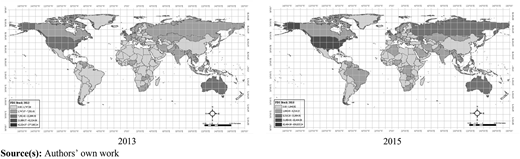
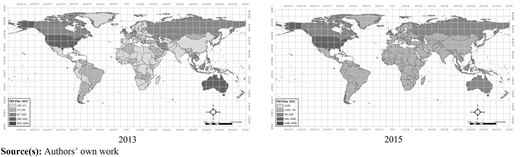
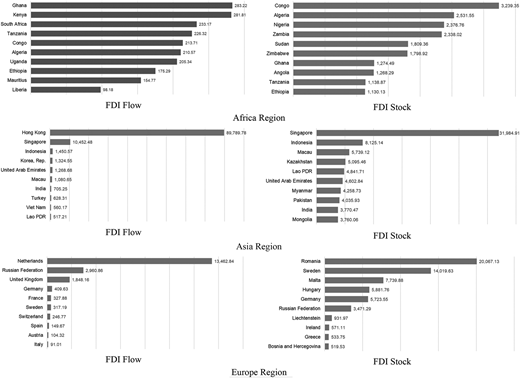
The maps of China's outward FDI Stock and Flow are depicted in Figures 2 and 3, respectively. These figures indicate that the FDI Stock and Flow of countries participating in the BRI have significantly shifted. Figure 4 depicts the countries where China's outward FDI Stock and Flow were most valuable in 2015. From 2011 to 2015, Hongkong, the Netherlands, Singapore, the United States, Australia and Russia were the top six recipients of China's FDI Flow and Stock. Next, a regression model is used to identify the primary drivers of China's FDI outward.
4.2 Results of ordinary least square (OLS) model
This section presents the results of a multivariate linear OLS model that estimates the impact of various independent variables on China's outward FDI Stock. Table 4 summarises the OLS results, which indicate that GDP and Container Port Throughput significantly influence China's outward FDI Flow (significant level of 0.1).
Table 5 displays diagnostic statistics for each model. The FDI Stock model received a significant F-value of 22.41 from the ANOVA. The Wald statistic has a chi-square value of 73.8, which is significant. The F-value for the FDI Flow model is 11.65, and the Wald statistic is 48.91. It indicates that FDI Stock and FDI Flow models are statistically significant.
The Jarque–Bera statistic yielded a significant chi-square value, indicating that the model's prediction is not biased (i.e. the residuals have a normal distribution). Statistically, however, the chi-squared values of the Koenker Statistic are insignificant. It suggests that the relationship between some or all of the independent variables and the criterion variable varies across the study area. It also indicates that some independent variables can predict China's outward FDI (Stock/Flow) in some countries but not others. Therefore, OLS exhibits poor predictive ability.
The OLS results suggest that the size of the global GDP and Container Port Throughput substantially influences China's outward FDI Stock and Flow. Other variables, including Logistics Performance Index, Openess and Shipping Linear Connectivity Index, are less likely to significantly impact China's outward FDI. Stock and Flow variables of the Logistics Performance Index negatively affect China's outward FDI. In other words, China's foreign direct investment targets countries with less developed logistics infrastructures.
4.3 Geographical and temporal weighted regression
The GTWR produced significantly superior results for all tested variable combinations, regardless of whether a full or reduced model was utilised. Comparing all models with their AIC values reveals that the GTWR model with total variable combinations outperforms global estimates. It decreased from 33550.7 to 32531.9 for China's outward FDI Stock model and from 27908.4 to 26920.9 for China's outward FDI Flow model. The R2 represents the proportion of the variance of the explanatory variable in the model, and the GTWR model can account for approximately 70% of the variance of the explanatory variables. It enhanced the predictive ability of the models by accounting for the variance not accounted for by the OLS model (See Table 6).
4.4 Results of geographically and temporally weighted regression
4.4.1 Parameter estimation
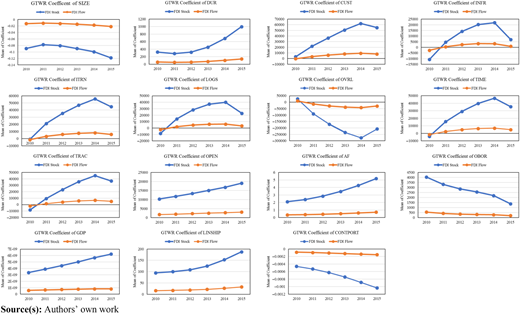
The GTWR model's local parameter estimates vary in space and time. From 2010 to 2015, Table 7 provides descriptive statistics for parameter estimates of the GTWR model with a fixed kernel function. Figure 5 demonstrates that most predictive variable coefficients have changed significantly over time for both the FDI Stock and Flow models. SIZE, BRI and CONTP coefficients have decreased over time in the FDI Stock model, while other coefficients have increased. It indicates that variables such as SIZE, BRI and CONTP harm China's FDI Stock abroad. In the FDI Flow model, the coefficients of the same explanatory variables, including SIZE, GDP, BRI and CONTP, have similar adverse effects on China's outward FDI Flow between 2010 and 2015.
4.4.2 Visualisation of parameter estimates
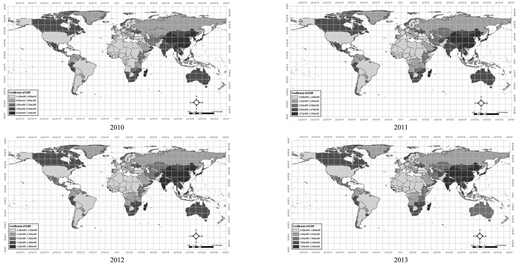
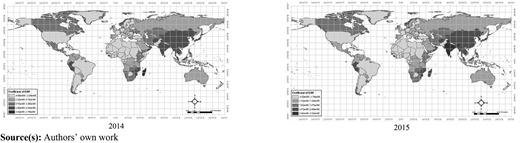
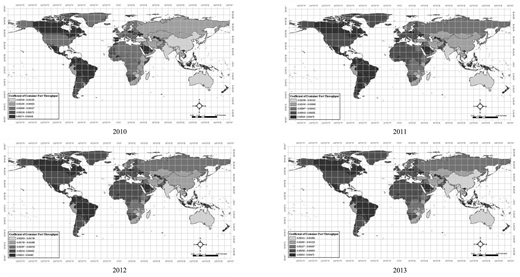
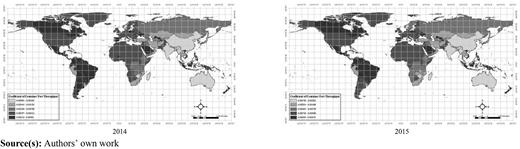
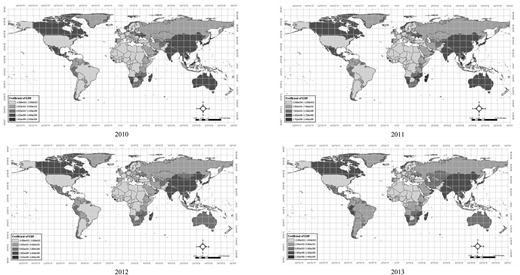
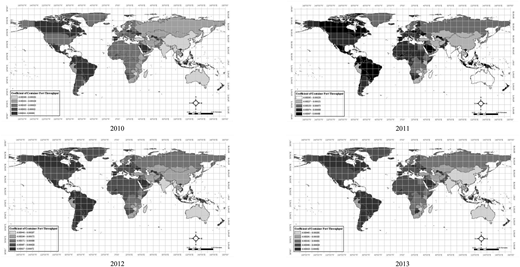
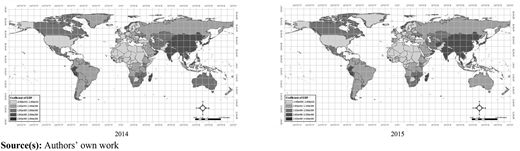
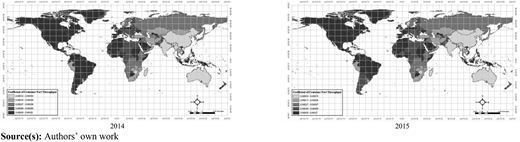
The GTWR allows for visualising parameter estimates for all explanatory variables across time and space. Utilising these mapped results reveals the complexity of these spatially variable effects of explanatory variables on China's Stock and Flow of outward FDI. The maps illustrate spatial and temporal variations in the global relationship between China's outward FDI (Flow and Stock) and key spatial variables (such as GDP and Container Port Throughput). GTWR reveals spatial and temporal effects of a particular variable on FDI that would not have been detected using OLS. A positive coefficient indicates that an increase in an explanatory variable leads to an increase in China's outward FDI for a particular location, while a negative coefficient indicates the opposite. Figures 6 through 9 illustrate the estimated local coefficients for statistically significant variables, specifically GDP and Container Port Throughput. Colour-coded thematic maps illustrate the magnitude of these variables' impact on China's FDI Stock and Flow. The regions with darker shades are those in which this specific variable strongly influences FDI, whereas the regions with lighter shades have a weaker influence.
Figure 6 illustrates the spatial variation in the effect of China's GDP on its FDI Stock from 2011 to 2015. The map identifies the western African regions with the highest negative values, indicating that a lower GDP increases the likelihood of attracting greater Chinese FDI Stock. The map also displays areas with high positive values in Asia, indicating that the greater China's outward FDI Stock, the higher the GDP. With few exceptions, the magnitude of the effect of China's GDP on its outward FDI increases from Asia and Australia to Africa. In terms of temporal variation, the map reveals that the magnitude of the effect of China's GDP on its FDI outward varies from 2010 to 2015. During this period, the impact of South East Asian countries' GDP, such as Indonesia, Malaysia, Thailand, Vietnam, Cambodia and Lao PDR, on China's outward FDI Stock has diminished.
From 2010 to 2015, the impact of North African nations such as Egypt, Morocco and Libya on China's outward FDI Stock increased. Before and after implementing the BRI in 2013, the effect of GDP on China's outward FDI Stock changed significantly, particularly in South East Asia and North Africa. China's outward FDI Stock to Egypt is experiencing a decrease in the effect of Egypt's GDP growth, whereas China's outward FDI Stock to South East Asia has increased, while the region's GDP has also increased over the period. Before and after implementing the BRI, the effect of GDP on China's outward FDI Stock in North and South America did not change significantly. It could be because neither North nor South America is a member of BRI.
As shown in Figure 7, Container Port Throughput had a significant negative impact in Asia from 2011 to 2015. Except for South Asia (including Pakistan, Bangladesh, Sri Lanka, and Maldives) and South East Asia (including Thailand and Malaysia), the impact of container throughput on FDI remained relatively constant. After 2013, these nations experienced a slight decline. Container Port Throughput, on the other hand, positively impacts China's outward FDI stock in Indonesia and the Philippines. This year, Container Port Throughput value has had no significant effect on FDI in Arabian countries, the United States, Australia and most Latin American nations.
Similar to the results of GTWR on China's outward FDI Stock, two variables significantly affect China's outward FDI Flow: GDP and Container Port Throughput. Figures 8 and 9 illustrate the magnitude and direction of these variables' spatial and temporal effects. The effect of GDP on China's outward FDI Flow varies geographically from positive to negative, as depicted in Figure 8. The effect is negative in Africa and incredibly positive in Asia. From 2011 to 2015, a higher GDP in South Asia appears to increase China's outward FDI Flow. The increase in South East Asian countries' GDP from 2010 to 2013 has positively affected China's FDI in South East Asia.
Nonetheless, the relative stagnation of South East Asia's GDP since 2013 has reduced China's outward FDI Flow into the region. However, the effect of China's GDP on its FDI outflows to South Asia is relatively minimal. As non-participating members of BRI, Australia's and North America's GDP tends not to substantially influence China's outward FDI Flow between 2010 and 2015.
Between 2010 and 2015, the size of China's GDP had no effect on its outward FDI in Western European countries. Eastern European nations have also demonstrated a negligible impact of BRI on FDI Flow. After implementing BRI, Russia and its neighbours, such as Belarus, Uzbekistan and Ukraine, have positively and increasingly affected China's outward FDI Flow's impact on their GDP.
Figure 9 illustrates the negative impact that container port throughput has on West Asia and North Africa. Greater Container Port Throughput diminishes China's outward FDI Flow in these regions. The Container Port Throughput in participating countries in South, Southeast and Central Asia has a negligible impact on China's outward FDI Flow, as shown in Figure 7. However, the Container Port Throughput harms China's outward FDI Flow in Eastern European nations (e.g. Slovakia, Slovenia, and Poland), Africa (Egypt) and the United States.
5. Discussion
Spatial and temporal analysis resulted in this study is a useful insight, which can help mapping of how the variables driving FDI in space and time. Three significant conclusions can be drawn from the model's outputs. The first relates to the impact of GDP on China's FDI stock and flow. Over time, the magnitude and direction of the effect of China's GDP on its outward FDI Stock and FDI Flow tend to vary by region. In BRI-participating South East Asia nations, for instance, the impact of GDP on China's outward FDI will diminish over time. The influence is weaker in other regions, such as Africa and Australia, where most countries are not participating in BRI. The BRI has no direct effect on the impact of the European countries' GDP on China's outward FDI, the magnitude and direction of which have remained unchanged from 2011 to 2015. In contrast, Russia and its neighbours, such as Kazakhstan, Uzbekistan, Finland and Belarus, have demonstrated a significant impact of GDP on China's outward FDI Stock and Flow, particularly from 2013 to 2015, when the BRI was implemented. Before and after implementing the BRI, the effect of GDP on China's outward FDI Stock in North and South America did not change significantly. It could be because neither North nor South American nations participate in the BRI.
The second relates to China's outward FDI both Stock and Flow, which are geographically and temporally influenced by Container Port Throughput. Container Port Throughput influences China's outward FDI, Stock and Flow from a geographical and temporal perspective. After 2013, the influence of the Container Port Throughput on China's outward FDI in BRI member nations in South East Asia tends to diminish. In non-participating nations like India, Australia, New Zealand, the United States and a few South American nations, Container Port Throughput has no significant impact on China's outward FDI.
The third aspect relates to the target countries of FDI outflows from China. This study found that China's outward FDI has increased in East Asia, the Pacific region and North America, while it has declined in Europe, Central Asia and Sub-Saharan Africa. Interestingly, the research also discovered that all variables of logistics performance index have a negative impact on China's outward FDI, indicating that China's outward FDI targets countries with inadequate logistic infrastructure. This is understandable as a country obtains income by selling its surplus and acquiring scarce resources from other countries with this income. In this context, several political and economic initiatives such as the BRI have been established by countries working harmoniously to facilitate and regulate international trade and create a common market. However, despite these initiatives meeting specific shared needs, it is crucial to conduct logistics activities correctly to ensure effective and efficient foreign trade. If properly planned and executed, logistics activities tend to streamline the import and export processes, making them more efficient and reducing resource utilisation.
The limitation of this study lies in its inability to forecast the future impact of variables such as GDP and Container Port Throughput. Nonetheless, the trend model generated by this study reveals a notable shift in the correlation between China's outward FDI and certain participating countries such as South East Asian, transitioning from negative to positive. This suggests that countries with previously inadequate logistic infrastructure are likely to improve following their involvement in the BRI. Exploring the measurement of China's outward FDI impact on specific aspects, particularly logistics infrastructure, over the next 5–10 years presents an intriguing opportunity. Understanding whether enhanced logistics infrastructure significantly contributes to China's outward FDI warrants further investigation, despite the fact that the quality of logistics infrastructure improving during the BRI process has been revealed (Üre et al., 2023).
Knowing this, spatial and temporal impact of China's Outward FDI can assist the Chinese Government in formulating a new BRI implementation strategy. GDP and Container Port Throughput are hypothesised to influence China's Outward FDI in BRI countries. From a geopolitical and developmental standpoint, the strategy must centre on how BRI can support the economies of certain nations, particularly BRI participants and those on the network. The future impact of BRI can be comprehended by its potential to fund economically beneficial infrastructure. However, policymakers must analyse how the development of China's GDP and logistics performance will impact China's FDI exports to BRI participants and other countries. The development of logistics performance could facilitate the expansion of commerce and create new economic opportunities. These outcomes are possible even if Chinese investment benefits one or more regions or cleavages over another. As the propositions heavily depend on a data-driven methodology, additional research is required to support the testing and validation of these hypotheses. Nonetheless, it is concluded that the spatial and temporal impact of China's outward FDI is crucial to the success of the Chinese Government's BRI strategies.
6. Conclusion
The originality of this paper lies in its application of GTWR to incorporate space and time innovatively to model the effect of economic and logistics performance-related variables on China's outward FDI from 2010 to 2015. Applying GTWR improved the model by incorporating spatial and temporal local variability. This innovative geographic technique offers a new perspective on spatio-temporal modelling and visualisation of the impact of variables on China's outward FDI over time and space.
Only GDP and Container Port Throughput significantly impact China's outward FDI, both stock and flow. However, the remaining 15 independent variables did not affect FDI flow or stock. The positive effect of Container Port Throughput on China's outward FDI tended to decrease from 2010 to 2015, whereas the positive effect of GDP on China's outward FDI increased over time. The magnitude and direction of the effect of GDP on China's outward FDI Stock and FDI Flow are likely to vary across regions, both those participating in the BRI and those not. Generally, regional characteristics change over time. In BRI-participating South East Asia nations, for instance, the impact of GDP on China's outward FDI will diminish over time. China's outward FDI has a more significant impact on Russia and its neighbouring countries, which share direct borders with China, than in other regions such as Africa, Australia and Europe, where most countries are not participating in BRI.
From 2010 to 2015, the effect of GDP on China's outward FDI in Asia has diminished in both space and time, particularly for BRI-participating nations in South East Asia. The effect of GDP on China's outward FDI Stock and FDI Flow had remained unchanged for the Americas, Western Europe and Western Africa, indicating no significant change in FDI before and after the BRI was implemented.
After the launch of the BRI Scheme, the impact of China's Container Port Throughput on BRI-participating countries in South and Southeast Asia tends to diminish. The Container Port Throughput substantially impacts China's outward FDI Flow for a few non-participating Western European, African, North American and South American nations. In other words, the increased effect of Container Port Throughput is more likely to reduce the China's outward FDI Flow to these regions.
The findings will not, however, shed light on China's outward FDI requirements in certain countries for economic development. The findings provide evidence to aid policymakers in identifying the investment's winners and losers, the scale and direction of investment, and the key drivers that shape the global distribution of investment patterns. This study also assists the Chinese Government in re-designing strategies to evaluate the key drivers that shaped past investment patterns and assess the strategic investment in BRI-aligned preferential countries to strengthen trade and business partnerships.