The purpose of this study is to explore the starring role of digital transformation (DT) in establishing the relationship between supply chain resilience (SCR) and organisational performance (OP) and to check the moderating effect of organisational agility (OA).
Data and information were collected from 435 manufacturing firms in India, covering automotive, electronics and machinery sectors, through structured questionnaires. Using Structural Equation Modeling (SEM) and Hayes’ PROCESS macro, direct mediating and moderating effects were tested to evaluate the hypothesised relationships.
Supply Chain Resilience (SCR) has a positive and significant effect on OP, with DT mediating this relationship (indirect effect = 0.0735, 95% Confidence Interval (CI) [0.0107, 0.1633]). Although OA independently enhances OP (ß = 0.8793, p < 0.001), it does not significantly moderate the SCR and OP relationship (index of moderated mediation = −0.0223, 95% CI [−0.0850, 0.0401]). DT acts as a critical pathway for resilience to translate into performance gains, whereas ability contributes more directly rather than interactively.
The study contributes to supply chain and OP literature by empirically validating the mediating role of DT in resilience performance associations and illustrating the contextual character of OA. It provides novel insights from Indian manufacturing firms in emerging markets, where digital maturity is evolving.
1. Introduction
In a global competitive business environment, supply chain management was gradually exposed to disruptions created by climate change, geopolitical instability, pandemic and technological volatility. These disruptions have emphasised the need for supply chain resilience (SCR). The capacity of a supply chain during an adverse situation depends on how it forecasts, responds, improves and adapts (Gölgeci and Gligor, 2022; Stadtfeld and Gruchmann, 2024). During supply chain disruptions, implementation of advanced skills, such as IoT, cloud computing and predictive analytics, is being leveraged to improve visibility, decision-making and reduce response time (Piprani et al., 2024; Sharma et al., 2025). Together with resilience, digital transformation (DT) has developed as a dynamic enabler for organisations looking to maintain continuity, transparency and adaptability in their supply chain operations.
Another critical construct in this background is organisational agility (OA). It is an ability to sense changes and quick adjustments in its operational and resource allocation process, in the dynamic business environment (Gölgeci and Gligor, 2022). OA and resilience are progressively viewed as complementary: agility helps organisations adapt proactively, while resilience helps them withstand and bounce back from any type of disruption. Agile supply chains assisted by digital technologies perform better in terms of sustainability and operational performance, especially under the disruptive business environment (Sharma et al., 2025; Piprani et al., 2024).
These disruptions highlight the significance of organisational resilience as a strategic capability to absorb shocks, adapt quickly, and sustain operations in supply chain management (Christopher and Peck, 2004). Simultaneously, digital transformations have appeared as a vital enabler of resilience by integrating technologies such as Artificial Intelligence (AI), IoT, blockchain and cloud-based platforms into supply chain management processes (Ivanov and Dolgui, 2020). However, resilience and DT alone may not guarantee to enhance performance unless complemented by OA, the ability to sense, adapt and respond rapidly to changes.
Despite the growing literature, the interplay among SCR, DT and OA, and how that nexus influences overall performance, remains underexplored. In particular, it is not yet well understood whether agility moderates the relationship between resilience and performance, or whether DT acts as a mediating mechanism in the resilience-performance link. Addressing this gap in the available literature, our study suggests a research model in which DT mediates the effect of SCR on performance, while OA acts as a moderator in the supply chain management. Empirical validation of this model can offer both theoretical contributions and practical implications for managers striving to establish robust, high-performing supply chains in disruptive environments.
2. Literature review
2.1 Supply chain resilience
SCR specifies the adaptive ability of organisations to anticipate, respond, prepare and quickly recover from disruptions through maintaining the continuity of operations (Ponomarov and Holcomb, 2009). Organisational resilience not only ensures existence during crises but also enhances the long-term competitiveness of the organisation (Sheffi, 2005).
SCR has emerged as a vital construct for understanding how organisations withstand, adapt to and recover from major disruptions. That is, the resilience of an organisation is understood as a multi-dimensional capability that empowers supply chains to absorb shocks, recover functionality quickly and adapt to new disruptive situations rather than simply returning to a prior state (Shishodia et al., 2023). Organisational resilience involves preparedness (proactive risk identification and buffering), response (rapid reconfiguration and recovery) and learning (post-disruption adaptation) as interrelated processes that together determine a supply chain’s survivability and long-term competitiveness. Empirical and conceptual work in literature highlights several recurring antecedents and mechanisms that build resilience. Visibility (real-time information sharing), flexibility (operational and sourcing flexibility), collaboration (supplier and partner coordination) and digital capabilities (analytics, IoT, blockchain) repeatedly appear as critical enablers of SCR (Perano et al., 2023; Gaudenzi et al., 2023).
Many studies emphasise that resilience pays off in performance terms, but that effects are context dependent. Empirical reviews find positive links between SCR and operational/financial outcomes, yet they also note boundary conditions such as industry dynamism, firm size and the nature of digital maturity that influence whether resilience investments translate into superior performance. Consequently, current research calls for more nuanced models that examine mediators (DT) and moderators (OA) to explain the resilience performance nexus, precisely the gap addressed in the present study.
2.2 Digital transformation in supply chains
DT is a process, with objectives of activating substantial changes through amalgamations of information, communication, connectivity and computing of advanced technologies (Shi et al., 2023). DT is not only about deploying new technologies but also about reorganising processes, structures and strategies to exploit their potential. DT in supply chains (DTSC) is increasingly recognised as a strategic tool for organisations striving to maintain competitiveness, resilience and service quality in the disruptive environment, uncertainty and rapidly changing demand patterns.
In supply chain firms, big data, analytics and IoT are the most prioritised technologies in terms of both current impact and expected future investment (Akbari et al., 2024). The synergies among these technologies (combining AI, robotics and IoT) help firms create more flexible, responsive and digitally mature supply chain operations.
DT has a noteworthy positive direct effect on SCR, and the mediating path via supply chain process integration is strong (Yuan et al., 2024). DT implementations are more effective when firms integrate not just the technology but also their processes and flows. Data analytics and real-time monitoring emerged as essential, whereas barriers such as cost, less stakeholder involvement and the absence of proven business cases remain substantial impediments in supply chain management (Baycik and Gowda, 2024). Many firms are still in early or intermediate stages of digital maturity, and implementation challenges often centre on people, change management and aligning transformation with strategy. DT leverages to improve efficiency, transparency and flexibility across supply chain networks. Technologies such as blockchain improve traceability, IoT enhances real-time monitoring and predictive analytics support demand forecasting (Queiroz and Wamba, 2019). Digitally transformed supply chains can rapidly reconfigure in response to disruptions, in turn enhancing resilience.
2.3 Organisational agility
Agility means the capability of organisations to sense and seize opportunities in a turbulent environment (Teece et al., 2016). In the supply chain context, agility enables organisations to adapt rapidly to changes in demand, disruptions or technological advances. Scholars argue that agility enhances the value derived from resilience and DT by ensuring rapid execution of adaptive strategies (Gligor et al., 2013).
Agility is a multidimensional capability that spans sensing (detecting changes), decision-making (rapid, decentralised decisions) and reconfiguration (reallocating resources and processes), and it emphasises that agility is both a dynamic capability and a strategic asset for sustaining competitiveness in turbulent environments. OA has been described broadly as an organisation's ability to rapidly sense, change and rearrange resources, processes and structures to respond effectively (Hutter et al., 2025). OA is closely linked to digitalisation and dynamic capabilities. Digital technologies (data analytics, IoT, cloud platforms) act as enablers of agility by improving sensing and shortening decision cycles, while organisational routines and managerial practices translate those technological inputs into actionable agility (Pelletier et al., 2025).
Agility is not simply a technology outcome but a socio-technical capability: technology provides data and speed, but managerial processes and culture determine whether that speed converts into agile action. Studies find that agile organisations are better able to convert disruptions into opportunities they reconfiguring supply chains, redeploying capacity and innovating under pressure, thereby preserving or even improving operational and market outcomes (Goraya et al., 2024). OA has been increasingly hypothesised as a dynamic capability that helps the organisation to sense, understand and respond rapidly to supply chain disruptions (Gligor et al., 2020). OA is not only an internal capability, but it also acts as a moderating variable that improves the effectiveness of supply chain processes (Wieland and Wallenburg, 2013). In resilient supply chains, OA enables the organisation to convert resilience capabilities like adaptability and redundancy for the enhancement of performance outcomes of the organisation by ensuring timely reconfiguration of resources (Brusset and Teller, 2017). Hence, OA is theoretically expected to strengthen the relationship between SCR and organisational performance (OP). This research also indicates that agility generally operates through and alongside other mechanisms, such as by strengthening the impact of DT on operative responsiveness or by moderating the resilience performance.
2.4 Organisational performance
SCR and DT have a positive impact on financial and operational performance. On the other hand, the strength of this relationship may change depending on OA. Agile firms can exploit digital tools and resilience strategies more effectively, translating them into superior performance outcomes. Organisational performance (OP) remains a central outcome in management and supply chain management, encompassing multiple dimensions such as operational efficiency, financial outcomes, customer satisfaction and sustainability (Gorane and Kant, 2017; Sahoo and Vijayvargy, 2021). In Indian manufacturing organisations, communication systems, information technology adaptability, supply chain incorporation, operational approachability and green practices significantly improve customer satisfaction, operational and financial performance, with customer value acting as a key mediator (Gorane and Kant, 2017). Green Supply Chain Management (SCM) practices have also been robustly linked to OP. Dimensions such as eco-design, investment recovery and cooperation with stakeholders significantly influence environmental, economic and operational performance (Sahoo and Vijayvargy, 2021). Mehmood et al. (2024) research mentioned that in “Achieving supply chain sustainability: enhancing SCR, OP, innovation and information sharing”, they studied Chinese SMEs and found that SCR positively influences OP; innovation mediates this relationship, and information sharing further moderates it. Industry 4.0 and green practices, mediated via smart supply chains, agility and resilience, are significantly associated with sustainable business performance (Sharma et al., 2025).
3. Conceptual framework and hypotheses
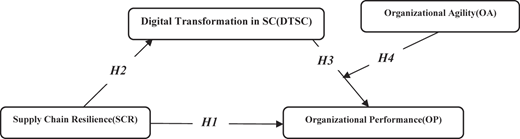
Our research proposes a conceptual model, as shown in Figure 1, where:
SCR positively influences OP.
DT strengthens the relationship between resilience and performance.
OA moderates the resilience-performance nexus, such that the relationship is stronger in firms with higher agility.
4. Methodology
Our research implements cross-sectional research design to inspect the interrelationships among SCR, DTSC, OA and OP. Quantitative design was chosen because it allows for the statistical testing of hypothesised relationships and offers generalisable insights into manufacturing sector practices (Hair et al., 2019a, b).
Data were collected from managers and senior executives employed in manufacturing firms across automotive, electronics and machinery industries located in Bengaluru, as these sectors represent dynamic supply chains highly exposed to volatility and disruption. A structured questionnaire was designed to gather the data and information, and the designed instrument was tested for validity using exploratory factor analysis (EFA) and Confirmatory Factor Analysis (CFA). A total of 435 useable responses were obtained. The sampling approach followed a purposive approach, targeting professionals who are directly involved in the supply chain management operation process. Respondents represented a mix of medium and large-scale organisations, ensuring diversity in firm size and operational scope.
All research variables were measured using multi-item scales designed based on a 5-point Likert scale. Items for SCR included flexibility, risk management capability and recovery speed (Ali et al., 2017). DTSC was measured through indicators of technology adoption, process automation and data integration (Ivanov and Dolgui, 2021). OA was assessed by adaptability, responsiveness and innovation (Sharma et al., 2025). OP encompassed financial, operational and sustainability dimensions, consistent with prior supply chain research (Mehmood et al., 2024; Sahoo and Vijayvargy, 2021).
5. Validation of the measuring instrument
5.1 Sample adequacy test
To conduct the different statistical analyses, an adequate sample is required. To check the adequacy of the collected sample size, Kaiser–Meyer–Olkin (KMO) test was performed, which yields an index of 0.866; this is more than the threshold value, and this shows that the data are highly appropriate for any statistical analysis. To verify the identity matrix in the collected data set, Bartlett’s test was conducted; the result was statistically significant (p < 0.001). This endorses that there is no identity matrix, that is the selected research variables are sufficient to provide a rational foundation for factor analysis (Kaiser, 1974).
5.2 Exploratory factor analysis
EFA was conducted to extract the predominant factors and to validate the designed questionnaire; the statistics of EFA are shown in Table 1.
EFA under the principal component analysis explored a clear four-factor structure, which is supported by the proposed theoretical constructs of the study. The extracted factors from EFA were identified as SCR, DTSC, OA and OP. Together, these four factors explain a cumulative variance of 71.07%, which is well above the recommended threshold of 60% in social science research, indicating a strong explanatory power of the factors.
After varimax rotation, the variance was more evenly distributed, confirming that all four extracted factors are dissimilar and meaningful contributors. These outcomes validate the conceptual framework of our proposed research model and provide strong statistical support to the designed items in the questionnaire that reliably measure the four research variables.
In the EFA, four distinct and reliable factors corresponding to the study were extracted: SCR, DTSC, OA and OP. All the grouped and extracted items were loaded strongly with their individual factors, thereby demonstrating a clear construct separation among the extracted factors; the item loading and measurable were shown in Table 2. In particularly, for SCR factor, items loaded between 0.566 and 0.791; for DTSC factor, items loading were between 0.664 and 0.810; for OA factors, items loading were between 0.601 and 0.751; for OP factor, the items loadings were between 0.921 and 0.959; and for all the extracted variables, item loadings are more than the minimum acceptable threshold of 0.50. The extraordinarily high loadings of the factor OP items specify for the strong reliability; at the same time, the balanced loadings across the variables SCR, DTSC and OA confirm the strength of these measures included in the questionnaires. In EFA, the extraction was converged in five iterations, which validated the stability of the proposed factor structure. Largely, these results deliver strong empirical evidence that the proposed measurement model is valid and reliable to measure the intended objectives and align largely with the proposed theoretical framework of the study.
5.3 Confirmatory factor analysis
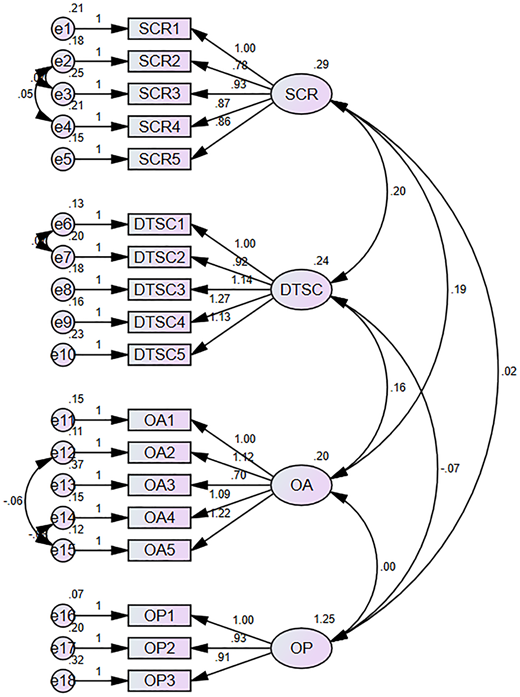
By conducting CFA, the extracted factors, along with their individual items extracted through EFA, were confirmed. The summary of the model-fit indices shows that the proposed measurement model was valid and acceptable; the measurement model is shown in Figure 2. The chi-square statistic (Minimum Discrepancy - Chi-Square Value (CMIN) = 389.527, Degrees of Freedom (df) = 124, p < 0.001) is significant, because the chi-square/df ratio (3.141) falls within the acceptable range (<5), suggesting a reasonable model fit. The RMR value for the proposed model shows 0.033, which is less than the standard value of 0.08, indicating a good residual model fit. The model fit indices like Goodness-of-Fit Index (GFI) (0.862) and Adjusted Goodness-of-Fit Index (AGFI) (0.810) are slightly less than the ideal threshold of 0.90 but still indicate a moderately good fit. Other comparative model fit indices, including Normed Fit Index (NFI) (0.884), Incremental Fit Index (IFI) (0.918), Tucker–Lewis Index (TLI) (0.897) and Comparative Fit Index (CFI) (0.917), are all close to or above the 0.90 threshold, a satisfactory level of model fit relative to the standard baseline model. However, the Root Mean Square Error of Approximation (RMSEA) value for the proposed model was (0.081), which is slightly more than the recommended cut-off value of 0.08, with confidence intervals (0.081–0.101) representing a marginal error approximation, and the Probability of Close Fit (PCLOSE) value (0.000) suggests that the proposed research model could still be improved, for more accurate outcomes. In total, the CFA outcomes suggest that the proposed research model demonstrates a moderate to good fit, with indices supporting the structural validity of the proposed research framework, though further refinement could enhance the model’s robustness. Even though the CFA demonstrated the acceptable fit indices overall (χ2/df < 3; CFI and TLI >0.90), some indices, particularly GFI, AGFI and RMSEA, were marginal. This indicates that the partial model is not up to that level of acceptance of the model, and it suggests that future studies should refine measurement items or use multi-group CFA to reduce cultural and contextual bias (Hair et al., 2019a, b).
The outcomes of the model fit values provide evidence for the content, construct validity and overall reliability of the proposed measurement model. The strong item loading for each factor in the rotated component matrix supported the content validity of the designed questionnaire. This indicated that each item clearly represents its respective research variable (SCR, DT, OA, OP). The construct validity of the designed questionnaire is verified through the model fit indices, where chi-square/df (3.141) is within the acceptable range, and comparative fit indices such as CFI (0.917), IFI (0.918) and NFI (0.884) are more than the recommended thresholds; these outcomes confirming that the proposed measurement items sufficiently capture the fundamental independent research variables. The discriminant validity of the proposed research model was demonstrated by the clear separation of factors with no major cross-loadings among the items; on the other hand, convergent validity is implied through high item loadings in each factor (many above 0.70), which indicates that the items strongly converge on their intended research variables. The Root Mean Square Residual (RMR) (0.033) shows the minimal residual error, strengthening the reliability of the measurement model, though the RMSEA (0.081) suggests a marginally high error of approximation, indicating potential areas for refinement of the items in the measurement model. Taken together, the findings confirm that the model demonstrates good content, convergent and discriminant validity and acceptable reliability, and it shows the suitability for further testing and analysis.
Variance inflation factor was determined to measure multicollinearity amongst the independent constructs SCR, DTSC and OA in predicting OP; all the test statistics were represented in Table 3. The results showed that all Variance Inflation Factor (VIF) values were less than the recommended cut-off value of 5, confirming that multicollinearity is not in the proposed model. This suggests that each independent construct contributes uniquely to explaining the variance in OP without significant overlap or redundancy. Consequently, the path estimates in the structural model can be considered stable and reliable, thereby strengthening the validity of the regression and SEM results.
5.3.1 Common method bias assessment
Common method bias (CMB) was conducted because of the usage of cross-sectional and single-source data; we conducted multiple tests to assess the presence of CMB. The Harman’s single-factor test was conducted, which revealed that the first factor accounted for 19.81% of the total variance, which is well below the 50% threshold (Podsakoff et al., 2003). We further tested for CMB using a common latent factor (CLF) approach in CFA. The CLF test results indicated no substantial inflation of standardised loadings (>0.20), indicating that CMB is not a significant concern. In addition to this, to check the collinearity, variance inflation factor was calculated; the test result revealed that for all the factors, VIF values were below 3, further confirming the absence of collinearity and CMB. The test statistics were presented in Table 4.
5.4 Covariance analysis
The covariance analysis reveals significant relationships among the model constructs, providing strong evidence of interdependence. SCR shows a significant positive relationship with DTSC (0.204, p < 0.001), OA (0.188, p < 0.001) and OP (0.067, p < 0.001). Similarly, DTSC exhibits significant positive covariances with OA (0.157, p < 0.001) and OP (0.072, p < 0.001), suggesting that DT not only enhances agility but also contributes positively to performance outcomes. OA also shows a significant positive covariance with OP (0.050, p < 0.001), implying that greater agility is linked with improved OP. Covariance statistics were shown in Table 5.
Overall, the results confirm that SCR, DTSC and OA are strongly interrelated and together influence OP, supporting the proposed framework of the study. That is from the covariance statistics; H1 hypothesis was significant at 5% level of significance, that SCR positively influences OP.
5.5 The moderated mediation
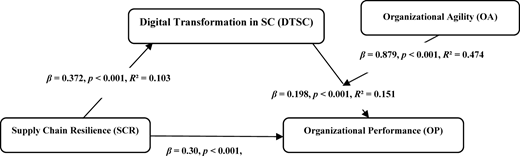
The moderated mediation analysis using PROCESS Model 7 (Hayes, 2022) examined whether OA moderates the indirect effect of SCR on OP through DTSC. In the first stage, SCR significantly predicted DTSC (β = 0.7492, p = 0.0275), and OA also significantly predicted DTSC (β = 0.7254, p = 0.0209), indicating that both resilience and agility contribute to enhancing DT. The interaction term (SCR × OA) was not significant (β = −0.1129, p = 0.1591, ΔR2 = 0.0066), suggesting that OA does not significantly moderate the direct effect of SCR on DTSC. In the second stage, both SCR (β = 0.3040, p < 0.001) and DTSC (β = 0.1977, p = 0.0009) significantly predicted OP, indicating a robust mediation pathway. The direct effect of SCR on OP remained significant (β = 0.3040, p < 0.001), while the conditional indirect effects of SCR on OP via DTSC varied slightly across levels of OA (effect sizes ranging from 0.0812 to 0.0535). The index of moderated mediation analysis (−0.0223, BootLLCI = −0.0850, BootULCI = 0.0401) shows that it was nonsignificant, demonstrating that OA does not significantly moderate the mediated relationship between SCR and OP. Moderated mediation analysis model is shown in Figure 3. The outcome of mediated moderation analysis suggests that both SCR and OA positively influence DT in the supply chain, and DT positively influences OP; OA does not significantly change the strength of the mediation effect. This emphasises the importance of SCR and DTSC as primary drivers of OP, with OA having a direct effect but not a moderating role in this proposed research process.
The moderated mediation analysis outcomes explored the evidence for the hypothesised moderating and mediating roles of DT and OA. For the proposed Hypotheses H2 and H3, the outcomes confirm that DT in the supply chain significantly mediates the relationship between SCR and OP; this indicates that resilient supply chains support the superior performance outcomes of an organisation more effectively when supported by advanced digital technologies. This research outcome advocates that resilience alone may not guarantee performance gains unless it is complemented by digital integrations such as automation and data-driven decision making, which empower organisations to identify and act accordingly for the disruptions and recover quickly. On the other hand, the test statistics of Hypothesis H4 reveal that OA does not significantly moderate the SCR and OP relationship, as the interaction effect on these two variables was statistically not significant. Whereas OA contributes positively to the performance of the organisation in its own independent way, and its role as a moderator was not significantly supported, it indicates that the resilience and performance association is relatively stable across organisations regardless of their level of agility. At the same time, it is revealed that OA does not strengthen the relationship between SCR and OP under conditions of DT in the supply chain. This result indicates a potential substitution effect, where DT capabilities (data visibility, automation and real-time analytics) decrease the dependency on OA for transforming SCR into OP. All these findings collectively highlight that DT acts as a crucial enabler of resilience-driven performance; however, agility appears to operate more as a direct driver rather than a contingent condition, strengthening the relationship.
6. Results
The outcome of the present research provides broad empirical evidence for the exploration of hypothesised relationships among SCR, DTSC, OA and OP. The measurement model was validated through various validity checks. Initially, the KMO value of 0.866 and Bartlett’s test index (χ2 = 3260.293, p < 0.001) confirmed sampling adequacy. Indices also indicated a satisfactory fit to the proposed measurement model (χ2/df = 3.141, CFI = 0.917, TLI = 0.897, RMSEA = 0.091). The SEM results demonstrated that SCR has a substantial and positive effect on DTSC (β = 0.3719, t = 5.43, p < 0.001) and OP (β = 0.3040, t = 4.47, p < 0.001). DT significantly influenced the performance of the organisation (β = 0.1977, t = 3.37, p < 0.001), and it highlights the role of DT as a strategic enabler of performance supply chain among the manufacturing firms. At the same time, mediation analysis further revealed that DTSC partially mediates the relationship among the SCR–OP (indirect effect = 0.0735, Boot 95% CI [0.0107, 0.1633]), thereby providing strong support for Hypotheses H2 and H3. This indicates that resilience alone is not sufficient to drive superior performance; rather, firms must integrate DT practices such as automation, data analytics and real-time monitoring to expose the full performance benefits of resilience.
On the other hand, the moderation analysis of OA revealed that agility of the organisation had a direct and significant positive relationship with performance (β = 0.8793, t = 3.69, p < 0.001); its interaction effect with SCR on OP was nonsignificant (β = −0.0283, p = 0.643). The inclusion of the interaction term (OA) resulted in a negligible change in explained variance (ΔR2 = 0.0004), indicating that OA does not meaningfully enhance the explanatory power of the model as a moderator. Indicating that OA did not moderate the SCR–OP relationship as hypothesised in H4. Even though OA demonstrated a strong and positive direct effect on OP, its role as a moderator in the relationship between SCR and OP was not supported. These outcomes suggest that while OA remains a critical organisational capability, its influence on OP may operate independently rather than as a moderator in digitally enabled supply chains.
These results confirm that resilient supply chains combined with DT initiatives yield stronger performance outcomes in manufacturing firms, particularly in the automotive, electronics and machinery sectors. However, OA, although critical for performance, does not appear to enhance the resilience–performance nexus. This nuanced finding contributes to theory by emphasising the distinct roles of DT and agility in the resilience–performance framework.
7. Discussion and conclusion
The outcome of the study provides significant support for the hypothesised relationships amongst resilience, DT, agility and performance of an organisation, in the supply chain. Consistent with literature (Sharma et al., 2025), the findings show that resilience has a strong positive direct effect on performance (β = 0.3040, p < 0.001). Importantly, DTSC mediates this relationship, SCR strongly predicts DTSC (β = 0.3719, p < 0.001) and DTSC in turn affects performance (β = 0.1977, p < 0.001); the indirect effect (0.0735) is significant (95% CI [0.0107, 0.1633]). This mirrors findings in studies of smart and sustainable supply chains, which show that digitalisation helps convert resilience into actual performance outcomes (Sharma et al., 2025). The nonsignificant moderating effect of OA (β = −0.0283, p = 0.643; moderated mediation index nonsignificant) suggests that, contrary to expectations, OA does not strengthen the resilience performance link in this sample. However, OA itself had a strong direct effect on performance (β = 0.8793, p < 0.001), indicating that agility matters but more as a direct driver rather than as a conditional amplifier.
The nonsignificant moderating effect of OA proposed an important theoretical insight into the increasing dynamics of digital supply chains. Contrary to traditional theoretical assumptions, organisation agility did not strengthen the relationship between SCR–OP when DT was combined into the model. Present research outcome suggests a substitution effect, whereby digital technologies reduce dependence on human-centric agility mechanisms. That is DT prepares and guides organisations with the real-time visibility, predictive analytics abilities and automated decision support systems that enable quick and precise responses to disruptions in the supply chain. Therefore, the adaptive functions traditionally performed by OA, such as quick coordination and flexibility in the decision-making process, may be increasingly embedded within digital infrastructures. In such frameworks, OA contributes directly to the performance but does not conditionally impact the effectiveness of resilience in the supply chain. This version aligns with developing perceptions that digital capabilities of an organisation may reconfigure the role of dynamic capabilities, transforming agility from a conditional moderator into a direct performance driver. At the same time, rejecting the moderation hypothesis does not reduce the importance of agility in the organisation; rather, it highlights the changing nature of adaptive capabilities of an organisation in digitally advanced environments.
8. Implications
Outcomes of the research confirm that DT is an essential mediator in the resilience performance lane, reinforcing dynamic capabilities, which need to treat digital and organisational capabilities as mechanisms to utilise environmental opportunities. The lack of moderation by OA reminds us that agility might function differently depending on sectoral, empirical and cultural factors and that assumptions about the interactive effects of agility should be tested rather than derived. By considering environmental turbulence as a moderator, supplier collaboration as a mediator and digital intensity of firms as a boundary condition, in the Industry 4.0 capability clusters (automation, IoT, AI) as relational mechanisms, the study can be extended.
The authors would like to express their gratitude to JSS Mahavidyapeetha, Mysuru, and JSS Academy of Technical education, Bengaluru, Karnataka, India, for their encouragement to write this research paper. The authors express their sincere thanks to all the authors of source materials cited at the reference. They also express their sincere thanks to the editorial team for their valuable guidance and providing useful comments, observations and suggestions, which led to the improvement of this article.