To address the gap in existing research that predominantly focuses on meso- and macro-level perspectives, this study investigates the degree of enterprise participation in industrial digitalization from a micro-level perspective and analyzes its impact on corporate performance.
Using A-share listed companies from 2017 to 2023 as the sample, an evaluation index system for industrial digitalization participation is constructed. The participation index is calculated using the TOPSIS comprehensive evaluation method based on game-theoretic combination weighting. An industrial network map of enterprises is developed according to their industrial distribution for vertical industry-category and horizontal time-series analysis.
The SCP framework from industrial organization theory is employed to examine the impact of participation on corporate performance. The overall level of industrial digitalization participation in China is relatively low and fairly uniform across industries. High-tech demand industries are suitable for deep technological penetration; light-asset service industries should focus on ecological collaboration and agile cooperation, leveraging strategic alliances to respond quickly to market changes; traditional heavy industries require strengthened policy guidance and leadership from leading enterprises to drive digital penetration industry-wide through benchmark projects. Empirical evidence indicates that participation in industrial digitalization significantly enhances corporate performance.
This study establishes a micro-level evaluation system for enterprise participation in industrial digitalization, integrates industrial network mapping with the SCP analytical framework and provides references for categorized digital advancement of enterprises, policy formulation and future research.
1. Introduction
With the rapid development and wide application of the new generation of information technologies, the new economic form dominated by the digital economy has become a new driving force for contemporary economic development, and China's industrial development has also ushered in new opportunities. Since 2013, the Internet industry has entered the mobile era. The basic pattern of China's digital economy has been established, and it has entered a mature stage. In 2024, the 2024 Government Work Report emphasizes that “policies to support the high-quality development of the digital economy should be formulated, and efforts should be made to promote the industrialization of digital technology and the digitalization of industries, as well as to deepen the integration of digital technology and the real economy.” The development of digital economy has gradually risen to the height of national strategy. Moreover, the “China Digital Economy Development Research Report (2024)” shows that the scale of industrial digitization in China will reach 43.84 trillion yuan in 2023, accounting for 81.3% of the proportion of the digital economy, which shows that industrial digitization has become an important engine for the construction of Chinese modernization. However, practical problems such as varying degrees of digitalization among enterprises in the industrial chain, lagging construction of cluster platform communities and weak guidance mechanisms for typical demonstrations have restricted and troubled the improvement of enterprises' value creation levels. Therefore, how to enhance the close connection between real industry and digital technology, how to give full play to the synergistic effect of the two and how to realize the overall leap of the national industrial economy have become important issues that need to be solved urgently.
Industry is a collection of enterprises producing similar or closely substituted products and services, and the vertical integration of industrial organization is one of the core contents of industry, which is presented by the spatial agglomeration of upstream and downstream enterprises within the industry. However, after the digital transformation of the industry, based on the external support of digital technology and the open sharing of data resources, enterprises can realize the Parallel Interaction in the industrial ecosystem, and “the Internet +” has restructured the value production process of traditional industries, enabling enterprises that were previously competing with each other within the same industry to form strategic alliances. The enterprise seeks relevant resources based on customer demands, shifting from a competitive logic to a symbiotic logic, thereby achieving a completely new form of value addition and creation (Zhao and Peng, 2018a). What's more, with the development of digital technology, the role of spatial relations as a link between enterprises is gradually being weakened, and the digitization of industry with the Internet of Things (IoTs) as the main carrier has realized industrial synergy and promoted the development of industrial organization network (Chen et al., 2022).
Compared with enterprise digitalization, which focuses on the upgrading of internal technical systems and the reengineering of business processes, industrial digitalization places more emphasis on the integration of information elements and the evolution of ecosystems across enterprises and regions. There are significant differences between the two in terms of goal orientation, resource integration methods and performance measurement standards. However, as market competition shifts from isolated inter-company rivalry to collaborative competition among industrial chains and ecosystems, the focus of digital transformation is expanding from internal optimization to external synergy. Against this backdrop, industrial digital transformation has become a critical pathway for addressing market challenges and building core competitiveness.
On the market side, consumer markets exhibit highly fragmented and time-sensitive characteristics, posing severe challenges to traditional supply chains and production models. This directly compels enterprises to develop agile responsiveness and flexible production capabilities. Notably, on the enterprise side, digital transformation follows a distinct path logic. Supply chain digitization leverages digital twin technology to reconstruct a dual-dimensional “quality-delivery” assurance system, enhancing process transparency and response efficiency. Meanwhile, the deep application of Customer Relationship Management (CRM) has created dual value creation in service process reconfiguration, namely improving customer experience and optimizing sales efficiency.
On the technical side, relying on large-scale data collection, cloud storage and intelligent analysis capabilities, market entities can accurately identify the cyclical fluctuations of consumption trends, systematically reshape the supply chain response mechanism and effectively suppress the fluctuation deviation of product quality. The perception layer network woven by IoT architectures achieves holistic monitoring and real-time analysis of production data. And the integration of smart sensing devices and wireless communication technologies lays the physical foundation for visualized control across the entire value chain. This system empowers enterprises to establish closed-loop management from market monitoring to rapid response, propelling them from passive adaptation to proactive leadership and enabling a leap from survival to growth. On the policy side, governments spearhead standardization efforts by establishing public service platforms and innovation incubators. By defining unified data interfaces and interoperability standards, and following a “standard formulation—pilot validation—full-scale rollout” pathway, they effectively reduce transformation costs while fostering industrial chain collaboration and innovation resource integration.
At present, a large number of scholars have conducted in-depth research around industrial digitization from the meso-level. At the level of theoretical foundation, the value dimension and theoretical logic of industrial digitization have been explored (Xiao and Qi, 2019), at the level of indicator construction, the evaluation index system of industrial digitization at the middle level has been constructed (Fu and Liu, 2021), at the level of economic consequences, the optimization and restructuring of data elements and traditional factors of production of the enterprise have been found by Song et al. (2022) can make industrial digitization have a significant positive impact on the total factor productivity of manufacturing enterprises (Song et al., 2022). Few scholars have studied the construction of the index system of industrial digitization at the micro level and the impact of industrial digitization on the behavior of enterprises at the micro level. Therefore, this paper is based on the theory of involvement to construct the evaluation index system of enterprises' participation in industrial digitization and to determine the index weights and participation indexes by using TOPSIS comprehensive evaluation method based on the weights of the game portfolio. At the same time, according to the National Economy Industry Classification and Codes, China's A-share listed companies are classified into 79 industries, and the degree of participation in digitization of China's industries is calculated by using relevant data and information, and the vertical industry category analysis and horizontal time series analysis of industrial digitization participation are carried out. And finally, based on the theory of industrial organization, the impact of enterprises' participation in industrial digitization on enterprise performance is explored, with a view to putting forward corresponding feasible suggestions for promoting the balanced and high-quality development of China's industries and narrowing the development gap of enterprises' digitization in the industrial chain.
2. Literature review
2.1 Research related to industrial digitization
Industrial digitization, as an important part of the digital economy, mainly refers to the in-depth application of digital technology in existing industries. To improve its production efficiency and competitive advantage, traditional industries use digital technology to upgrade and transform their production process and organizational structure to adapt to the changes in the structure of the modern industrial demand and productivity changes, which is the process of industrial digitization (Teng et al., 2021).
In the per-development period of the digital economy, scholars have studied industrial digitization from different perspectives, with a view to providing theoretical guidance for the integration of the digital economy and the traditional economy. Liu et al. (2019) believe that the input of such new production factors as data capital has a direct impact and spillover effect on the value growth of traditional enterprises (Liu et al., 2019). Xiao and Qi (2019) believe that digital technology, as a newly emerged object, meets the real needs of the main body of the traditional industry, and to a certain extent promotes the improvement of industrial efficiency, the reconstruction of industrial organization, and the upgrading of industrial models (Xiao and Qi, 2019). Yang (2020) believes that the forcing effect of market demand and limited cognition (Yang, 2020) and the innovative leadership of digital technology service providers and industrial digital platforms are important driving modes for traditional industries to undergo digital transformation. At this stage, scholars mainly focus on the qualitative analysis of industrial digitization in terms of its connotation, mechanism and driving mode, which is still in a relatively elementary state.
In 2021, the National Bureau of Statistics (NBS) published the Statistical Classification of the Digital Economy and its Core Industries (2021), which clarifies the concept and connotation of industrial digitization, provides a clear basis for statistics and research on industrial digitization and further promotes the development of industrial digitization. Scholars generally believe that industrial digitization has not only become a key force to promote sustainable economic growth but also opened up a brand-new path to add value to traditional industries. Therefore, the analysis and discussion on the quantification of indicators and the impact of industrial digitization have been carried out from different levels.
In the dimension of indicator quantification, Fu and Liu (2021) constructed the evaluation index system of industrial digitization in the Yangtze River Delta region from the dimensions of digitization foundation and digitization capability at the regional level (Fu and Liu, 2021), Yang (2022) measured and analyzed the degree of industrial digitization of 30 provinces in China from the four dimensions of digital talents, industrial digitization inputs, industrial digitization revenues and digital infrastructures (Yang, 2022); while Song et al. (2022) used the input-output method and calculated the direct dependence of each industry on digital economic factors to measure the digitization level of the manufacturing industry (Song et al., 2022). It can be seen that scholars have mostly constructed the evaluation index system of industrial digitization from a middle perspective, whether from the geographical level or from the industrial level.
In the impact dimension, Song et al. (2022) from the micro enterprise level finds that the deep embedding of data elements in the enterprise R&D and design, marketing and management and other value chain links can accurately understand the multiple needs of customers in multiple scenarios, injecting a strong impetus for the improvement of the total factor productivity of the manufacturing enterprises and becoming a key driving force for enterprise development (Song et al., 2022). In the meso region perspective, Xi and Yang (2024) studies have found that the process of industrial digitization presents a double effect: on the one hand, it strongly promotes regional economic growth, which in turn leads to an increase in regional tax revenues; on the other hand, it results in the blurring of business boundaries, which leads to the phenomenon of regional tax transfers and losses. However, in the long run, industrial digitization can achieve the goal of tax sources and ultimately promote the sustainable growth of regional tax revenues (Wu and Shao, 2006). In summary, both the micro enterprise level analysis and the meso region level investigation can highlight the altruistic characteristics and positive impact of industrial digitization.
Existing literature on the connotation mechanism of industrial digitization, the construction of middle evaluation index system and the micro impact effect has made some progress, but there are still the following deficiencies: first, the research perspective. For the analysis of industrial digitization, scholars mostly focus on the meso and macro perspective and few explore the participation level and distribution status of enterprises in industrial digitization from the micro perspective. Second, the problem of indicator construction. For the construction of evaluation index system of industrial digitization, scholars mostly stay at the middle level, while enterprises, as the micro constituent elements of the industry, whose development situation and strategic decisions profoundly affect the development trend of the industry as a whole, have seldom been explored in depth about their position in the industry and their participation in the process of industrial digitization. Third, the scope of research on the economic consequences of enterprises. Research on the economic consequences of micro-enterprises mainly focuses on some industrial groups or regional levels, and there is a lack of large-sample empirical tests on the differences in the economic consequences of enterprises in different industries. Based on this, this paper will construct the evaluation index system of industrial digitalization participation and sort out the industrial distribution of enterprises in the industrial chain at the micro level, so as to explore the digital participation of different industries and further study the impact of industrial digitalization participation on enterprise performance.
3. Analysis of the concept and composition of the industrial digitalization participation
3.1 Concept definition of industrial digitalization participation
In the era of the consumer Internet, digital technology starts by connecting people and linking individuals with information. By addressing information asymmetry, it enhanced consumer experiences and efficiency, primarily creating value at the circulation and consumption ends. This gave rise to the platform economy, which reshaped commercial and social models. Its value extraction focused mainly on the consumption end, product circulation and marketing channels, while the penetration and transformation of core industrial links such as production and manufacturing, supply chain and enterprise management are relatively limited.
Driven by national strategies like “Made in China 2025” and the widespread adoption of IoT technology, we entered the Industrial Internet era. Building upon the cloud computing and big data infrastructure and technological concepts developed during the Consumer Internet phase, platforms expanded beyond connecting people to connecting objects and machines. This phase achieves comprehensive connectivity and intelligence across all industrial elements, the entire industrial chain and the full value chain – linking people to machines, machines to machines and enterprises to enterprises. Data elements now penetrate deeper into core manufacturing processes, addressing efficiency, quality and flexibility challenges. Application scenarios have shifted from the consumer end (C-end) to the core manufacturing domain (B-end). Data-driven value has also evolved from marketing and distribution to core functions like R&D design, production manufacturing and operational management.
Industrial digitalization represents the outcome of industrial Internet concepts and technologies deeply penetrating and converging with other industries. By leveraging data connected and accumulated through industrial Internet platforms, combined with artificial intelligence and blockchain technologies, the more in-depth intelligent analysis and applications can be conducted, thereby enabling all-round, full-chain and all-element digital transformation and reconstruction of the entire industry or multiple related industries.
According to the theoretical framework of the Industrial Internet Enabled Industrial Chain Supply Chain White Paper, the industrial chain system can be defined as a composite ecosystem with high flexibility and robustness formed on the basis of the industrial ecological network and constructed through the dynamic coupling of the four-dimensional space of the supply-demand chain, the spatial chain, the enterprise chain and the value chain (Wu and Shao, 2006). The system re-configures the new partnership between upstream and downstream enterprises through industrial Internet technology, realizes the intelligent integration and visualizes control of information flow, logistics and capital flow and thus drives each node of the industrial chain to realize the multiplier effect of value appreciation. The essence is to build an adaptive industrial value co-creation network based on all-factor digital synergy and dynamic optimization of resource allocation efficiency. Based on the above analysis, this paper believes that industrial digitalization participation refers to the pioneering enterprises through the research and development of innovative digital technology, or build a digital platform, or play a technology demonstration role, for the digital transformation and upgrading of other enterprises in the industry empowerment and other enterprises embedded in the pioneering enterprises in the digital platform, not only to enrich the platform data resources, so that the platform can understand and analyze the dynamics of the industry and the market demand in-depth and also to be able to enrich the ecosystem of the digital platform, form diversified partnerships, and then promote the collaborative development of the upstream and downstream of the industry chain to create a good industrial digital ecosystem.
3.2 Definition of what constitutes digital participation in industry
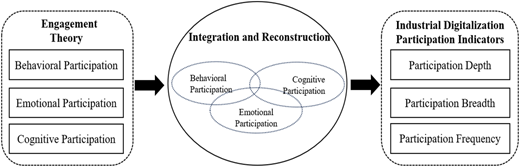
This paper refers to the “Engagement Theory” from educational psychology (Astin, 1999) to deconstruct participation in industrial digitalization across three dimensions: behavior, emotion and cognition. Although this theory initially focused on understanding the time and effort students invest in learning through psychological and physiological engagement, its core “multidimensional investment-interaction-output” framework offers equally insightful analysis for organizational behavior. Strategic decisions made by organizations in participating in industrial digitalization follow similar logic, requiring resource allocation and interaction among industrial organizations through concrete actions, strategic understanding and cultural commitment.
As “fictitious entities,” enterprises lack direct consciousness or emotions. Their “cognition” and “emotion” must be indirectly manifested through observable, explicit “behavior.” Unlike natural persons, a firm's “cognition” is no longer a cerebral activity but rather a repository of knowledge and strategic interpretation (Ocasio, 1997), manifested through the background, experience and cognitive patterns (Hambrick and Mason, 1984) of its executive team, the structure of its patents, and the choices of strategic partnerships. Corporate “emotions” are no longer psychological experiences but cultural commitments and organizational identities (Dutton et al., 1994). The tone and sentiment embedded in official documents like annual reports reveal an organization's conviction, passion and resolve toward its digital future. Methods such as text sentiment analysis (Short et al., 2010) can effectively capture these organizational-level “emotional” tendencies. Ultimately, all these elements must manifest in observable, measurable “behavior.” By appropriately integrating cognition and emotion into action, we achieve a fusion and reconstruction involving behavioral, emotional and cognitive engagement.
Considering that industrial digitalization represents the deep penetration and integrated development of industrial Internet concepts and technologies into other sectors. In this process, enterprises participate in the digital ecosystem through differentiated models based on their resource endowments and strategic positioning. Their specific behaviors can be deconstructed and categorized across three dimensions: Participation depth reflects the level of involvement and investment of actors in industrial digitalization, indicating the significance of their participation and their degree of dependence on external actors (Pei and Ying, 2019); Participation breadth signifies the scope of an actor's involvement in industrial digitalization and the number of permitted partners, reflecting their level of supply chain collaboration and the diversity of digital technology applications; Participation frequency indicates the regularity of digital cooperation between an actor and its partners, revealing the intensity of interaction within supply chain collaboration and the frequency of digital business operations.
Therefore, this paper appropriately integrates cognitive and affective dimensions into behavioral representation. By systematically deconstructing the observable digital “behavioral” characteristics of enterprises, it constructs a three-dimensional measurement system comprising “participation depth,” “participation breadth,” and “participation frequency.” This approach comprehensively and multidimensionally characterizes the participation level of enterprises in the industrial digitalization process, as shown in Figure 1.
Based on the above connotation of industrial digitalization participation and the division of participation dimensions, this paper defines industrial digitalization participation as the following 11 parts: knowledge depth, technology demonstration, embedding depth, knowledge flow, knowledge breadth, technology service, talent leadership, technology spillover, main body cooperation, strategic cooperation and demonstration intensity.
Knowledge depth. Knowledge depth refers to the specialization level of an enterprise in a specific digital technology field, that is, the density of digital patents that the enterprise possesses in the technological field. High-quality breakthroughs in core digital technology can promote the overall digitization process of the industrial chain, thereby enhancing the depth of the enterprise's participation in the digitization of the industry.
Technology demonstration. Technical demonstration refers to whether an enterprise has been rated as a digitalization demonstration enterprise by the Ministry of Industry and Information Technology for the purpose of promoting its experience. Through the mechanism of coercion, standardization and cognitive isomorphism, converting policy pressure into industry standards and collective actions can restructure enterprises' perception of the value of digitalization, thereby accelerating the process of industrial digitalization.
Embedding depth. Embedding depth refers to the depth of enterprises' access to the industrial Internet platform, reflecting their network embeddedness and synergistic relationship in the industrial chain (Dutton et al., 1994). The deep embedding of entity enterprises in the industrial Internet platform not only strengthens the connection strength of the core nodes but also reduces the collaboration friction through standardized data interaction protocols and promotes the targeted diffusion of technology and knowledge in the network. At the same time, platformed embedding can also transform discrete enterprise nodes into digital communities.
Knowledge flows. Knowledge flow refers to the degree of spillover of enterprises' digital patent technologies, which is measured by the citation rate of enterprises' digital patents. Among them, large enterprises expand their ecological influence through digital technology spillover, while small and medium-sized enterprises (SMEs) rely on platform capabilities to rapidly acquire digital capabilities, and ultimately, through the exchange of complementary resources between nodes, the whole industrial chain is promoted to realize the leap from “mechanical link” to “intelligent emergence.”
Knowledge breadth. Knowledge breadth refers to the diversity of digital technology coverage owned by an enterprise (Dutton et al., 1994). The greater the breadth of an enterprise's technological coverage, the higher the possibilities for its upstream and downstream partners in terms of digital resource docking, technological adaptation and scenario synergy.
Technology services. Technical service refers to the enterprise through the construction of an intelligent digital platform, integration of cloud computing, big data, IoT and other cutting-edge technologies, for the industry chain upstream and downstream partners to provide a synergistic empowerment system covering technical support, resource sharing, data interoperability and other dimensions.
Talent leadership. Talent leadership refers to the situation where executives with an information technology background can identify the digital potential of the enterprise and formulate corresponding digital strategies. Furthermore, if these executives also hold management positions in other enterprises within the industry, they will transfer their digital insights through explicit or implicit pathways to the associated enterprises, facilitating the formation of a “cognitive community,” reducing the coordination costs for the entire industry's digital transformation, and thereby promoting the digitalization process of the entire industry.
Technology spillover. Technology spillover refers to the synergistic effect of enterprises through upstream and downstream digital cooperation in the industrial chain, accelerating the digital technological innovation of other enterprises in the industry. Furthermore, through the complementation of resources and ecological co-construction, it can strengthen the network centrality of enterprises in industrial digitization, thus expanding the breadth of their participation.
Main body cooperation. Main body cooperation refers to the cross-organizational innovation alliance through digital patent joint research and development, technical standards co-construction and other modes, breaking the resource barriers between innovation subjects and realizing the cross-border flow of complementary digital resources, thus bridging the fault line of industrial digital technology application.
Strategic cooperation. Strategic cooperation refers to the long-term digital ecological collaboration between enterprises. High-frequency and business collaboration not only reflect the density of enterprises' response to industrial change but also continue to expand the depth and breadth of digital participation through ecological position repositioning.
Demonstration intensity. Demonstration intensity is a key indicator to measure the sustained leading ability of enterprises in the digital transformation benchmarking selection, which is specifically expressed as the density of enterprises selected in the list of digital demonstration enterprises of MIIT. By quantifying the frequency of enterprises on the list and the continuity of their continuous selection, it can accurately map the benchmarking status of enterprises in the wave of industrial digitization and the innovation leading to effectiveness.
4. Construction of the industrial digitalization participation index
4.1 Construction of the industry's digital participation indicator system
Based on the previous definition of the composition of industrial digitization participation, the industrial digitization participation index system is constructed here, which contains 3 first-level indicators and 11 second-level indicators. The selection of the index system is based on the research on industrial digitization in the main literature, and combined with the on-site research and interviews with Changan Automobile and its upstream and downstream case enterprises, the related conceptual indicators are screened out. The industrial digitization participation is classified: the first-level indicators divide industrial digitization participation into participation depth, participation breadth and participation frequency, and the second-level indicators are the refinement of the first-level indicators, in which the participation depth includes knowledge depth, technology demonstration, embedding depth and knowledge flow, the participation breadth includes knowledge breadth, technology service, talent leadership and technology spillover, and the frequency of participation includes main body cooperation and strategic cooperation, demonstration intensity. Furthermore, a measurable indicator system is constructed from both quantitative and qualitative dimensions.
4.2 Data processing and determination of indicator weights
4.2.1 Data processing
In this paper, A-share listed companies from 2017 to 2023 are selected as research samples, and according to the index system determined in Table 1, quantitative data are obtained from the China Research Data Services Platform, the official website of the Ministry of Industry and Information Technology (MIIT), the Wind Economic Database and the China Stock Market Accounting Research, and the natural language processing technology is applied, and the full text of the annual reports of the A-share listed companies from 2017 to 2023 is mined using Python programming, and the keywords are identified automatically through the TF-IDF weighting algorithm to realize the automatic identification of keywords and establish a time series word frequency database for multi-dimensional statistical qualitative analysis.
4.2.2 Determination of indicator weights
In this paper, we adopt the game combination weights (Lai et al., 2015) to assign weights to 11 secondary indicators and use the TOPSIS comprehensive evaluation method (Lv et al., 2024) to score the industry digitization participation of A-share listed companies from 2017 to 2023, with the following steps:
- (1)
Assessment of indicator relevance assignment
- •
Standardization of assessment indicators
There are 11 assessment indicators in this paper, denotes the original data of the j indicator of the i enterprise, and denotes the normalized data of the j indicator of the i enterprise, considering that the 11 second-level indicators in this paper are positive indicators, i.e., the higher the data of the indicator, the better, so we use formula (1) to normalize it.
- •
Assessment of the informativeness of indicators
The correlation coefficient between the j indicator and the indicator is , which is a statistical indicator that reflects the degree of correlation between indicators.
represents the standard deviation of the j indicator, represents the standard deviation of the indicator.
Second, calculate the total conflict between the j indicator and all other indicators , Indicates a negative correlation between the two indicators, which in turn yields the amount of information contained in the j indicator.
- •
Objective weighting of assessment indicators
Calculation of objective weights for the j indicator, (Superscript k indicates method number)
In summary, the objective weights of each secondary indicator can be obtained by correlation assignment , k = 1. Relevance assignment focuses on emphasizing the correlation between indicators, the stronger the correlation, the less conflict between the indicator and other indicators, the more the same information is reflected, and the more repetitive the evaluation content can be reflected, so the weight assigned to the indicator should be reduced, which has the advantage of avoiding double-counting of the indicators, but there are still some deficiencies in the assessment of the indicators to improve the difficulty, in this regard, the difficulty assignment method should be introduced to optimize the correlation assignment.
- (2)
Difficulty assignment of assessment indicators
The indicator difficulty assignment mainly uses the deviation of the indicator's great value from the mean value to increase the difficulty, the specific steps are as follows.
- •
Calculate the standard deviation of the j indicator using normalized data
- •
Assess the degree of deviation of the indicator's extreme values from the mean
where is the indicator value, i.e., the original data of the j indicator of the i enterprise, and denotes the standard deviation.
- •
Objective weighting of assessment indicators
Normalizing yields indicator weights :
According to the above formula, to get the objective weight of the indicator difficulty assignment to get the objective weight of each secondary indicator , k = 2. The weight of the indicator obtained by applying the difficulty assignment, the greater the degree of deviation of the indicator, and the greater the corresponding weight, so it has a certain effect on improving the positive aspects of the assessment of the indicator. However, in some cases, the lower the difficulty of improving the indicator, i.e., the smaller the degree of deviation, the higher the importance of the indicator, so there are certain limitations.
- (3)
Game portfolio empowerment [1]
To balance the different impacts of correlation assignment and difficulty assignment on the indicators, this paper introduces the game combination assignment to combine the two and determines the optimal parameter model by minimizing the difference between the actual observations and the model predictions.
- •
Consistency testing
To avoid the conflict between relevance weight and difficulty weight in combination, this paper adopts consistency test to analyze the results obtained by the above two assignment methods. Because the gap between the weight results of different assignment methods is too large is one of the main reasons that lead to problems in the combination of assignment results; therefore, this paper in a consistency test through the distance function to determine whether the weights meet the conditions of the combination.
After testing, the distance between the correlation weights and the difficulty weights is 0.42, which satisfies 0 . The consistency test is passed, and the combination can be assigned.
- •
Linear combinations of weights
Let the relevance weight coefficient and the difficulty weight coefficient be and , respectively, then the linear combination of weights is:
- •
Establishing a system of linear equations
Optimizing and with the objective of minimizing the divergence, there are:
where
Based on the differential properties of matrices, find the first-order derivatives of the above formulas and set up a system of linear equations.
- •
Solve for portfolio weights
weighting factors normalized by,
The optimal combined portfolio weights are,
It should be noted that the portfolio weighting model employed in this paper essentially treats correlation weights and difficulty weights as two game participants. By minimizing the total deviation between these two factors and the portfolio weights, it seeks a Pareto optimal solution. This process ensures that the final weights reflect both the information overlap among indicators and the difficulty of distinguishing between them. To validate the robustness of this method, a sensitivity analysis was conducted:
Weight Sensitivity
A 1000-round Monte Carlo simulation was conducted with random perturbations of 5% and 10% applied to the portfolio weights. Results indicate that the average coefficient of variation (CV) for the industrial digitalization participation index was 2.71% and 5.45%, respectively. For the 5% random disturbance, 89.07% of samples exhibited a CV below 5%, while for the 10% disturbance, 61.54% of samples remained below this threshold, demonstrating robust stability. However, the analysis also identified a large number (1,964) of samples with extremely low digital participation levels, exhibiting near-zero performance across all indicators. This makes their scores relatively sensitive to weighting changes. This precisely confirms the existence of a digital divide in China's industrial digitalization process – where some enterprises have deeply engaged in the digital wave while others have yet to initiate substantive digital transformation. This finding further validates the assessment results and highlights the key target group for policy attention: enterprises with zero or extremely low digital engagement.
Method Sensitivity
To validate the sensitivity of evaluation results to weighting calculation methods, we recalculated the Industrial Digitalization Participation Index using both the Entropy Weighting Method and the CRITIC Method. These results were then subjected to Spearman rank correlation analysis against the benchmark game-theoretic combination weights. As shown in Table 2, the correlation coefficients between the indices derived from both alternative methods and the benchmark index exceeded 0.9 and were statistically significant at the 1% level. Notably, the CRITIC method yielded a correlation coefficient as high as 0.9977, indicating that objective weighting methods grounded in different theories produced nearly identical evaluation outcomes. Second, although the entropy weighting method's correlation was relatively lower, its value remained exceptionally high, fully validating the robustness of the core conclusions. Furthermore, the minor discrepancy between the entropy weighting method's results and the benchmark stems from its theoretical limitation of considering only indicator variability while ignoring inter-indicator correlations.
In summary, the industrial digitalization participation index constructed in this paper is insensitive to the choice of weighting calculation method, yielding highly reliable evaluation results.
4.2.3 Comprehensive evaluation of the TOPSIS method [2]
TOPSIS method is a comprehensive evaluation method to rank the order of advantages and disadvantages of the objects according to the Euclidean distance between the evaluated objects and the ideal solution and the negative ideal solution, the closer the ideal solution and the further the negative ideal solution, the better the object is. It should be noted that the weights used in the TOPSIS method in this paper are game portfolio weights.
The weighted normalized matrix Z is obtained from the normalized data in the correlation assignment and the weights in the game portfolio assignment.
Determine the positive and negative ideal solutions. Positive ideal solution means that each indicator reaches the best value in the sample, and a negative ideal solution means that each indicator is the worst solution in the sample.
Calculate the Euclidean distance, the distance of each evaluated object from the positive and negative ideal solutions.
Calculation of the closeness of each evaluation object to the optimal solution .
where the value range of is [0, 1], the closer to 1, indicating that the sample score is better. It should be noted that in order to enhance the comparability of the data, this paper adopts the linearized proportional transformation method to expand the range of values of by 100 times, i.e., the range of the comprehensive score of industrial digitalization participation indicators is [0, 100].
5. Calculation results and analysis of the industrial digitalization participation index
5.1 Qualitative analysis of industry distribution
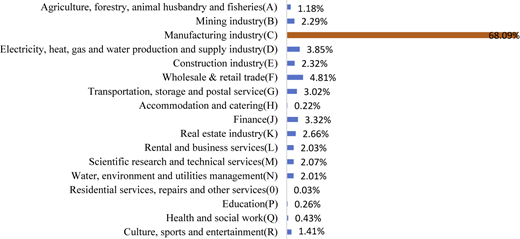
In this paper, basic data such as stock codes and industry codes of all A-share listed companies from 2017 to 2023 are obtained from the database of China Stock Market Accounting Research, and the network mapping of enterprises in the industry chain is constructed by taking all Chinese A-share listed companies as the points of the industry chain network. Specifically, in this paper, first, in the basic information table, ST and *ST enterprises are excluded, and enterprises are clustered into 81 industries according to the National Economic Industry Classification and Code. Considering that industrial digitization is an intelligent transformation process with high penetration of digital technology in traditional industries, it promotes the in-depth application of digital technology in the fields of R&D and design, production process, operation and management and industrial ecology. And digital industry empowers traditional industries to carry out digital transformation, provides digital solutions for the technological innovation needs of traditional industries and bottlenecks in industrial development and expands the application scenarios of digital technology is the research scope of digital industrialization, therefore, this paper excludes from the research samples, in accordance with the “Statistical Classification of the Digital Economy and Its Core Industries (2021)” issued by the National Bureau of Statistics, the industry code of “I63,” “I64,” “I65,” and “C39” digital industries (Lai et al., 2015), need to be It should be noted that, because the “S91” industry composite contains some digital industry enterprises, this paper will be excluded together, and finally get 79 industry segments. Additionally, to enhance the visualization of industrial digitalization participation, this paper clusters 79 sub-industries into 17 major categories to illustrate their distribution.
Figure 2 shows the distribution of enterprises across 17 industries. As illustrated, the majority of companies are concentrated in the manufacturing sector, accounting for as much as 68.09% (the brown area in the diagram), aligning with China's actual industrial structure. Manufacturing is the lifeblood of the national economy. For the majority of A-share listed companies operating in manufacturing, industrial digitalization can significantly enhance production efficiency, provide innovative technological means for corporate transformation and upgrading, optimize supply chain management, help enterprises adapt to dynamic market environments and propel China's transition from a manufacturing giant to a manufacturing powerhouse.
5.2 Integral analysis of industrial digitalization participation
5.2.1 Trend analysis of industry categories
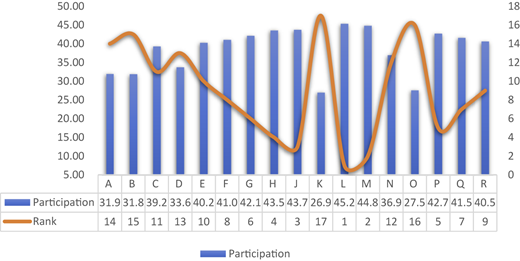
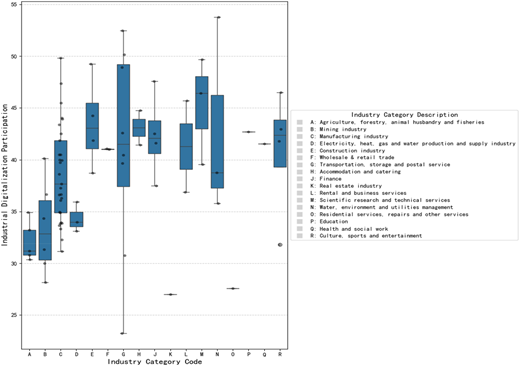
The index and ranking of the digital participation of each industry are shown in Figure 3. Overall, there is not much difference in the degree of digitization participation among industries, which are all distributed around 40 but below 50, indicating that the degree of digitization participation among industries in China is roughly equivalent and low. It should be noted that the real estate industry (K) and the residential service, repair and other services industry (0) are the lowest, only about 26, and 40% different from the highest participation level of the leasing and business services industry (L). The possible reason for this is that the service content of the residential services, repairs and other services industry (e.g., housekeeping, beauty salon, cleaning, maintenance, etc.) relies mostly on manual experience, which is difficult to completely replace through standardized processes, leading to limited application scenarios for digital tools. Second, the industry is dominated by small and medium-sized micro-economies, lacks the support of large-scale enterprises and has a weak ability to invest in capital and technology. The real estate industry (K), on the other hand, has a long iterative cycle of digital technology due to its heavy asset attributes and low-frequency transaction scenarios are difficult to support high-frequency digital interactions, resulting in a low degree of digital participation.
In addition, the box plots reveal significant disparities across industries, with marked differences in digital participation rates among various sectors. The highest value (53.76) in Water Supply, Environmental Protection and Public Utilities Management (N) is 2.3 times that of the lowest value (23.25) in Transportation, Warehousing and Postal Services (G). Second, significant internal variation exists within industries. The greatest disparity is observed within Transportation, Warehousing and Postal Services (G), with a range of 29.22, while the smallest variation is found within Agriculture, Forestry, Livestock and Fisheries (A), with a range of 4.56. Furthermore, highly digitized industries tend to cluster. Technology-intensive sectors (G, N, M, J, etc.) generally exhibit higher levels of digital participation, while traditional industries (A, B, D, etc.) show relatively lower digital engagement.
5.2.2 Analysis of changes in time dynamics
Table 3 presents a summary of the industrial digitalization participation index of 17 industries from 2017 to 2023. From an overall perspective, the digital engagement of most industries shows a slow upward trend during 2017–2023, with an average annual increase of about 1–2 points. Compared with other industries, culture, sports and entertainment (R), increased from 33.93 to 45.39, with a larger increase of 33.8%, probably benefiting from the promotion of new entertainment formats such as online entertainment and live streaming; the manufacturing industry grew at an average annual rate of 1.8 points, and the growth rate accelerated after 2020, which is directly related to the popularization of the industrial Internet platform, reflecting the effect of the promotion of China's smart manufacturing policy. The growth rate of agriculture, forestry, animal husbandry and fishery (A) is slower, reflecting the difficulty of agricultural digitization penetration.
5.3 Analysis of industrial digitalization participation first-level indicators
5.3.1 Analysis of the depth of digital participation in the industry
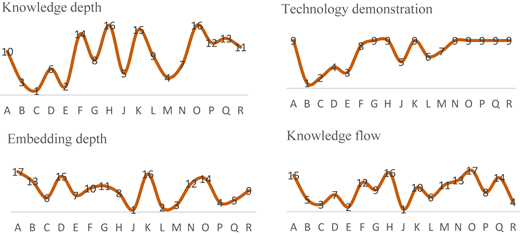
The depth of participation of enterprises reflects their level of involvement and investment in industrial digitalization participation, which contains four secondary indicators, namely, knowledge depth, technology demonstration, embedding depth and knowledge flow. Table 4 lists the scores and rankings of the depth of industrial digitalization participation, and Figure 4 demonstrates the rankings of each secondary indicator in the industry.
As shown in Table 4, the three industries of Finance (J), Rental and business services (L) and Scientific research and technical services (M) ranked the most highly, the possible reason being that technologies such as block chain and big data wind control are deeply embedded in the core business processes, which makes the digitization penetration rate of each enterprise in the finance industry (J) high; although the manufacturing industry (C) ranked the sixth, it scored high in the knowledge depth, which reflects that the high intensity of technological research and development and the efforts to upgrade the industry from Made in China to Made with Wisdom;
Agriculture, forestry, animal husbandry and fisheries (A) scored significantly lower than other industries, while electricity, heat, gas and water production and supply (D) lagged behind in digitization inputs due to a long cycle of technological updating and constraints imposed by the inertia of infrastructure investment.
As can be seen in Figure 3, manufacturing (C) and construction (E) have the highest knowledge depth scores, financial (J) and leasing and business services (L) have the highest embedded depth scores, mining (D) and manufacturing (C) have the highest technology demonstration scores and financial (J) has a higher knowledge flow score, the probable reason for this is that mining (B) and manufacturing (C), due to their technology-intensive industry attributes and Policy-driven, enterprises need high-density patent layout and core technology breakthroughs, through patent barriers to consolidate their competitive advantages and then form a technological depth advantage; electricity, heat, gas and water production and supply industry (D), manufacturing industry (C) are the key areas for implementing the “Made in China 2025” national strategy. Among them, smart grid and new energy consumption are the core areas of the “double carbon” goal, while the construction of smart manufacturing demonstration factories and industrial Internet platforms is the way for “Wisdom in China” to move toward “Made with Wisdom”. The financial industry (J), as the core support and important bloodline to serve the high-quality development of the real economy, has the industry characteristics and regulatory requirements of openness and synergy and digital technologies such as blockchain and big data risk control are cited by cross-industry, with high knowledge mobility.
5.3.2 Analysis of the breadth of digital participation in the industry
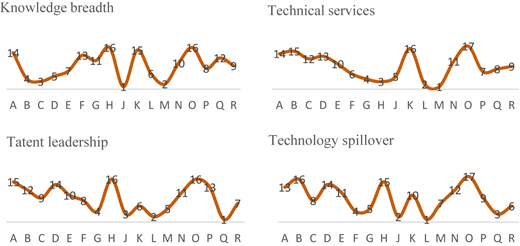
The breadth of an enterprise's participation reflects the business scope it covers in the industry's digital participation and contains four secondary indicators: knowledge breadth, technology spillover, talent leadership and technical services. Table 5 lists the scores and rankings of the breadth of the industry's digital participation, and Figure 5 illustrates the rankings of each secondary indicator in the industry.
As shown in Table 4, the industries of scientific research and technology services (M), leasing and business services (L), accommodation and catering (H) and transportation, warehousing and postal services (G) are ranked the most highly and the probable reason is that the scientific research and technology services industry involves cutting-edge fields such as ABCD digital technology and enterprises need to lay out their patents in multiple technological fields to form a broad technological matrix, which in turn simultaneously provide AI algorithms, block chain deposits and industrial IoT solutions for multiple industries; the leasing industry relies on sharing economy platforms such as shared office and equipment leasing to achieve multi-scenario coverage; the transportation industry scores high in breadth due to the wide application of smart logistics systems, such as the Cainiao Network; and the lodging and catering industry (H) benefits from e-commerce platforms such as Meituan, Ctrip and Tik Tok to achieve multichannel coverage and integration.
The residential service industry and real estate industry are limited in expanding their digital scenes due to offline service dominance and asset-heavy industry attributes.
As can be seen in Figure 6, the financial industry (J) and the scientific research and technology services industry (M) have the highest knowledge breadth scores; the scientific research and technology services industry (M) and the leasing and business services industry (L) have the highest technology services scores; the health and social work industry (Q) and the leasing and business services industry (L) have the highest talent leadership scores and the leasing and business services industry (L) and the financial industry (J) have the highest technology spillover scores. The highest score may be due to the fact that the leasing and business services industry (L) is naturally endowed with platform attributes, such as WeWork, a shared office platform and tax SaaS service providers, etc. The platform economy ecology in the industry is dominant, and the technology spillover effect is formed through the empowerment of upstream and downstream enterprises through open APIs, data platforms and other technologies; furthermore, the business services industry needs to dock with multiple industries, such as the manufacturing industry and the retail industry, to promote cross-domain technology export and to promote cross-domain technology export. Furthermore, the business services industry needs to interface with multiple industries, such as manufacturing and retailing, to promote cross-disciplinary collaborative innovation through technology output; the health and social work industry (Q) needs technical executives with cross-disciplinary backgrounds in computer science, bio-informatics, etc., to help hospitals promote the electronic medical record and remote diagnosis and treatment system for landing.
5.3.3 Analysis of the frequency of digital participation in the industry
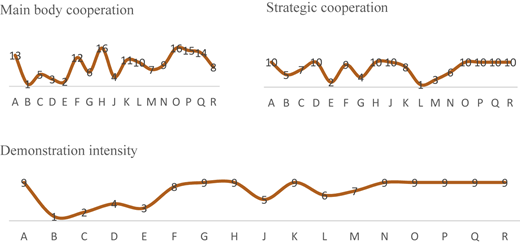
The participation frequency of enterprises reflects the frequency of their cooperation with their partners in digitization in industrial digitalization participation, which contains three secondary indicators, namely, main body cooperation, strategic cooperation and demonstration intensity. Table 6 shows the scores and rankings of industrial digitalization participation frequency, and Figure 7 demonstrates the rankings of each secondary indicator in the industry.
As shown in Table 4, the three industries of construction (E), leasing and business services (L) and mining (B) ranked the most highly, possibly because the construction industry needs to realize digital synergy with multiple partners, such as suppliers and builders, for example, Dongfang Rainbow builds a supply chain management platform to realize efficient synergy in all aspects from procurement to production, sales and logistics; the leasing industry adopts a digital platform to The leasing industry realizes resource integration and adopts the sharing economy business model to improve the efficiency of resource utilization; the mining industry adopts digital technology, such as IoT sensors and AI risk warning system to monitor environmental data in real time and reduce the accident rate, and in addition, China's “Intelligent Mining Construction Guidelines” explicitly requires that the rate of large-scale mining intelligence exceed 50% in 2025, which can be seen as the immediate need for safety and the requirements of the policy to force the Mining companies to actively launch a large number of digital cooperation with digital native companies.
The residential service industry, agriculture, forestry, animal husbandry and fishery industries are almost blank in digital interaction due to the industry characteristics of low-frequency and seasonal demand for their services; the health and social work industry and the education industry have a low degree of marketization due to their strong public attributes and the decision-making process relies on administrative approvals and has less flexibility in cooperating with enterprises.
As can be seen in Figure 4, the mining industry (B) has the highest scores for demonstration intensity and main body cooperation, and the leasing and business services industry (L) has the highest score for strategic cooperation, which may be due to the fact that the government leads the demonstration project and requires enterprises to adopt digital technology and encourages piloting through subsidies. In addition, the chain master enterprise leads the industry standard and promotes the collaboration of upstream and downstream enterprises in the construction of a digital ecosystem. The leasing industry is a light-asset sector that relies on cross-industry resource integration and needs to form strategic alliances with enterprises such as manufacturers, financial institutions, and digital service providers. For example, Didi has launched strategic cooperation with a number of car leasing companies, driver service companies, OEMs and financial institutions.
6. Empirical analysis of the economic consequences of industrial digitalization participation on enterprises
For verifying the effectiveness of the evaluation index of industrial digitalization participation index system, this paper explores the relationship between industrial digitalization participation and enterprise performance with the help of the SCP analysis framework in industrial organization theory and empirically tests it by using a fixed effect model.
6.1 Theoretical analysis
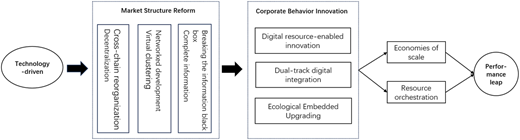
The traditional SCP paradigm emphasizes the basic logic that market structure acts on market performance through the intermediary of enterprise behavior. In the context of digital economy, digital technology has reconstructed the path of “structure-behavior-performance,” forming a new conduction mechanism of “technology-driven→ structural change→ behavioral innovation→ performance leap.” This paper focuses on the mechanism of enterprise participation in industrial digitization on its performance level and constructs the theoretical model shown in Figure 8.
The penetration of digital technology has triggered a triple structural change: first, the integration and development of the “Internet +” model with traditional enterprises has realized the decentralization of the organizational structure, thus giving rise to a distributed information production network. At the same time, the “pyramid” structure formed by the traditional strong incumbent enterprises is gradually disintegrated, and the atomized participation mechanism of users makes the value creation nodes spread from the core enterprises to the whole domain of the industrial chain, and the industrial chain value chain links are further deconstructed, which makes the “cross-chain” reorganization possible, which makes it possible for enterprises to create value through cross-chain reorganization. This creates structural conditions for enterprises to obtain excess returns through cross-chain synergy (Zhao and Peng, 2018b). Second, the virtual agglomeration system constructed by the industrial Internet platform with the IoT as the carrier breaks through the hard constraints of geographic space on the allocation of production factors, giving rise to the development of industrial organization network. Real-time data flow enables enterprises to dynamically optimize the production function and achieve the compound effect of economies of scale and scope through the elastic expansion and contraction of virtual organizational boundaries (Wang et al., 2018). Third, the holographic information network constructed by the ABCD (artificial intelligence, blockchain, cloud computing and big data) technology group has effectively cracked the “information black box” in the traditional industry. Through real-time market signal capture and intelligent decision-making response, enterprises can reduce transaction costs and trial-and-error costs, laying the efficiency foundation for performance improvement.
In the reconfigured market structure, enterprises achieve performance breakthroughs through three types of differentiated behaviors: first, digital resource-enabling innovation. Digital native enterprises, such as UFIDA and Sany Heavy Industry, have transformed digital assets into tradable enabling services by opening up API interfaces and technology platforms. This kind of “technology overflow” behavior can not only obtain technical service income, but also enhance user stickiness through the ecological network effect. Second, dual-track digital integration. The exogenous participants of the ecosystem, i.e., industry incumbent enterprises that originated and deeply cultivated in traditional scenes, and at the same time have independent value creation ability (Jiaming et al., 2025), adopt the dual-track strategy of “external synergy + independent innovation.” Externally, they absorb digital resources through strategic alliances, and internally, they build their own digital platforms, such as SDA architecture, to precipitate their core capabilities. This “introduction-digestion-re-innovation” path not only reduces the cost of digital transformation and the speed of product iteration but also directly improves financial performance through efficiency improvements. Third, ecological embedded upgrading. In the initial stage, endogenous digitization players mainly rely on the platform ecosystem, effectively integrate the platform's core technology resources and market dominance by deeply embedding into the native system architecture and realize value symbiosis in strategic opportunity areas. This in-depth synergy mechanism significantly improves the utilization efficiency of ecological resources and forms a benign synergy effect. As the ecological development enters the expansion period, faced with the challenges of internal resource dilution and increased homogeneous competition leading to the steep increase in the pressure of value creation, the endogenous players initiate strategic upgrading, focus on the development of external ecosystems of differentiated resources and ultimately realize the strategic leap from “ecological follower” to “main body of independent innovation” through the construction of an independent technological system and a unique value proposition, completing the upgrading of the digital value chain (Mei and Wang, 2024).
Based on the above mechanism, this paper proposes the research hypothesis that enterprises' participation in industrial digitization can significantly enhance their market performance level.
6.2 Data and models
6.2.1 Data and sample
This paper takes 4,667 research samples of A-share listed companies from 2017 to 2023 for regression analysis. It should be noted that in 2017, the State Council issued the “Guiding Opinions on Deepening the ‘Internet + Advanced Manufacturing’ and Developing the Industrial Internet,” which for the first time clarified the strategic position of the industrial Internet and proposed to build three major systems of network, platform and security and set the development of manufacturing informational and intellectualism as a major strategic goal. Furthermore, considering the completeness of the data, this paper chooses 2017–2023 as the sample interval for the study. Considering the validity of the sample, the sample is processed according to the following principles: (1) excluding companies in the finance and insurance industry; (2) excluding ST or *ST companies; and (3) excluding the sample of observations with missing data; finally, a total of 24,507 observations are obtained. The data are from the China Research Data Service Platform, MIIT website, China Stock Market Accounting Research and Wind Economic database. The up and down 1% winsorizing is applied to all continuous variables.
6.2.2 Benchmark model setting and variable measurement
The econometric model constructed in this paper is shown in formula (1), where the explanatory variable is the level of industry digitization participation of enterprise i in year t, the explanatory variable is the performance of the enterprise, represents all the control variables, are the industry fixed effects and time fixed effects, respectively, and represents the unpredictable disturbance term in it.
The core explanatory variable is the comprehensive score of industrial digitalization participation index system (Indpart), this paper adopts the TOPSIS method based on the game portfolio empowerment to carry out a comprehensive evaluation of the industrial digitalization participation index system and calculate the comprehensive score.
The explanatory variable is enterprise performance (Perform). This paper refers to Zhang et al. (2021); the total net profit margin of assets (JROA) is used to measure enterprise performance, which is mainly used to reflect the profitability of the enterprise. Considering the robustness of the results, this paper also adopts the return on assets (ROA) and the return on equity (ROE) as the alternative measure of enterprise performance.
The control variables include Size, Corporate ownership, Growth, Liquidity, Fixed assets ratio, Intangible assets ratio, Risk, Market power, Industry Competitiveness, Industry growth potential and Market index. Among them, Industry Competitiveness, Industry Growth Potential and Market Index mainly control the degree of competition, growth and marketization at the industry level. Further, the intensity of industry competition may have an impact on firm performance, which is measured in this paper by using 1 minus the Herfindahl index and the larger the value indicates that the industry is more competitive (Zhang et al., 2021), industry growth potential is defined as the growth rate of operating income in this industry, and the larger the value, the greater the growth of the industry (Lian et al., 2012); the marketization index is collected the 2017–2023 total marketization index from Fan Gang's Marketization index report (Jiaming et al., 2025). Descriptive statistics are shown in Table 7, and there are no significant differences among the main variables.
6.3 Regression analysis
The results of the empirical test of the model are shown in Table 8, column (1) shows the effect of industrial digitalization participation (Indpart) on the profitability of net assets (JROA), and the regression result is significantly positive at the 1% level, and the research hypothesis is supported. To ensure the robustness of the research conclusions, this paper uses Return on Assets (ROA) and Return on Equity (ROE) as proxy variables for firm performance, as shown in column (2) and column (3). The regression coefficients of industrial digitalization participation (Indpart) are both significantly positive at the 1% level, indicating that the regression conclusions remain robust.
7. Conclusions and recommendations
This paper defines the concept of industrial digitalization participation and analyzes its components. It extends the engagement theory applicable to individual behavior, namely emotional, behavioral, and cognitive participation, to the organizational level. By establishing a three-dimensional measurement system of “Participation depth – Participation breadth – Participation frequency”, a new theoretical perspective is provided for the research on micro enterprises' participation in industrial digitalization, Building upon this foundation, the TOPSIS comprehensive evaluation method – a game-theoretic weighting approach – is employed to construct an indicator system for industrial digitalization participation and determine its relative weights. At the same time, 79 industries were constructed by adopting the National Economic Industry Classification Standard, and the degree of digital participation of each industry in China was calculated by using relevant data and information, and the vertical industry category analysis and horizontal time series analysis of industrial digitalization participation were conducted. And finally, based on the theory of industrial organization, the impact of industrial digitalization participation on enterprise performance was explored. The research results show that:
The results of changes in the trend of digital participation in various industries show that the degree of digital participation in various industries in China is roughly equivalent and low, with the leasing and business services industry (L) having the highest index of digital participation in the industry and the residential services, repairs and other services industry (0) and the real estate industry (K) having the lowest index.
By further analyzing the Industrial digitalization participation level indicators, it can be seen that the depth of participation of the Finance (J), Rental and Business Services (L) and Scientific Research and Technology Services (M) industries are rated higher, the breadth of participation of the Scientific Research and Technology Services (M), Rental and Business Services (L), Accommodation and Catering (H) and Transportation, Warehousing and Postal (G) industries are rated higher, and the frequency of participation of the Construction (E), Rental and Business Services (L) and Mining (B) industries are rated higher. Therefore, the study finds that high-technology demand industries such as manufacturing and technical services are suitable for deep technology penetration; asset-light services should focus on ecological co-construction and agile cooperation and utilize strategic alliances to quickly respond to market changes; and traditional heavy industries need to strengthen policy guidance and leading enterprises' dominance and promote industry-wide digitization penetration through benchmarking projects. In addition, for the residential service industry, which has a lower degree of participation in industrial digitization, relevant enterprises can promote lightweight tools to reduce transformation costs. For the agriculture and energy industries, the relevant departments can promote the popularization of IoT hardware and incentive the sinking of technology through government subsidies.
Finally, based on the SCP (Structure-Conduct-Performance) framework in the theory of industrial organization, this paper empirically tests through a fixed-effects model and finds that industrial digitalization participation (Indpart) has a significant positive impact on corporate performance (measured by the net profit margin on total assets, return on assets and return on net assets) and the regression coefficients are all significant at the 1% level.
Notes
This method is analogous to balancing the opinions of two experts to arrive at a balanced weighting combination.
The core principle of the TOPSIS comprehensive evaluation method is to identify entities that demonstrate balanced and outstanding performance across all dimensions. To this end, we first define the “optimal state” and “suboptimal state” for each indicator as benchmarks. Subsequently, we measure each enterprise's degree of proximity to the “optimal state” while simultaneously distancing itself from the “suboptimal state,” thereby establishing a ranking.