Skip to Main Content
Purpose

To address the limitations of traditional failure mode and effects analysis (FMEA) methods in elevator fault analysis, including heavy reliance on human experience, limited use of large scale heterogeneous text data, static analysis results and insufficient interpretability, this study aims to develop an intelligent FMEA method for the elevator domain.

Design/methodology/approach

An elevator FMEA method based on retrieval augmented generation (RAG) is proposed. An external knowledge base is constructed by integrating a knowledge graph (KG) with a vector database. During retrieval, a multi-route retrieval strategy is adopted to obtain candidate documents. A reranking model named CapsGCN-Rank based on a graph convolutional capsule neural network is designed to perform fine-grained filtering and reranking of candidate documents. The reranked documents are then combined with a large language model to generate structured fault analysis results.

Findings

Experimental results show that the proposed method outperforms several baseline methods in context precision, context recall, as well as the relevance and correctness of generated answers. The method effectively improves the accuracy and completeness of elevator FMEA.

Originality/value

The proposed approach introduces structured semantics from the KG, a multi-route retrieval strategy and dynamic routing of capsule neural networks into the RAG framework. It enables fine-grained document reranking and interpretable fault analysis for the elevator domain, providing an effective solution for FMEA in complex industrial scenarios.

Failure mode and effects analysis (FMEA) is a typical risk assessment technique that systematically identifies potential failure modes and evaluates them according to severity and likelihood, thereby supporting maintenance decision-making (Schmitt and Pfeifer, 2015). At present, FMEA has been widely applied in many fields, including mechanical manufacturing (Ervural and Ayaz, 2023), marine engineering (Ceylan and Memiş, 2025) and aerospace engineering (Filz et al., 2021).

However, traditional FMEA methods face many challenges in modern elevator maintenance scenarios. In the evaluation process, these methods assign equal weights to failure occurrence probability, detection probability and severity, while such a balance is difficult to achieve in real operating conditions (Filz et al., 2021). Meanwhile, maintenance records are often large in volume and poorly structured. Difference in personal experience among maintenance personnel results in inconsistent recording standards, which further reduce data completeness and consistency and hinders systematic assessment (Lu et al., 2025). Moreover, traditional FMEA results are typically presented as static tables, lacking reasoning capability and association analysis, which limits the identification of key patterns across failure modes and hinders the provision of clear guidance (Bahr et al., 2025).

In elevator scenarios, existing studies have shown that related data often exhibit imbalanced distributions and high complexity. Such data characteristics limit the performance of intelligent fault analysis (Xiao et al., 2024). Although some deep learning-based fault diagnosis models alleviate these issues through methods such as feature extraction (Wang et al., 2024) and data augmentation (Jiawei et al., 2025), their analytical performance still relies heavily on domain knowledge, with limitations in knowledge integration and result interpretation.

In recent years, the emergence of large language models (LLMs) has provided new directions for FMEA. LLMs show strong capabilities in semantic understanding and text summarization, which enables them to extract key information from large scale and structurally complex industrial documents. At the same time, the introduction of retrieval augmented generation (RAG) has further improved the accuracy of LLM-based FMEA. RAG stores knowledge in external databases and performs retrieval and generation during inference, thereby reducing hallucination in LLMs and improving results interpretability (Wu et al., 2025). However, existing RAG methods still face difficulties in identifying highly relevant information. Especially in elevator scenarios, data such as failure modes, fault locations and maintenance texts exhibit clear, structured semantic relationships. In practice, these data are often distributed across heterogeneous and fragmented documents, which makes it difficult for retrieval modules to accurately identify core information that is truly related to specific failure modes. Knowledge graph (KG) can organize this dispersed information into a unified semantic network in the form of triples (Lu et al., 2024). With the support of graph database query languages, specific entities and their contextual relationships can be precisely retrieved, providing comprehensive and high-quality knowledge support for the reasoning module (Wan et al., 2025). By adopting a knowledge graph as the external database, RAG can retrieve information that is more closely aligned with the query intent and perform deeper reasoning based on structured knowledge during generation, thereby producing more complete, reliable and interpretable results for FMEA.

Therefore, we propose an elevator FMEA method based on RAG. The main contributions are as follows:

  1. A multi-route retrieval strategy that integrates KG and vector database is proposed. By combining keyword retrieval based on the KG with similarity retrieval based on the vector database, the relevance and coverage of candidate documents are improved.

  2. A reranking model named CapsGCN-Rank based on a graph convolutional capsule neural network is developed. Multi-scale document capsule representations are constructed by integrating graph convolutional networks with a query-aware attention mechanism to achieve effective alignment between document features and user queries.

  3. Dynamic routing mechanism is introduced to perform fine-grained filtering and reranking of candidate documents, which further improves the contextual quality during the RAG stage.

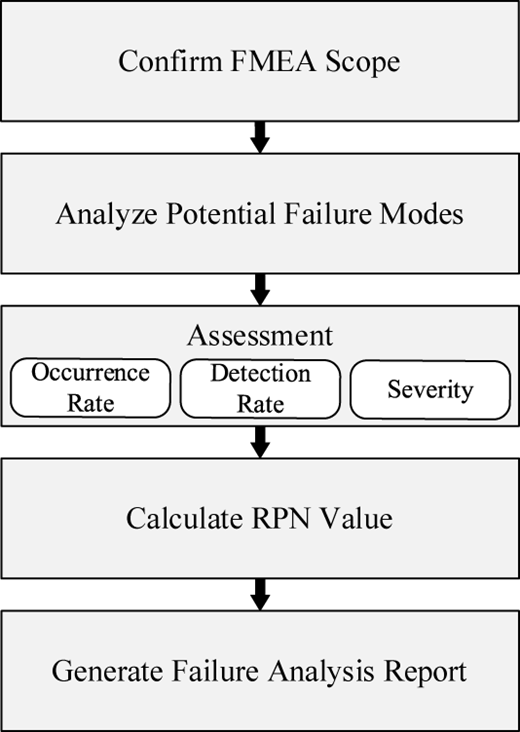
The basic procedure of the traditional FMEA is illustrated in Figure 1. First, the scope of FMEA is defined through system analysis, and the system architecture and functions are identified. Second, potential failure modes, failure causes and their effects are analyzed. Then, different failure modes are evaluated from the perspectives of failure occurrence, detection probability and severity. Finally, the risk priority number (RPN) is calculated, and failure modes are ranked according to the RPN to formulate maintenance actions for high-risk failures. For example, Suwankanit (2019) used the FMEA method to analyze the installation process of an elevator, identifying failure modes, their effects and corresponding failure causes during installation.

Traditional FMEA methods are difficult to conduct efficiently in modern industrial systems that involve large volumes of data. To address this issue, many studies have attempted to introduce LLMs into FMEA and have proposed RAG-based FMEA methods. For example, Alenjareghi et al. (2026) proposed an LLM-enhanced FMEA method and applied it to safety risk analysis in human–robot collaboration scenarios. Bahr et al. (2025) further introduced a KG into the RAG framework, where structured knowledge was used to reduce hallucination in LLMs and thus improve the analytical performance of FMEA.

Although above methods improve the intelligence level of FMEA to some extent, existing studies mainly focus on introducing knowledge at the retrieval stage and lack further filtering and reranking of candidate documents. To address this limitation, we introduced a multi-route retrieval strategy to improve the coverage completeness of candidate documents and further designed a reranking model to enhance the relevance between candidate documents and user queries.

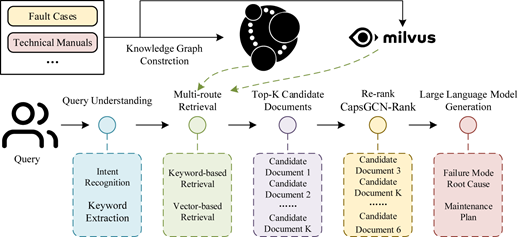
To address intelligent fault analysis in elevator systems, we propose an elevator FMEA method based on RAG (KG-CapsGCN-RAG). The overall procedure is shown in Figure 2. First, an external database is constructed by converting the collected text data into vector representations and storing them in a vector database, while a domain KG is built in parallel. Second, within the RAG module, the query is processed through keyword extraction and vector representation. A multi-route retrieval strategy is then adopted, where keyword retrieval is performed on the KG and vector similarity retrieval is conducted in the vector database to obtain candidate documents related to the query. Next, the proposed reranking model CapsGCN-Rank is applied to perform filtering and reranking of the candidate documents. Finally, the reranked documents and the query are jointly fed into an LLM, which performs contextual reasoning and summarization to generate the final FMEA results.

The text data used in this study are expressed in natural language form. Before model inference, the text corpus needs to be embedded by converting text into vector representations, so that semantic information can be captured and similarity retrieval can be performed.

The Moka massive mixed text embedding model (M3E) is trained on a large-scale Chinese sentence pair dataset with tens of millions of samples, and it provides high-quality Chinese text embeddings with strong accuracy in semantic matching and retrieval tasks. Experimental results on multiple Chinese benchmark datasets show that its Normalized Discounted Cumulative Gain at 10 (NDCG@10) scores are higher than those of most baseline models. In addition, the M3E model contains only 110M parameters, which makes it suitable for efficient deployment. In the elevator scenario, most of the processed texts are in Chinese, with only a small amount of English content. Therefore, the M3E text embedding model is selected to embed both the textual data and user queries.

The accuracy of candidate documents is a key factor affecting the results of elevator FMEA. Accordingly, we adopt a multi-route retrieval strategy for candidate documents acquisition by combining keyword retrieval based on the KG with similarity retrieval in the vector database. Through the joint use of these two retrieval approaches, the overall performance of the retrieval process is improved.

  1. Keyword retrieval

In the query understanding module, the LLM is used to analyze the user query and extract key entities. The keyword retrieval formulates graph database query statements to retrieve all key entities from KG and then outputs the corresponding triples. The retrieved triples can be represented as Rkg.

  1. Vector similarity retrieval

We evaluate the similarity between the query vector and vectors stored in the vector database using cosine similarity. The core idea is to measure the degree of similarity by computing the cosine value of the angle between two vectors in the vector space.

When a query is received, the M3E text embedding model is used to embed the query and obtain the query vector vq. The similarity computation between the query vector and vectors in the vector database can be expressed as

(1)

where vq·vi denotes the dot product between vectors; vq and vi represent the L2 norms of vq and vi, respectively. The output represents the similarity degree between the text and the query.

Finally, based on the similarity scores, the top K most relevant vectors are returned as the output and represented as Rvec. The results of keyword retrieval and vector similarity retrieval are then integrated to obtain a set of candidate documents T={t1,t2,,tK}.

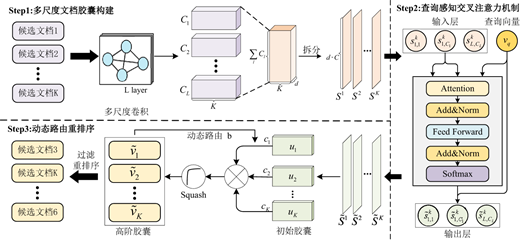
Because candidate documents obtained at the retrieval stage often exhibit weak relevance and semantic redundancy, this can significantly limit the reasoning quality of the LLM during the generation stage (Xiong et al., 2025). To improve the overall performance of KG-CapsGCN-RAG, reranking of candidate documents is essential. The objective is to further filter and rank documents obtained from multi-route retrieval, extracting more informative and query-relevant content. This study proposes a reranking model based on a graph convolutional capsule neural network (CapsGCN-Rank) to enable effective filtering and accurate reranking of candidate documents. As shown in Figure 3, the model consists of three components. First, GCN is used to construct multi-scale document capsules, where candidate documents are taken as input to produce multi-channel semantic representations. Second, a query-aware cross-attention mechanism is introduced to fuse features across different channels by incorporating the query vector, thereby generating primary document capsules. Finally, the dynamic routing reranking is applied to iteratively construct higher-level capsules, and the vector length of the final capsule is used as the similarity criterion between documents and the query, enabling candidate document filtering and reranking.

3.3.1 Multi-scale document capsule construction

In the RAG process, the user query is represented as vq, and the K candidate documents are denoted as T={t1,t2,,tK}. Their embeddings are given by VT={v1,v2,vK}, with dimensionality RK×d. In this section, filtering and reranking are performed based on the similarity between the user query and the candidate documents.

Since relations may exist among candidates, documents and GCN can effectively capture such internal features by incorporating semantic graph structures. GCN is applied to process the document embeddings to obtain initial document features:

(2)

where WlRd×Cld is a learnable weight matrix and Cl denotes the number of channels in the lth layer. A is the adjacency matrix, D~ denotes the degree matrix corresponding to the adjacency matrix and I is the identity matrix. ZlRK×(Cl·d) represents the embedding of candidate documents at the lth GCN layer, with the initial value set to VT.

To more effectively capture interactions among documents, an adaptive adjacency matrix construction method is further introduced, where the adjacency matrix is dynamically built based on document embeddings:

(3)

where t is a temperature coefficient used to control the smoothness of the similarity distribution. This adjacency matrix construction method enables the graph structure to be dynamically learned according to semantic similarity among documents, thereby enhancing the capability of GCN to model semantic relationships.

After obtaining the outputs of each GCN layer, they are reorganized into multi-scale document feature representations. For the lth GCN layer, the output is denoted as Zl, where each channel corresponding to a d dimensional document vector. To construct the initial document capsule, the output of each layer is split by channel into individual channel vectors:

(4)

After integrating channel features from all layers, a total of C=l=1LCl channels are obtained.

3.3.2 Query aware cross-attention mechanism

In GCN, vectors from different layers and different channels describe document features at multiple scales and in different representation spaces. However, the importance of these vectors is not uniform. Some vectors may contain irrelevant semantics or noise, which can affect the performance of subsequent dynamic routing, and moreover, they are not compared with the query vector in terms of similarity.

To address this issue, a query-aware cross-attention mechanism is introduced to apply weighted scaling to each channel vector. This mechanism allows the model to highlight key information related to the query semantics while suppressing redundant components. For the kth candidate document, vectors from all layers and channels are concatenated to form a complete document embedding representation:

(5)
(6)

To distinguish the importance of different channels and their correlation with the query vector, we perform computation using a cross-attention mechanism. Specifically, for the kth candidate document, the query vector and the key vector are constructed as

(7)

where Wq and Wk are learnable weight matrices. Q is only related to the query and remains the same for all candidate documents. Kk is determined by the specific candidate document.

Then, based on the query vector and the key vector, the attention weights are computed as follows:

(8)

the computed αkRC contains attention weights of the C channels. According to these attention weights, each channel vector is scaled as

(9)

After concatenating all attention results, a complete document embedding is obtained S~k=concat(s~1,1k,,s~1,C1k,s~L,CLk), and all candidate documents can be represented as S~={S~1,S~2,S~K}. Each element has dimensionality RC·d.

3.3.3 Dynamic routing Re-ranking

Subsequently, the document embeddings are further updated by incorporating the dynamic routing mechanism. First, the document embeddings are expanded to generate an initial document capsule set U={u1,u2,uK}, where ukR(C·d)×m and m denote the capsule dimension. Then, prediction vectors are computed through an affine transformation:

(10)

where u~j|k represents the prediction vector of the kth document capsule with respect to the jth higher-level capsule. WjkRm×m is a learnable weight matrix. After aggregating all prediction vectors, the higher-level capsule can be obtained as

(11)

where squash(·) is an activation function. cjk denotes the coupling coefficient, which is used to describe the contribution of a document capsule to a higher-level capsule. For each document capsule uk, the sum of its coupling coefficients with all higher-level capsules are initialized to 1. The coupling coefficient cjk is computed through the dynamic routing mechanism as follows:

(12)

where the initial value of bjk is set to 0 and is dynamically updated during the routing iterations according to the computation results of the higher-level capsules. The update process is realized through the accumulation of u~j|k·v~j.

Through this dynamic routing mechanism, document capsules and higher-level capsules are able to maintain feature consistency during the iterative process. This enables the model to strengthen document capsules with higher contribution degrees while suppressing noise, thereby generating higher-level document semantic representations for ranking.

Finally, the loss function is designed to minimize the cosine distance between the query vector and the higher-level capsule, so as to constrain the semantic direction of the higher-level capsule to be consistent with the query:

(13)

In capsule neural networks, the length of a higher-level capsule vector is usually used to represent the probability strength of the features expressed by the capsule. In reranking tasks, the direction of the higher-level capsule vector is more capable of reflecting the relevance between candidate documents and the query. Therefore, the importance of candidate documents with respect to the query is determined according to the direction of the higher-level capsule, and reranking is performed accordingly.

For each candidate document tk, a higher-level capsule vector v~k is computed. Based on the cosine similarity defined in the loss function, the similarity between v~k and the query vector vq is computed as follows:

(14)

A higher score indicates a stronger relevance between the document and the query. Subsequently, candidate documents are filtered and reranked according to a threshold, and the final document set is obtained as

(15)

where T~ denotes the final document set and γ represents the threshold. Documents with scores lower than the threshold are filtered out. In the generation stage, the reranked documents are integrated with the query to jointly form the contextual input to the LLM, which performs deeper integration and outputs structured standard answers.

To evaluate the accuracy of the conclusions of elevator FMEA, the experiments adopt the RAGas framework for performance evaluation. RAGas is a framework specifically designed for evaluating the performance of RAG systems, which involves multiple metrics:

Context precision (CP): CP is used to measure the relevance of retrieved context fragments to the answers of a given question. Its formulation is expressed as follows:

(16)
(17)

where Precision@k represents the proportion of positive results among the top k retrieval results.

Context recall (CR): CR is used to measure the consistency between the retrieved context and the ground truth provided by humans. Its formulation is expressed as follows:

(18)

where GT denotes the ground truth. In this formula, the numerator represents the number of sentences in the retrieved context that are relevant to the ground truth, while the denominator represents the total number of sentences in the ground truth.

Answer relevancy (AR): AR is used to measure the degree of association between the generated answer and the user query. To compute this metric, RAGas invokes LLM to infer possible questions in reverse based on the generated answer and then calculates the average cosine similarity between all inferred questions and the user query. The core idea is that if the generated answer can respond to the user query, the inferred questions and the user query will exhibit a relatively high similarity.

Answer correctness (AC): AC is used to measure the similarity between the generated answer and the ground truth. To compute this metric, RAGas allows LLM to read both the generated answer and the ground truth simultaneously and then evaluates the degree of semantic consistency and factual consistency between them. The final AC score is obtained through weighted computation.

In this study, CP and CR are used to evaluate the candidate documents obtained from retrieval and reranking, so as to measure the relevance and coverage completeness of the candidate documents. At the same time, AR and AC are used to evaluate the conclusions of elevator FMEA obtained in the generation stage, measuring the quality of the generated answers from the perspectives of semantic consistency and factual correctness. By combining these four metrics, the overall performance of the RAG framework across retrieval and generation processes can be comprehensively evaluated.

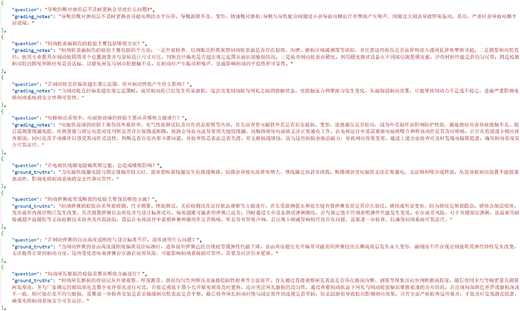
To evaluate the accuracy of FMEA, we construct a question answering evaluation dataset that conforms to the RAGas framework. For question design, the dataset covers multiple types of questions, including simple question answering and complex reasoning, so as to ensure diversity in question types. At the same time, all questions and ground truth are specifically designed based on the actual data used in RAG. To further improve data quality, all proposed questions and ground truth undergo multiple rounds of screening and are validated by domain experts to ensure their accuracy and reliability.

Finally, based on the above procedure, an evaluation dataset consisting of 100 question answering samples is constructed. Some examples are shown in Figure 4.

In this study, m3e-base was used as the text embedding model to encode both queries and documents. Deepseek-v3.2 was selected as the baseline LLM of KG-CapsGCN-RAG to perform question understanding and answer generation. During the training of the CapsGCN-Rank reranking model, the multi-route retrieval was configured to retrieve 10 relevant documents for each query. The number of training epochs was set to 10, learning rate was set to 5e−5 and Adam was selected as the optimizer. In addition, the number of GCN layers was set to 3, with the number of channels Cl in each layer set to 2. The number of dynamic routing iterations in the capsule neural network was set to 3. The experimental environment and the remaining parameter settings in this section are shown in Table 1.

Finally, the following RAG frameworks are selected for comparison in this study:

NaiveRAG (Gao et al., 2023): NaiveRAG is a standard baseline model of existing RAG frameworks. This method is based on vector retrieval, where the original documents are sliced and encoded to obtain similar document information.

GraphRAG (Edge et al., 2024): GraphRAG is a KG–based RAG method. It summarizes document content by constructing graph level and node level community reports and performs RAG by incorporating the community reports.

LightRAG (Guo et al., 2024): LightRAG is a KG-based RAG method. It adopts a two-level retrieval architecture that combines lower level specific entity retrieval with higher level topic retrieval, thereby improving retrieval coverage.

4.4.1 Baseline Study

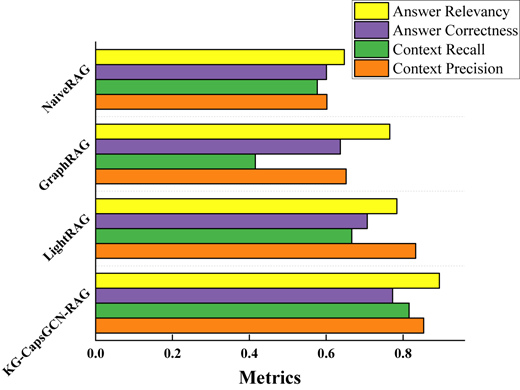
The overall experimental results are shown in Figure 5. The results indicated that, as the RAG method gradually shifts from a retrieval strategy that relies only on vector similarity to a strategy that integrates a KG, the overall performance of RAG is clearly improved. GraphRAG, LightRAG and KG-CapsGCN-RAG all introduced a KG in the retrieval stage and achieved better performance compared with NaiveRAG, which relied only on vector similarity retrieval. Furthermore, by introducing a multi-route retrieval strategy, LightRAG and KG-CapsGCN-RAG can retrieve candidate documents with broader coverage, thereby improving the overall quality of the retrieved context and enhancing the quality of the generated answers. Their overall performance was superior to that of GraphRAG, which relied on a single graph retrieval strategy. On this basis, KG-CapsGCN-RAG further introduced a reranking model. For the task of elevator FMEA, CapsGCN-Rank was designed by combining capsule neural networks with GCN, which performs fine-grained filtering and reranking of candidate documents, thereby improving question answering performance in complex engineering scenarios.

4.4.2 Ablation study

In this section, a series of ablation experiments were conducted to verify the impact of each component in the proposed method. The experiment consists of the following control groups: (1) proposed KG-CapsGCN-RAG; (2) KG-CapsGCN-RAG without keyword retrieval, denoted as w/o KG; (3) KG-CapsGCN-RAG without vector similarity retrieval, denoted as w/o Vector; (4) KG-CapsGCN-RAG without CapsGCN-Rank, denoted as w/o Rerank.

The experimental results are shown in Table 2. It can be observed that all components in KG-CapsGCN-RAG contribute positively to the improvement of RAG performance. First, when the CapsGCN-Rank was removed, the performance of RAG showed a clear decline. This result indicated that although the multi-route retrieval can provide diverse candidate documents, it inevitably included many redundant documents and low relevance information, which directly affect the generation performance of LLM. Both w/o KG and w/o Vector retained the CapsGCN-Rank, and their performance was clearly better than that of w/o Rerank, which further demonstrated that the proposed CapsGCN-Rank plays a crucial role in the overall RAG process.

Further, both w/o KG and w/o Vector rely on a single route retrieval. As a result, the candidate documents obtained by these methods show weaker coverage of relevant information compared with the multi-route retrieval strategy, leading to lower results in AC and AR than the complete method. The results of these two experiments further indicated that vector similarity-based retrieval plays a more important role than KG-based keyword retrieval, as it can match a wider range of relevant documents, while the latter can provide more accurate triple information based on the KG structure. By combining these two retrieval methods, more sufficient and precise candidate documents can be obtained.

4.4.3 LLM comparative study

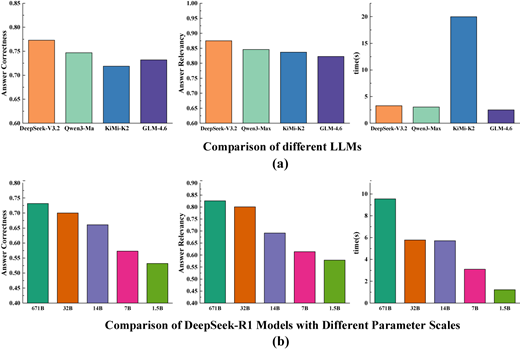
In the generation stage, the performance of the LLM used is a key factor affecting the accuracy of the final answers. A stronger model can accurately understand the question based on the prompts and effectively integrate the retrieved candidate documents. Therefore, Qwen3-Max, DeepSeek-V3.2, KiMi-K2 and GLM-4.6 were selected as baseline models for comparison. In addition, since the number of model parameters is an important indicator for evaluating LLM performance, we further investigated the impact of parameter scale on RAG performance by using different parameter versions of the same model. The objective of this experiment was to maintain RAG accuracy while adopting models with smaller parameter scales for inference, so as to reduce token consumption. In the experiments, DeepSeek-R1 was used as the baseline model, and its full version with 671B parameters, as well as versions with 32B, 14B, 7B and 0.5B parameters, was evaluated. All models were invoked through the Alibaba Cloud Bailian Application Programming Interface (API).

Figure 6 presented the comparison results of different models in AC, AR and average inference time. As shown in Figure 6(a), DeepSeek-V3.2, Qwen3-Max, KiMi-K2 and GLM-4.6 exhibited similar performance on AC and AR. These four models were full-parameter versions of their respective architectures and possessed strong capabilities in semantic understanding and text generation. With appropriate prompts and sufficient and accurate candidate documents support, the models can effectively integrate retrieved information, summarize the given text and produce accurate responses. Regarding inference time, DeepSeek-V3.2, Qwen3-Max and GLM-4.6 can complete inference within a relatively short time, whereas KiMi-K2 required a longer inference time. This was because KiMi-K2 incorporated a deep reasoning mechanism during inference. However, in the application scenario considered in this study, the task mainly focused on text understanding and summarization, and the deep reasoning capability did not lead to a clear advantage in generation performance.

Figure 6(b) shows the experimental results of DeepSeek-R1 under different parameter scales. The results indicated that, as the number of model parameters decreased, the performance on AC and AR in the generation stage exhibited a gradual decline. Although reducing the model scale led to some reduction in inference time, the improvement was limited and insufficient to compensate for the performance degradation caused by the decrease in parameter scale. These results indicated that, in elevator scenario, models with larger parameter scales can better exploit semantic understanding and produce more accurate FMEA results.

4.4.4 Visualization analysis

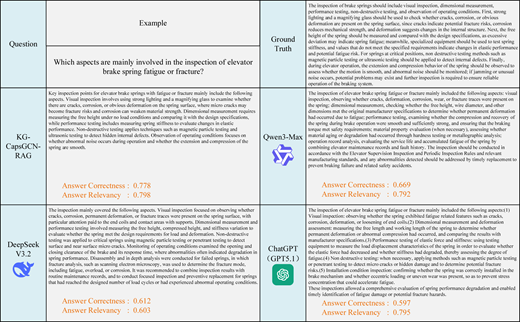
Finally, to present the performance of KG-CapsGCN-RAG in a more intuitive manner, a visualization analysis was conducted on its question answering results in practical scenarios. Taking the question “Which aspects are mainly involved in the inspection of elevator brake spring fatigue or fracture?” as an example, the proposed method was compared with commonly used general LLMs, including Qwen3-Max, DeepSeek-V3.2 and GPT5.1. The AC and AR of the answers generated by different models were calculated based on the reference answer.

As shown in Figure 7, KG-CapsGCN-RAG achieved the best performance on both metrics. Its generated answers showed advantages in content coverage, completeness and conciseness. This was mainly because the reference knowledge was processed by different methods and stored in the KG and the vector database, which enabled the retrieval stage to query relevant knowledge around the user question and provide contextual support for the generation stage.

The other three models also achieved relatively high AR values, indicating that their responses can answer the question and identify key inspection aspects such as visual inspection, dimensional measurement and performance testing. However, from the perspective of AC, the answers generated by these models still exhibited varying degrees of information omission and detail deviation compared with the ground truth. For example, the response generated by Qwen3-Max did not mention non-destructive testing. Although DeepSeek-V3.2 and GPT5.1 mentioned non-destructive testing, they did not further specify inspection techniques such as ultrasonic testing, leading to differences in key implementation details. In addition, none of the above models mentioned abnormal noise during spring operation. These differences ultimately resulted in lower AC values.

This study proposed KG-CapsGCN-RAG, an elevator FMEA method based on RAG. The overall framework of the proposed method consisted of four key steps: (1) construction of KG and vector database, (2) retrieval of candidate documents by combining a multi-route retrieval strategy, (3) filtering and ranking of candidate documents using the proposed CapsGCN-Rank reranking model and (4) generation of structured fault analysis results based on LLM.

In KG-CapsGCN-RAG, the CapsGCN-Rank reranking model constructed primary document capsules by integrating multi-scale convolution and a query aware cross-attention mechanism and evaluated document similarity through the dynamic routing mechanism. This process enabled fine-grained filtering and reranking of candidate documents. Experimental results showed that KG-CapsGCN-RAG outperformed existing RAG methods such as GraphRAG and LightRAG. In addition, the CapsGCN-Rank reranking model provided high-quality candidate documents that were highly relevant to the query, which verified the effectiveness of the proposed method for elevator FMEA tasks.

Alenjareghi
,
M.J.
,
Ghorbani
,
F.
,
Keivanpour
,
S.
,
Chinniah
,
Y.A.
and
Jocelyn
,
S.
(
2026
), “
Proactive safety reasoning in human-robot collaboration in disassembly through LLM-augmented STPA and FMEA
”,
Robotics and Computer-Integrated Manufacturing
, Vol. 
98
, 103162, doi: .
Bahr
,
L.
,
Wehner
,
C.
,
Wewerka
,
J.
,
Bittencourt
,
J.
,
Schmid
,
U.
and
Daub
,
R.
(
2025
), “
Knowledge graph enhanced retrieval-augmented generation for failure mode and effects analysis
”,
Journal of Industrial Information Integration
, Vol. 
45
, 100807, doi: .
Ceylan
,
B.O.
and
Memiş
,
S.
(
2025
), “
Fuzzy parameterized fuzzy soft matrices-based failure mode and effects analysis (FPFS-FMEA) with ship lubricating oil system risk assessment
”,
Ocean Engineering
, Vol. 
342
, 123049, doi: .
Edge
,
D.
,
Trinh
,
H.
,
Cheng
,
N.
,
Bradley
,
J.
,
Chao
,
A.
,
Mody
,
A.
,
Truitt
,
S.
,
Metropolitansky
,
D.
,
Ness
,
R.
and
Larson
,
J.
(
2024
), “
From local to global: a graph rag approach to query-focused summarization
”,
arXiv Preprint
, arXiv:.
Ervural
,
B.
and
Ayaz
,
H.I.
(
2023
), “
A fully data-driven FMEA framework for risk assessment on manufacturing processes using a hybrid approach
”,
Engineering Failure Analysis
, Vol. 
152
, 107525, doi: .
Filz
,
M.-A.
,
Langner
,
J.E.B.
,
Herrmann
,
C.
and
Thiede
,
S.
(
2021
), “
Data-driven failure mode and effect analysis (FMEA) to enhance maintenance planning
”,
Computers in Industry
, Vol. 
129
, 103451, doi: .
Gao
,
Y.
,
Xiong
,
Y.
,
Gao
,
X.
,
Jia
,
K.
,
Pan
,
J.
,
Bi
,
Y.
,
Dai
,
Y.
,
Sun
,
J.
and
Wang
,
H.
(
2023
), “
Retrieval-augmented generation for large language models: a survey
”,
arXiv Preprint
, arXiv:.
Guo
,
Z.
,
Xia
,
L.
,
Yu
,
Y.
,
Ao
,
T.
and
Huang
,
C.
(
2024
), “
Lightrag: simple and fast retrieval-augmented generation
”,
arXiv Preprint
, arXiv: .
Lu
,
J.
,
Li
,
J.
,
Li
,
W.
,
Song
,
J.
and
Xiao
,
G.
(
2024
), “
Heterogeneous propagation graph convolution network for a recommendation system based on a knowledge graph
”,
Engineering Applications of Artificial Intelligence
, Vol. 
138
, 109395, doi: .
Jiawei
,
L.
,
Zhang
,
W.
,
Lu
,
C.
,
Xiao
,
G.
and
Wang
,
Q.
(
2025
), “
A multi-scale convolution capsule network with data augmentation and attention mechanisms for elevator fault diagnosis
”,
ISA Transactions
, Vol. 
167
, pp.
1873
-
1887
, doi: .
Lu
,
J.
,
Chen
,
H.
,
Chen
,
J.
,
Xiao
,
Z.
,
Li
,
R.
,
Xiao
,
G.
and
Wang
,
Q.
(
2025
), “
Temporal knowledge graph fusion with neural ordinary differential equations for the predictive maintenance of electromechanical equipment
”,
Knowledge-Based Systems
, Vol. 
317
, 113450, doi: .
Schmitt
,
R.
and
Pfeifer
,
T.
(
2015
),
Qualitätsmanagement: Strategien–Methoden–Techniken
,
Carl Hanser Verlag GmbH Co KG
,
München
.
Suwankanit
,
T.
(
2019
), “
The identification of failure modes in the elevator installation process of a case company in Thailand by FMEA
”,
London Journal of Research of Engineering Research
, Vol. 
19
No. 
4
, pp.
21
-
28
.
Wan
,
Y.
,
Chen
,
Z.
,
Liu
,
Y.
,
Chen
,
C.
and
Packianather
,
M.
(
2025
), “
Empowering LLMs by hybrid retrieval-augmented generation for domain-centric Q&A in smart manufacturing
”,
Advanced Engineering Informatics
, Vol. 
65
, 103212.
Wang
,
Q.
,
Chen
,
L.
,
Xiao
,
G.
,
Wang
,
P.
,
Gu
,
Y.
and
Lu
,
J.
(
2024
), “
Elevator fault diagnosis based on digital twin and PINNs-e-RGCN
”,
Scientific Reports
, Vol. 
14
No. 
1
, 30713, doi: .
Wu
,
W.
,
Wang
,
H.
,
Li
,
B.
,
Huang
,
P.
,
Zhao
,
X.
and
Lei
,
L.
(
2025
), “
Multirag: a knowledge-guided framework for mitigating hallucination in multi-source retrieval augmented generation
”,
2025 IEEE 41st International Conference on Data Engineering (ICDE)
,
IEEE
.
Xiao
,
G.
,
Gu
,
H.
,
Dong
,
J.
,
Wang
,
Q.
and
Lu
,
J.
(
2024
), “
Simulation data-driven migration diagnosis method for guide rail faults in long-term service elevator
”,
China Mechanical Engineering
, Vol. 
35
No. 
01
, p.
125
.
Xiong
,
Y.
,
Tu
,
X.
and
Zhao
,
W.
(
2025
), “
AFR-Rank: an effective and highly efficient LLM-based listwise reranking framework via filtering noise documents
”,
Information Processing and Management
, Vol. 
62
No. 
6
, 104232, doi: .
Published in Journal of Intelligent Manufacturing and Special Equipment. Published by Emerald Publishing Limited. This article is published under the Creative Commons Attribution (CC BY 4.0) licence. Anyone may reproduce, distribute, translate and create derivative works of this article (for both commercial and non-commercial purposes), subject to full attribution to the original publication and authors. The full terms of this licence may be seen at Link to the terms of the CC BY 4.0 licence.

Data & Figures

Figure 1
A flowchart shows the five key steps of the F M E A process from scope confirmation to report generation.The flowchart consists of five large, vertical rectangular boxes arranged horizontally and connected by thick rightward-pointing arrows. The first box on the left is labeled “Confirm F M E A Scope”. A horizontal arrow begins from the first box and points rightward to the second rectangular box labeled “Analyze Potential Failure Modes”. A horizontal arrow begins from the second box and points rightward to the third rectangular box labeled “Assessment”. This third box contains three smaller vertically stacked, rounded rectangular boxes labeled from top to bottom as “Severity”, “Detection Rate”, and “Occurrence Rate”. A horizontal arrow begins from the third box and points rightward to the fourth rectangular box labeled “Calculate R P N Value”. A final horizontal arrow begins from the fourth box and points rightward to the fifth rectangular box on the far right labeled “Generate Failure Analysis Report”.

The procedure of the traditional FMEA

Close modal
Figure 2
A workflow diagram showing a knowledge graph–based retrieval and ranking system for diagnosing faults using L L M generation.The illustration shows a system workflow diagram for fault diagnosis using a knowledge graph, document retrieval, re-ranking, and large language model generation. The diagram is arranged horizontally, showing the process from data sources to final diagnostic output. At the top left, two rectangular input sources inside a block are shown: “Fault Cases” and “Technical Manuals”, followed by ellipses indicating additional document sources. These sources feed into a process labeled “Knowledge Graph Construction”, represented by an arrow pointing toward a circular node network graphic representing the knowledge graph. From the knowledge graph, data is stored and accessed through “Milvus”, a vector database system shown on the top right with its logo. Dashed arrows connect the knowledge graph and Milvus to the document retrieval stage below. The main workflow begins at the bottom left with a user query, represented by a person icon and the label “Query”. An arrow leads to the “Query Understanding” stage. The “Query Understanding” stage contains a dashed rectangular box with two processes: “Intent Recognition” and “Keyword Extraction”. From this stage, the workflow moves to “Multi-route Retrieval”, represented by another dashed box containing two retrieval approaches: “Keyword-based Retrieval” and “Vector-based Retrieval”. The system then generates “Top-K Candidate Documents”, shown in a dashed box listing example outputs: “Candidate Document 1”, “Candidate Document 2”, ellipsis, and “Candidate Document K”. Next, the candidate documents are processed through a “Re-rank” stage labeled “Caps G C N-Rank”. In this step, the candidate documents are reordered based on relevance. The box shows a new ranking example: “Candidate Document 3”, “Candidate Document K”, ellipsis, and “Candidate Document 6”. Finally, the re-ranked results are sent to the “Large Language Model Generation” stage, represented by a dashed box on the far right. This stage produces the final diagnostic output, including “Failure Mode Root Cause” and “Maintenance Plan”.

KG-CapsGCN-RAG framework

Close modal
Figure 3
A diagram shows a capsule network–based document re-ranking process with multi-scale convolution and cross-attention.The illustration presents a three-step workflow for document re-ranking using a capsule network with convolution and cross-attention mechanisms. The diagram includes section titles and annotations in Chinese, corresponding to each step, alongside English labels within the components. The layout flows from left to right in Steps 1 and 2, and then from right to left in Step 3. Step 1: Multi-scale Document Capsule Construction. On the left, a vertical stack of boxes represents candidate documents labeled “Candidate Document 1”, “Candidate Document 2”, ellipsis, and “Candidate Document K”. A rightward arrow leads to a feature extraction module labeled “L-layer Multi-scale Convolution”, shown as stacked layers with interconnected nodes. This module produces capsule feature vectors labeled “C subscript 1”, “C subscript 2”, ellipsis, and “C subscript L”. These capsule vectors are aggregated into a combined representation shown as a rectangular block. The combined output is then split into multiple feature subsets labeled “S superscript 1”, “S superscript 2”, ellipsis, and “S superscript K”. Step 2: Query-Aware Cross-Attention Mechanism. The split feature sets, along with a query vector labeled “v subscript q”, are input into a transformer-style attention module. Inside this module, operations are arranged vertically as “Attention”, “Add and Norm”, “Feed Forward”, another “Add and Norm”, and “Softmax”. Arrows indicate a top-to-bottom flow through these stages. The output consists of refined feature representations corresponding to the input feature sets. Step 3: Dynamic Routing Re-ranking. On the right, the refined feature sets labeled “S superscript 1” to “S superscript K” are transformed into primary capsules labeled “u subscript 1”, “u subscript 2”, ellipsis, and “u subscript K”. Each capsule is associated with a routing coefficient labeled “c subscript 1”, “c subscript 2”, ellipsis, and “c subscript K”. These capsules are combined at a central aggregation node and passed through a transformation labeled “Squash”, which normalizes the outputs. This produces high-level capsules labeled “v subscript 1”, “v subscript 2”, ellipsis, and “v subscript K”. On the far left, a vertical list of candidate documents represents the final re-ranked output. An arrow labeled “Filtering and Re-ranking” indicates that the high-level capsule outputs determine the final ordering of the documents.

CapsGCN-Rank framework

Close modal
Figure 4
A figure shows a list of technical questions and answers formatted as data objects.The figure consists of a list of eight technical entries formatted as code-like objects with curly quotes for each field name. Each entry includes a “question” field followed by either a “grading underscore notes” field or a “ground underscore truths” field. The content of these fields is written in Chinese script and focuses on technical inspections and potential failures for mechanical components. The first four entries utilize the “grading underscore notes” label for the descriptive answers, while the final four entries utilize the “ground underscore truths” label for the provided solutions.

Dataset examples

Close modal
Figure 5
A horizontal grouped bar graph compares metrics for “Naive R A G”, “Graph R A G”, “Light R A G”, and “K G-Caps G C N-R A G”.The horizontal axis is labeled “Metrics” and ranges from 0.0 to 0.8 in increments of 0.2 units. The vertical axis lists four categories from top to bottom: “Naive R A G”, “Graph R A G”, “Light R A G”, and “K G-Caps G C N-R A G”. There are 16 bars in total, arranged in groups of four for each category. The legend at the top right indicates a yellow bar for “Answer Relevancy”, a purple bar for “Answer Correctness”, a green bar for “Context Recall”, and an orange bar for “Context Precision”. The data from the graph is as follows: Naive R A G: Answer Relevancy: 0.65. Answer Correctness: 0.60. Context Recall: 0.58. Context Precision: 0.61. Graph R A G: Answer Relevancy: 0.77. Answer Correctness: 0.64. Context Recall: 0.42. Context Precision: 0.65. Light R A G: Answer Relevancy: 0.79. Answer Correctness: 0.71. Context Recall: 0.67. Context Precision: 0.83. K G-Caps G C N-R A G: Answer Relevancy: 0.89. Answer Correctness: 0.77. Context Recall: 0.81. Context Precision: 0.85. Note: All numerical data values are approximated.

Baseline study

Close modal
Figure 6
A figure shows six vertical bar graphs arranged in two rows, comparing various L L M metrics.The top row is labeled “(a) Comparison of different L L Ms” and consists of three vertical bar graphs arranged from left to right. All three graphs in this row share a horizontal axis with four categories, labeled from left to right as follows: “DeepSeek-V 3.2”, “Qwen 3-Maximum”, “K i M i-K 2”, and “G L M-4.6”. Left graph: The vertical axis is labeled “Answer Correctness ” and ranges from 0.60 to 0.85. in increments of 0.05 units. The data is as follows: DeepSeek-V 3.2: 0.77. Qwen 3-Maximum: 0.75. K i M i-K 2: 0.72. G L M-4.6: 0.73. Middle graph: The vertical axis is labeled “Answer Relevancy” and ranges from 0.60 to 1.00 in increments of 0.05 units. The data is as follows: DeepSeek-V 3.2: 0.87. Qwen 3-Maximum: 0.85. K i M i-K 2: 0.84. G L M-4.6: 0.82. Right graph: The vertical axis is labeled “time(seconds)” and ranges from 0 to 20 units in increments of 5 units. The data is as follows: DeepSeek-V 3.2: 3.5. Qwen 3-Maximum: 3.2. K i M i-K 2: 20.0. G L M-4.6: 2.8. The bottom row is labeled “(b) Comparison of DeepSeek-R 1 Models with Different Parameter Scales” and consists of three vertical bar graphs arranged from left to right. All three graphs in this row share a horizontal axis with five categories, labeled from left to right as follows: “671 B”, “32 B”, “14 B”, “7 B”, and “1.5 B”. Left graph: The vertical axis is labeled “Answer Correctness” and ranges from 0.40 to 0.80 in increments of 0.05 units. The data is as follows: 671 B: 0.73. 32 B: 0.70. 14 B: 0.66. 7 B: 0.58. 1.5 B: 0.54. Middle graph: The vertical axis is labeled “Answer Relevancy” and ranges from 0.40 to 0.90 in increments of 0.05 units. The data is as follows: 671 B: 0.83. 32 B: 0.80. 14 B: 0.69. 7 B: 0.62. 1.5 B: 0.58. Right graph: The vertical axis is labeled “time(seconds)” and ranges from 0 to 10 units in increments of 2 units. The data is as follows: 671 B: 9.6. 32 B: 5.8. 14 B: 5.7. 7 B: 3.2. 1.5 B: 1.3. Note: All numerical data values are approximated.

LLM comparative study

Close modal
Figure 7
A comparison table shows answers and evaluation scores from K G-Caps G N N-R A G, Qwen 3-Max, and Chat G P T for a query.The illustration presents a comparison table evaluating responses from different models for a given query. The layout is divided into two main vertical sections labeled “Question” on the left and “Ground Truth” on the right. Below the “Question”, two model responses, by “K G-Caps G N N-R A G” and “Deep Seek V 3.2”, are shown. Below the “Ground Truth”, two model responses, by “Qwen 3-Max” and “Chat G P T (G P T-5.1)”. In the leftmost column, the question is displayed: “Which aspects are mainly involved in the inspection of elevator brake spring fatigue or fracture?” below the label “Example”. This column provides the prompt used to generate responses. Next, the “Ground Truth” column contains a detailed reference answer, reading, “The inspection of brake springs should include visual inspection, dimensional measurement, performance testing, non destructive testing, and observation of operating conditions. First, strong lighting and a magnifying glass should be used to check whether cracks, corrosion, or obvious deformation are present on the spring surface, since cracks indicate potential fracture risks, corrosion reduces mechanical strength, and deformation suggests changes in the internal structure. Next, the free height of the spring should be measured and compared with the design specifications, as excessive deviation may indicate spring fatigue; meanwhile, specialized equipment should be used to test spring stiffness, and values that do not meet the specified requirements indicate changes in elastic performance and potential fatigue risk. For springs at critical positions, non destructive testing methods such as magnetic particle testing or ultrasonic testing should be applied to detect internal defects. Finally, during elevator operation, the extension and compression behavior of the spring should be observed to assess whether the motion is smooth, and abnormal noise should be monitored; if jamming or unusual noise occurs, potential problems may exist and further inspection is required to ensure reliable operation of the braking system”. In the “K G-Caps G N N-R A G” section, the generated answer is shown in paragraph form, addressing “Key inspection points for elevator brake springs with fatigue or fracture mainly include the following aspects. Visual inspection involves using strong lighting and a magnifying glass to examine whether there are cracks, corrosion, or obvious deformation on the spring surface, where micro cracks may become fracture risks and corrosion can weaken material strength. Dimensional measurement requires measuring the free height under no load conditions and comparing it with the design specifications, while performance testing includes measuring spring stiffness to evaluate changes in elastic performance. Non-destructive testing applies techniques such as magnetic particle testing and ultrasonic testing to detect hidden internal defects. Observation of operating conditions focuses on whether abnormal noise occurs during operation and whether the extension and compression of the spring are smooth”. At the bottom of this section, evaluation metrics are displayed: “Answer Correctness: 0.778” and “Answer Relevancy: 0.798”. In the “Deep Seek V 3.2” section, another generated answer is presented, reading, “The inspection mainly covered the following aspects. Visual inspection focused on observing whether cracks, corrosion, permanent deformation, or fracture traces were present on the spring surface, with particular attention paid to the end coils and contact areas with supports. Dimensional measurement and performance testing involved measuring the free height, compressed height, and stiffness variation to evaluate whether the spring met the design requirements for load and deformation. Non-destructive testing was applied to critical springs using magnetic particle testing or penetrant testing to detect surface and near surface micro cracks. Monitoring of operating conditions examined the opening and closing clearance of the brake and its response time, where abnormalities often indicated degradation in spring performance. Disassembly and in depth analysis were conducted for failed springs, in which fracture analysis, such as scanning electron microscopy, was used to determine the fracture mode, including fatigue, overload, or corrosion. It was recommended to combine inspection results with routine maintenance records, and to conduct focused inspection and preventive replacement for springs that had reached the designed number of load cycles or had experienced abnormal operating conditions”. The evaluation metrics shown are “Answer Correctness: 0.612” and “Answer Relevancy: 0.603”. In the “Qwen 3-Max” section, the response includes “The inspection of elevator brake spring fatigue or fracture mainly included the following aspects: visual inspection, observing whether cracks, deformation, corrosion, wear, or fracture traces were present on the spring; dimensional measurement, checking whether the free height, wire diameter, and other dimensions met the original manufacturer specifications to determine whether permanent deformation had occurred due to fatigue; performance testing, examining whether the compression and recovery of the spring during brake operation were smooth and sufficiently strong, and ensuring that the braking torque met safety requirements; material property evaluation (when necessary), assessing whether material aging or degradation had occurred through hardness testing or metallographic analysis; operation record analysis, evaluating the service life and accumulated fatigue of the spring by combining elevator maintenance records and fault history. The inspection should be conducted in accordance with the Elevator Supervision Inspection and Periodic Inspection Rules and relevant manufacturing standards, and any abnormalities detected should be addressed by timely replacement to prevent braking failure and related safety accidents”. The evaluation metrics shown are “Answer Correctness: 0.669” and “Answer Relevancy: 0.792”. In the “Chat G P T (G P T 5.1)” section, the response includes a structured explanation of inspection aspects, reading “The inspection of elevator brake spring fatigue or fracture mainly included the following aspects: (1) Visual inspection: observing whether the spring exhibited fatigue related features such as cracks, corrosion, deformation, or loosening of end coils. (2) Dimensional measurement and deformation assessment: measuring the free length and working length of the spring to determine whether permanent deformation or abnormal compression had occurred, and comparing the results with manufacturer specifications. (3) Performance testing of elastic force and stiffness: using testing equipment to measure the load displacement characteristics of the spring in order to evaluate whether the elastic force had decreased and whether stiffness had degraded, thereby assessing the degree of fatigue. (4) Non destructive testing: when necessary, applying methods such as magnetic particle testing or penetrant testing to detect micro cracks or hidden damage and to determine potential fracture risks. (5) Installation condition inspection: confirming whether the spring was correctly installed in the brake mechanism and whether eccentric loading or uneven wear was present, so as to prevent stress concentration that could accelerate fatigue. These inspections allowed a comprehensive evaluation of spring performance degradation and enabled timely identification of fatigue damage or potential fracture hazards”. The evaluation metrics shown are “Answer Correctness: 0.597” and “Answer Relevancy: 0.795”.

Visualization

Close modal
Table 1

Experimental environment and parameter settings

ConfigurationParameter
CPUIntel i9 14900K
GPUNVIDIA RTX 4090
Memory128 GB
SystemWindows 11
Python3.10
RAGas0.3.6
Graph DatabaseNeo4j 5.26.0
Embedding Modelm3e-base
Embedding Dimension768
Table 2

Ablation study

MethodACAR
KG-CapsGCN-RAG0.7730.895
w/o KG0.7220.767
w/o Vector0.7090.746
w/o Rerank0.6790.759

Supplements

References

Alenjareghi
,
M.J.
,
Ghorbani
,
F.
,
Keivanpour
,
S.
,
Chinniah
,
Y.A.
and
Jocelyn
,
S.
(
2026
), “
Proactive safety reasoning in human-robot collaboration in disassembly through LLM-augmented STPA and FMEA
”,
Robotics and Computer-Integrated Manufacturing
, Vol. 
98
, 103162, doi: .
Bahr
,
L.
,
Wehner
,
C.
,
Wewerka
,
J.
,
Bittencourt
,
J.
,
Schmid
,
U.
and
Daub
,
R.
(
2025
), “
Knowledge graph enhanced retrieval-augmented generation for failure mode and effects analysis
”,
Journal of Industrial Information Integration
, Vol. 
45
, 100807, doi: .
Ceylan
,
B.O.
and
Memiş
,
S.
(
2025
), “
Fuzzy parameterized fuzzy soft matrices-based failure mode and effects analysis (FPFS-FMEA) with ship lubricating oil system risk assessment
”,
Ocean Engineering
, Vol. 
342
, 123049, doi: .
Edge
,
D.
,
Trinh
,
H.
,
Cheng
,
N.
,
Bradley
,
J.
,
Chao
,
A.
,
Mody
,
A.
,
Truitt
,
S.
,
Metropolitansky
,
D.
,
Ness
,
R.
and
Larson
,
J.
(
2024
), “
From local to global: a graph rag approach to query-focused summarization
”,
arXiv Preprint
, arXiv:.
Ervural
,
B.
and
Ayaz
,
H.I.
(
2023
), “
A fully data-driven FMEA framework for risk assessment on manufacturing processes using a hybrid approach
”,
Engineering Failure Analysis
, Vol. 
152
, 107525, doi: .
Filz
,
M.-A.
,
Langner
,
J.E.B.
,
Herrmann
,
C.
and
Thiede
,
S.
(
2021
), “
Data-driven failure mode and effect analysis (FMEA) to enhance maintenance planning
”,
Computers in Industry
, Vol. 
129
, 103451, doi: .
Gao
,
Y.
,
Xiong
,
Y.
,
Gao
,
X.
,
Jia
,
K.
,
Pan
,
J.
,
Bi
,
Y.
,
Dai
,
Y.
,
Sun
,
J.
and
Wang
,
H.
(
2023
), “
Retrieval-augmented generation for large language models: a survey
”,
arXiv Preprint
, arXiv:.
Guo
,
Z.
,
Xia
,
L.
,
Yu
,
Y.
,
Ao
,
T.
and
Huang
,
C.
(
2024
), “
Lightrag: simple and fast retrieval-augmented generation
”,
arXiv Preprint
, arXiv: .
Lu
,
J.
,
Li
,
J.
,
Li
,
W.
,
Song
,
J.
and
Xiao
,
G.
(
2024
), “
Heterogeneous propagation graph convolution network for a recommendation system based on a knowledge graph
”,
Engineering Applications of Artificial Intelligence
, Vol. 
138
, 109395, doi: .
Jiawei
,
L.
,
Zhang
,
W.
,
Lu
,
C.
,
Xiao
,
G.
and
Wang
,
Q.
(
2025
), “
A multi-scale convolution capsule network with data augmentation and attention mechanisms for elevator fault diagnosis
”,
ISA Transactions
, Vol. 
167
, pp.
1873
-
1887
, doi: .
Lu
,
J.
,
Chen
,
H.
,
Chen
,
J.
,
Xiao
,
Z.
,
Li
,
R.
,
Xiao
,
G.
and
Wang
,
Q.
(
2025
), “
Temporal knowledge graph fusion with neural ordinary differential equations for the predictive maintenance of electromechanical equipment
”,
Knowledge-Based Systems
, Vol. 
317
, 113450, doi: .
Schmitt
,
R.
and
Pfeifer
,
T.
(
2015
),
Qualitätsmanagement: Strategien–Methoden–Techniken
,
Carl Hanser Verlag GmbH Co KG
,
München
.
Suwankanit
,
T.
(
2019
), “
The identification of failure modes in the elevator installation process of a case company in Thailand by FMEA
”,
London Journal of Research of Engineering Research
, Vol. 
19
No. 
4
, pp.
21
-
28
.
Wan
,
Y.
,
Chen
,
Z.
,
Liu
,
Y.
,
Chen
,
C.
and
Packianather
,
M.
(
2025
), “
Empowering LLMs by hybrid retrieval-augmented generation for domain-centric Q&A in smart manufacturing
”,
Advanced Engineering Informatics
, Vol. 
65
, 103212.
Wang
,
Q.
,
Chen
,
L.
,
Xiao
,
G.
,
Wang
,
P.
,
Gu
,
Y.
and
Lu
,
J.
(
2024
), “
Elevator fault diagnosis based on digital twin and PINNs-e-RGCN
”,
Scientific Reports
, Vol. 
14
No. 
1
, 30713, doi: .
Wu
,
W.
,
Wang
,
H.
,
Li
,
B.
,
Huang
,
P.
,
Zhao
,
X.
and
Lei
,
L.
(
2025
), “
Multirag: a knowledge-guided framework for mitigating hallucination in multi-source retrieval augmented generation
”,
2025 IEEE 41st International Conference on Data Engineering (ICDE)
,
IEEE
.
Xiao
,
G.
,
Gu
,
H.
,
Dong
,
J.
,
Wang
,
Q.
and
Lu
,
J.
(
2024
), “
Simulation data-driven migration diagnosis method for guide rail faults in long-term service elevator
”,
China Mechanical Engineering
, Vol. 
35
No. 
01
, p.
125
.
Xiong
,
Y.
,
Tu
,
X.
and
Zhao
,
W.
(
2025
), “
AFR-Rank: an effective and highly efficient LLM-based listwise reranking framework via filtering noise documents
”,
Information Processing and Management
, Vol. 
62
No. 
6
, 104232, doi: .

Languages

or Create an Account

Close Modal
Close Modal