

Purpose
The purpose of this study is to identify how firms' sustainability performance is affected by external knowledge sources and absorptive capacity, accounting for the influence of being located in a science and technology park (STP).
Design/methodology/approach
Drawing on data from the Spanish Technological Innovation Panel, the authors estimate the determinants of sustainability performance using fixed effects multiple linear regression models with robust standard errors. The analysis covers the period 2009–2016, with a total panel of 8,874 companies and a total sample of 47,870 observations.
Findings
This study highlights the heterogeneity in on-park firms’ sustainability performance, which can be explained by the different capacities of these firms when it comes to embedding themselves in STP networks and processes and effectively absorbing the knowledge from the many knowledge sources that may be on offer in the park.
Originality/value
This paper contributes to the literature by examining the influence of external sources of knowledge and absorptive capacity, and the relationship between them, on sustainability performance. This study approaches sustainability performance as an aggregate measure of firms’ competitiveness and potential for long-term survival from the triple bottom line perspective. In addition, this study examines the effect that location in an STP can have on business sustainability performance and, more specifically, the mediating effect that knowledge sources and absorptive capacity can exert on this relationship.
Introduction
Since the beginning of the Industrial Revolution, climate change and the depletion of natural resources resulting from human activities have gradually intensified and become issues that urgently need to be solved (Wadanambi et al., 2020; Abbas and Sağsan, 2019). In addition to this environmental impact, the prevailing production and consumption model has brought with it other pernicious effects in the social sphere. Thus, there is a pressing need for all economic agents to work together to address some major societal objectives such as providing citizens with stable jobs and decent working conditions (Fleetwood, 2020; UN, 2015).
The concept of sustainability, referred to as nature’s ability to regenerate its ecosystems, can be applied to address the aforementioned social and environmental concerns and help ensure the continuing economic progress of societies (Hall, 2019; UN, 2015). Focusing on the business sphere, recent research (Wijethilake, 2017) suggests that sustainability is becoming a crucial aspect of the strategic management of companies all around the world.
Thus, corporate performance and long-term competitiveness increasingly depend on the ability to balance economic, environmental and social expectations (Forés, 2019; Sáez-Martínez et al., 2016). However, achieving such a balance requires substantial new knowledge about technologies, markets and organizational procedures (Walsh et al., 2020; Forés, 2019; Imaz and Sheinbaum, 2017). This knowledge, which is characterized by its complexity, specificity and distribution among a wide range of economic agents, is necessary to optimize firms’ performance from the triple bottom line perspective of sustainability (Sáez-Martínez et al., 2016; Chesbrough, 2003).
That said, not all external knowledge is directly translated into firms’ sustainability performance. Certain types of knowledge that are more tacit in nature and less closely related to firms’ prevailing values, cognitive patterns and knowledge background force firms to invest in developing their capacity to absorb this external knowledge. Absorptive capacity is crucial for the acquisition and assimilation of new external knowledge and its transformation and application to firms’ systems, processes and operations; the goal of doing so is to not only refine existing knowledge and competences but also create new operations and capacities (Camisón and Forés, 2010).
In light of the above, it can be inferred that it is important for firms’ sustainability performance to be embedded in environments that contain various different kinds of organizations, giving rise to a wide variety of knowledge flows and spillovers. Science and technology parks (STPs) are infrastructures designed to host organizations of a different nature, such as established companies, start-ups, research institutes or technological institutes, among others (Guadix et al., 2016). In STPs, physical proximity and shared services and management tasks stimulate the interaction between the organizations located there and can foster the generation and diffusion of new knowledge and technology (Díez-Vial and Fernández-Olmos, 2015).
Numerous studies have tried to establish whether an organization’s location in an STP has a positive impact on certain economic or innovative performance variables, although the results are inconclusive (Lecluyse et al., 2019; Guadix et al., 2016). Although most of the related research confirms a positive and statistically significant effect (Ubeda et al., 2019; González-Masip et al., 2019; Albahari et al., 2017), some studies report non-significant relationships (Lamperti et al., 2017; Liberati et al., 2016).
However, to the best of our knowledge, there are no studies that empirically examine whether location in an STP is an antecedent of improved sustainability performance in an organization, especially from the triple bottom line perspective of sustainability. Similarly, there has been very little research on the external (knowledge flows) and internal (firms’ absorptive capacity) elements that affect sustainability performance.
This study, thus, contributes to the literature by testing the influence of on-park location on business sustainability performance; moreover, it examines the mediating effect of knowledge sources and absorptive capacity on that relationship. The objective is to provide evidence on how the benefits of on-park location depend on not only firms’ embeddedness in the STP but also the diverse sources of knowledge available there and firms’ internal strategies to absorb and exploit that external knowledge (Díez-Vial and Fernández-Olmos, 2015).
To empirically test the above relationships, we use data from Spanish Technological Innovation Panel (PITEC) (2009–2016), a panel database containing information on Spanish firms. Like other European countries, Spain is striving to promote STPs as part of a national innovation policy (González-Masip et al., 2019).
The results show that more plentiful knowledge sources can have an important impact on sustainability performance. In addition, external sources of knowledge can provide access to a diversity of connected experiences, promoting firms’ internal generation of knowledge and other learning capabilities (Camisón et al., 2018). These learning capabilities enable a firm to recognize the value of external knowledge, assimilate it, disseminate it within its internal knowledge base and then use it to discover novel opportunities in the external environment. Therefore, the diversity of knowledge sources facilitates improvements in efficiency. Moreover, through the effect on absorptive capacity, it empowers the disruptiveness needed to enhance existing capabilities and create new ones that enable better economic, social and environmental performance.
The results also show that although being part of an STP can provide on-park firms with potentially beneficial resources, infrastructure and services, they need to ensure that they are embedded in the environment of knowledge creation and dissemination. In other words, on-park location is not in itself enough to affect either the absorptive capacity or the sustainability performance of on-park firms; park location must stimulate firms’ contact with and integration in different networks/sources of knowledge (Díez-Vial and Fernández-Olmos, 2015).
In light of the above, this study highlights the heterogeneity in on-park firms’ sustainability performance, which can be explained by differences in firms’ capacities when it comes to embedding themselves in STP networks and processes and effectively absorbing the knowledge from the sources on offer in the park.
Following this introduction, second section presents the literature review and the research hypotheses. The third section describes the methodology applied to our panel database of Spanish firms (PITEC). The fourth section reports the results of the study. Finally, the fifth section outlines the main conclusions, future lines of research and important implications for academics, practitioners and political decision-makers.
Theory and hypotheses
Effects of external knowledge sources and firms’ absorptive capacity on sustainability performance
A company’s ability to adapt to changes in its environment is essential to sustain its competitive advantage and ensure its long-term survival (Teece, 2014). Sustainability, which is fundamentally about achieving a balance of economic, social and environmental performance, represents a paradigm shift in competitive markets and in the way companies create and sustain competitive advantages (Shahzad et al., 2020). To meet the challenges that sustainability imposes on companies, there is a consensus in the literature that companies will need to build up their knowledge of new sustainability practices, technologies, legal requirements and solutions (Walsh et al., 2020; Abbas and Sağsan, 2019; Forés, 2019; Imaz and Sheinbaum, 2017).
The literature points out that leveraging external knowledge is key to improving firms’ sustainability performance (Abbas and Sağsan, 2019), and this external knowledge can come from different sources (Hernández-Trasobares and Murillo-Luna, 2020; García-Martinez et al., 2017; Rodríguez et al., 2017): for example, the market (i.e. firms’ suppliers, customers and competitors); education and research; conferences and trade fairs; or scientific journals and trade publications. According to Sáez-Martínez et al. (2016), firms that draw on diverse external sources will be more environmentally oriented in their innovation processes. Similarly, van Hoof and Thiell (2014) claim that in dynamic interactions with external partners, even incremental actions can help improve organizational sustainability performance.
The more varied these sources of knowledge are, the more likely it is that the firm will find synergies with its existing knowledge endowments, mental models and cognitive bases. Such synergies should result in a more effective exploitation of the firm’s resources and capabilities for environmental aims.
The social structure underlying knowledge sources may, thus, have a clear impact on sustainability initiatives aimed at incrementally adapting technologies, product designs and even organizational procedures to new market trends, legal regulations and the requirements of society and stakeholders. It also has important implications for the firm’s value creation process.
Therefore, we propose the following hypothesis:
External knowledge sources have a positive effect on sustainability performance.
Not all external knowledge sources are related to firms’ current knowledge background, experiences and cognitive models (Camisón et al., 2018). As such, they can point to new avenues for firms to improve their sustainability performance. The greater the number of external knowledge sources, the greater the probability that the firm will discover unfamiliar technologies and components and knowledge of new markets, environmental standards, etc., needed for innovation in sustainability (Sáez-Martínez et al., 2016). As this external knowledge tends to be tacit, complex, innovative in nature and stemming from a diverse set of network connections, firms’ absorptive capacity becomes crucial (Cohen and Levinthal, 1990; Camisón and Forés, 2010).
Absorptive capacity enables the exploration, assessment, integration and use of new knowledge in the organization, thereby enabling improvement in the social, economic and environmental aspects of sustainability performance (Abbas and Sağsan, 2019; Albort-Morant et al., 2018; Ingenbleek and Dentoni, 2016; van Hoof and Thiell, 2014). It involves discovering novel associations with the external environment and exploring new combinations of internal and external knowledge. Although integrating that knowledge requires the firm to make a greater effort at learning (Camisón et al., 2018; Cohen and Levinthal, 1990), it can help prevent competence traps (Todorova and Durisin, 2007). To increase its absorptive capacity, the firm may seek to boost its internal research and development (R&D) endowments, draw on external R&D, acquire new technology or improve the training of its workforce (Song et al., 2018; García-Martinez et al., 2017; Camisón and Forés, 2010; Cohen and Levinthal, 1990).
Firms must make an active effort to develop their absorptive capacity to capture knowledge spillovers that can enhance their sustainability performance (Dzhengiz and Niesten, 2020; Shahzad et al., 2019, 2020; van Hoof and Thiell, 2014). Therefore, absorptive capacity enables the firm to leverage the impact of knowledge sources, harnessing the more tacit aspects of the social knowledge structure for innovation, exploring new combinations of knowledge resources, discovering potentially innovative applications and incorporating green technologies. This will ultimately have a significant impact on improving sustainability performance. As such, we propose the second hypothesis:
Absorptive capacity mediates the relationship between external knowledge sources and sustainability performance.
Effects of belonging to a science and technology park on sustainability performance
STPs are a policy initiative that can foster key elements of firm success, such as better economic performance (Arauzo-Carod et al., 2018), business growth (Díez-Vial and Fernández-Olmos, 2017) or better innovation performance (Ubeda et al., 2019; Lamperti et al., 2017). However, while some empirical studies show the benefits of on-park location in terms of economic or innovative performance (Arauzo-Carod et al., 2018; Albahari et al., 2017), others report opposite results or non-significant effects of STPs on firm performance (Lamperti et al., 2017; Liberati et al., 2016).
The fact that most previous studies consider the firms located in an STP as a homogeneous group may explain the aforementioned contradictory empirical results. In this regard, several recent empirical studies that base their analyses on the more dynamic resource-based view of the firm (Teece et al., 1997; Barney, 1991) point out that the disparity in these results can be explained by internal firm dynamics and firms’ ability to take advantage of the benefits and opportunities offered by STPs (Ubeda et al., 2019; Claver-Cortés et al., 2018).
STPs provide on-park companies with cutting-edge technological infrastructure; enhanced image and prestige; and easy access to customers, technological research centres and a highly trained workforce (González-Masip et al., 2019; Gwebu et al., 2019; Arauzo-Carod, 2018; Vásquez-Urriago et al., 2016). The park’s management team also provides business advice and marketing and financial services (Diez-Vial and Fernández-Olmos, 2017).
STPs can also create an enabling environment and atmosphere of trust, guided by explicit and implicit rules (Camisón, 2004). They can also help reduce the risks of opportunistic behaviour and related coordination costs, as well as “cognitive distance” and search and transaction costs (Agostini and Nosella, 2019; Díez-Vial and Fernández-Olmos, 2015). This beneficial atmosphere that combines cooperative and competitive relationships between co-located agents can promote the generation and transmission of knowledge and ideas across companies (González-Masip et al., 2019; Díez-Vial and Fernández-Olmos, 2015).
Despite all these benefits, the literature that takes a strategic and dynamic perspective when analysing these territorial agglomerations (Ubeda et al., 2019; Claver-Cortés et al., 2018) underlines the fact that geographic location alone does not determine the performance of on-park firms; together with other agents, networks and institutions in the park, these firms must form part of the generation of new flows of knowledge about products/processes, markets and technologies (González-Masip et al., 2019; Camisón, 2004; Porter, 1998b, Granovetter, 1985).
Integration in a park fosters efficient knowledge creation and transfer among embedded partners that share similar experiences, values and norms that generate a sense of connectedness to the territory (Enkel et al., 2018). This shared understanding (and similar heuristics and procedures) increases on-park firms’ ability to identify external sources of knowledge by leveraging and refining each firm’s unique understanding of the environment (González-Masip et al., 2019; Gwebu et al., 2019; Lecluyse et al., 2019; Arauzo-Carod et al., 2018; Claver-Cortés et al., 2018) for sustainability purposes (Walsh et al., 2020).
Given the above, we hold that location in an STP can impact firms’ triple bottom line sustainability performance, provided the STP generates a fruitful environment of external knowledge sources that firms – duly embedded in the networks, processes and communities of the park – can harness.
Therefore, we propose the third hypothesis as follows:
External knowledge sources mediate the relationship between a firm belonging to a science and technology park and sustainability performance.
STPs typically bring together a wide range of agents, such as start-ups, enterprises, technology centres and university research units. Being part of an STP increases the number of external knowledge sources that a company can access. If it is similar to the company's current knowledge base, then much of this external knowledge can be quickly integrated and then used to exploit internal resources more efficiently and boost sustainability performance (H1). However, if this external knowledge is too similar to the existing cognitive bases of on-park firms, then it can lead to redundancy. That is, park-specific technology and operating norms are easily codifiable and transferable to all their members (Camisón et al., 2018).
Nevertheless, the greater the number and variety of knowledge sources to which a firm is exposed, the greater the probability that this external knowledge will not be related to the firm’s existing knowledge bases, mental models and cognitive patterns (Dzhengiz and Niesten, 2020; Shahzad et al., 2019, 2020; Forés and Camisón, 2016). In this sense, most of these knowledge spillovers in an STP will involve knowledge that is complex, tacit and innovative in nature, precisely because of the variety of agents involved in its development (Ubeda et al., 2019; Song et al., 2018; Forés and Camisón, 2016). Hence, to maintain their competitive position and ensure long-lasting effects on sustainability outcomes, firms must seek ways to relate to and incorporate these external sources of knowledge.
In line with the seminal article by Cohen and Levinthal (1990), the wealth of socially complex and high-value knowledge spillovers that flourish from embeddedness in an STP can exert a push effect on co-located organizations, encouraging them to take maximum advantage of these knowledge opportunities by increasing their absorptive capacity (Song et al., 2018; van Hoof and Thiell, 2014).
From this perspective, absorptive capacity amplifies the benefits of park location in terms of knowledge generation, sharing and combination (Dzhengiz and Niesten, 2020; Ubeda et al., 2019; Shahzad et al., 2019, 2020; Song et al., 2018; Forés and Camisón, 2016). Without this absorptive capacity, it will be difficult for companies to take advantage of the most disruptive and novel knowledge spillovers from different external sources and recombine them to improve sustainability performance (Forés and Camisón, 2016). Therefore, considering these arguments, we propose the following hypothesis:
External knowledge sources and absorptive capacity mediate the relationship between belonging to a science and technology park and a firm’s sustainability performance.
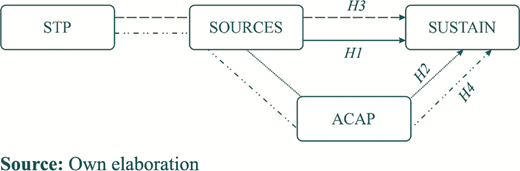
The model of our hypotheses is illustrated in Figure 1.
Methodology
Data and sample
We use PITEC data for Spanish companies. PITEC is based on the Community Innovation Survey (CIS), a survey conducted to analyse EU firms’ innovation activities and results (Estrada and Zhou, 2022). Questionnaires are sent to the CEOs of organizations from all sectors, with a response rate across the survey period of approximately 92%. PITEC has a panel structure and contains organization-level data.
The research covers the period 2009–2016, as there is no information on some of the study variables (e.g. sustainability performance) before the study period. In our analysis, we use an unbalanced panel of 8,874 companies which have engaged in some sort of sustainability activities during the seven-year period studied, yielding a total sample of 47,870 observations. In each survey wave, economic units are asked to provide information for the current year and the two previous years.
PITEC is one of the most widely used data sets in innovation studies focusing on Spain (Alarcón et al., 2019; Rodríguez et al., 2017). More specifically, various authors (Diez-Vial and Fernández-Olmos, 2017; Díez-Vial and Fernández-Olmos, 2015) have used PITEC to advance the understanding of Spanish organizations’ location in an STP and innovation activities.
In addition, there has been a rise in studies that use PITEC data to analyse social (González-Masip et al., 2019; Kunapatarawong and Martínez-Ros, 2016) and environmental aspects (Acebo et al., 2021; Arranz et al., 2021; González-Blanco et al., 2018; Guisado-Gonzalez et al., 2021). This trend can be explained by the incorporation in 2008 of variables related to environmental and social innovation objectives (with additional items added in 2009), in response to the Oslo Manual. It also reflects the greater efforts shown by Spanish organizations in eco-innovation (Acebo et al., 2021) and its increasing relevance for the Spanish economy (Kunapatarawong and Martínez-Ros, 2016).
Similarly, the CIS has been used in other European eco-innovation studies (Parrilli et al., 2022). However, no studies to date have analysed the contributions of STPs to triple bottom line sustainability performance by considering the impact of external knowledge sources and the different ways firms absorb external knowledge.
Measures
Dependent variable.
Following previous approaches used to measure this dependent variable (Acebo et al., 2021; González-Blanco et al., 2018), we calculate sustainability performance (SUSTAIN) as the sum of scores about the importance of 16 actions undertaken while developing market, social and environmental innovations. These questions were answered on a four-point scale of importance (ranging between 0 for “not used” and 3 for “high importance”), but before summing the items, we coded these questions as binary variables (1 if the company indicates either “medium” or “high” importance, 0 otherwise). Specifically, we consider the following items:
Economic dimension related to market (product and process) innovations
Products
Increase in the number of products or services offered;
Substitution of old product;
Penetration into new markets;
Increase in market share; and
Improvement in quality.
Processes
Increase in production flexibility;
Increase in production capacity; and
Labour cost reduction (per unit).
Environmental dimension (green innovation and compliance)
Material cost reduction (per unit);
Energy cost reduction (per unit);
Reduction in environmental impact; and
Compliance with environmental, health and safety regulations.
Social dimension
Increase in total employment;
Increase in qualified employment;
Job stability; and
improvement in employees’ health and safety.
Independent variable.
Belonging to a science and technology park (STP).
To measure the STP location effect, we created a binary variable (0–1) called belonging to an STP, which takes a value of 1 if the company is located in an STP and 0 otherwise, in line with previous studies (Diez-Vial and Fernández-Olmos, 2017).
Mediator variables.
External sources of knowledge (SOURCES).
Considering previous research (Rodríguez et al., 2017; Guisado-González et al., 2017), we measure external sources of knowledge as the sum of scores about the importance of the following external information sources for the innovation process:
suppliers;
clients; [1]
competitors;
consultants and commercial labs;
universities or other higher education institutions;
public research institutes;
technological institutes;
conferences, trade fairs and exhibitions;
scientific journals and technical publications; and
professional and industry associations.
Each source was measured with an item capturing the degree of importance (ranging between 0 for “not used” and 3 for “high”). We rescaled each item before aggregating them, assigning a value of 0 (not used and low importance) or 1 (medium and high importance). Thus, with ten items in total, the final external knowledge sources measure ranges from 0 to 10.
Absorptive capacity (ACAP).
In line with the Oslo Manual and following previous studies (Diez-Vidal and Fernández-Olmos, 2017), we consider five items that describe the innovation capabilities linked to a company’s absorptive capacity:
internal R&D;
external R&D;
acquisition of machinery and equipment;
acquisition of external knowledge; and
internal and external training for innovation activities.
Many previous studies have demonstrated that these items impact the firm’s ability to acquire, assimilate, combine and effectively apply new external knowledge to develop new capabilities and engage in innovation (Cohen and Levinthal, 1990; Phene and Almeida, 2008; Camisón and Forés, 2010).
Internal R&D; This binary variable (0–1) takes the value 1 if the firm has carried out internal R&D activities during the year.
External R&D: This binary variable (0–1) takes the value 1 if the firm has carried out external R&D activities during the year.
Acquisition of machinery and equipment: This binary variable (0–1) takes the value 1 if the firm has acquired advanced machinery, equipment, hardware or software intended for the production of new products or processes during the year. This category only includes the acquisition of capital goods for innovation that is not included in R&D activities.
Acquisition of external knowledge: This binary variable (0–1) takes the value 1 if the firm has acquired external knowledge for innovation, such as licenses, patents, disclosures of know-how, trademarks, designs or other inventions during the year.
Internal and external training for innovation activities: This binary variable (0–1) takes the value 1 if the firm has trained (internal or external training) its personnel for the development or introduction of new products or processes.
To measure absorptive capacity, we sum the scores of these five binary variables. The value of a firm’s absorptive capacity variable, thus, ranges from 0 to 5.
Control variables.
Different factors that could have an effect on sustainability performance are also included in the model as control variables.
Size (SIZE): To capture the effect of the company’s size on sustainability performance (PONER), we use a dummy variable (0–1) that takes the value 1 if the firm has 200 or more employees and 0 otherwise (Claver-Cortés et al., 2016).
Business group affiliation (GROUP): This variable takes the value 1 if the business is part of a group, whether as the parent company, a subsidiary, a joint venture or an associate (Guisado-Gonzalez et al., 2021; Alarcón et al., 2019; Rodríguez et al., 2017).
Exports (EXPORTS): This variable takes the value 1 if the business is an exporter and 0 otherwise (Alarcón et al., 2019; Rodríguez et al., 2017).
The external public funding is used to develop innovation processes (FUNDS). PITEC distinguishes public funding according to origin:
from local or regional governments;
from the national government; and
from the European Union.
We use a dummy variable (public funding) to reflect the use of public funding. It takes the value 1 if the company receives any public funding from any of the abovementioned institutions and 0 otherwise. This control variable has also been used in previous related literature (Alarcón et al., 2019; Rodríguez et al., 2017).
Industry (INDUSTRY): We introduce a dummy variable that takes the value 1 if the business belongs to the manufacturing industry and 0 to the service industry (Arranz et al., 2019).
Cooperation (COOP): We use a dummy variable that takes the value 1 if the company cooperates with other companies or institutions (Guisado-Gonzalez et al., 2021; Díez-Vial and Fernández-Olmos, 2015; Alarcón et al., 2019; Rodríguez et al., 2017) and 0 otherwise.
Newness (NEWNESS) is measured through the share of products or services new to the market (Alarcón et al., 2019).
We could not control for the firm’s age because of multicollinearity problems in the panel regression.
We use Cronbach’s alpha to evaluate the internal consistency of each construct. The minimum acceptable value is 0.7 or 0.6 in exploratory studies (Hair et al., 1998). The results show that all the constructs had values above the cut-off. The absorptive capacity construct has a value close to 0.6, which we consider acceptable for this study.
The correlation values among all variables are generally low to moderate, suggesting there is a low risk of multicollinearity or redundancy issues with this set of variables. The general rule of thumb is that correlation values should not exceed 0.6 (Churchill, 1979); in our case, the highest correlation is 0.551, below the problematic level. This is confirmed by the analysis of the variance inflation factor. The maximum variance inflation factor value is 1.39, well below the rule-of-thumb cut-off of 10, which again indicates that there are no serious multicollinearity problems in the models (Hair et al., 2006). Table 1 presents the summary statistics and Table 2 the correlations among the study variables.
Descriptive statistics
| Variable | Mean | SD | Minimum | Maximum |
|---|---|---|---|---|
| SUSTA overall between within | 8.502 | 4.998 | 0 | 16 |
| 4.285 | 0 | 16 | ||
| 3.061 | −5.498 | 21.377 | ||
| STP overall between within | 1.049 | 0.216 | 1 | 2 |
| 0.203 | 1 | 2 | ||
| 0.071 | 0.174 | 1.924 | ||
| SOURCE overall between within | 3.674 | 2.887 | 0 | 10 |
| 2.391 | 0 | 10 | ||
| 1.706 | −5.076 | 12.423 | ||
| ACAP overall between within | 5.870 | 1.049 | 5 | 10 |
| 0.856 | 5 | 10 | ||
| 0.600 | 3.120 | 9.995 | ||
| SIZE overall between within | 1.263 | 0.440 | 1 | 2 |
| 0.405 | 1 | 2 | ||
| 0.134 | 0.388 | 2.138 | ||
| GROUP overall between within | 1.436 | 0.496 | 1 | 2 |
| 0.468 | 1 | 2 | ||
| 0.164 | 0.561 | 2.311 | ||
| EXPORT overall between within | 0.634 | 0.482 | 0 | 1 |
| 0.444 | 0 | 1 | ||
| 0.208 | −0.241 | 1.509 | ||
| FUNDS overall between within | 0.265 | 0.441 | 0 | 1 |
| 0.350 | 0 | 1 | ||
| 0.265 | −0.610 | 1.140 | ||
| INDUST overall between within | 0.512 | 0.500 | 0 | 1 |
| 0.492 | 0 | 1 | ||
| 0.090 | −0.363 | 1.387 | ||
| COOP overall between within | 1.403 | 0.491 | 1 | 2 |
| 0.390 | 1 | 2 | ||
| 0.305 | 0.528 | 2.278 | ||
| NEW overall between within | 7.247 | 20.009 | 0 | 100 |
| 14.248 | 0 | 100 | ||
| 14.567 | −79.003 | 94.747 |
Correlation and variance inflation factor coefficients
| SUSTAIN | STP | SOURCES | ACAP | SIZE | GROUP | EXPORTS | FUNDS | INDUSTRY | COOP | NEWNESS | VIF | |
|---|---|---|---|---|---|---|---|---|---|---|---|---|
| SUSTAIN | 1 | Mean VIF = 1.24 | ||||||||||
| STP | 0.0411*** | 1 | 1.06 | |||||||||
| SOURC | 0.551*** | 0.124*** 1 | 1.32 | |||||||||
| ACAP | 0.386*** | 0.100*** | 0.391*** | 1 | 1.38 | |||||||
| SIZE | 0.0548*** | −0.0329*** | 0.0464*** | 0.122*** | 1 | 1.22 | ||||||
| GROUP | 0.0800*** | −0.0156*** | 0.0626*** | 0.121*** | 0.392*** | 1 | 1.22 | |||||
| EXPOR | 0.179*** | −0.0184*** | 0.120*** | 0.151*** | −0.0208*** | 0.109*** | 1 | 1.24 | ||||
| FUNDS | 0.228*** | 0.154*** | 0.345*** | 0.390*** | 0.0146** | 0.0335*** | 0.115*** | 1 | 1.34 | |||
| INDUS | 0.158*** | −0.155*** | 0.0111*** | 0.0627*** | −0.117*** | 0.0118** | 0.399*** | −0.0179*** | 1 | 1.25 | ||
| COOP | 0.246*** | 0.116*** | 0.363*** | 0.353*** | 0.114*** | 0.149*** | 0.0607*** | 0.376*** | −0.0624*** | 1 | 1.33 | |
| NEW | 0.124*** | 0.0561*** | 0.126*** | 0.116*** | −0.0383*** | −0.0287*** | 0.0425*** | 0.115*** | −0.0173*** | 0.106*** | 1 | 1.03 |
Notes:
t-statistics in parentheses; * p < 0.05; ** p < 0.01; *** p < 0.001
In addition, we performed a number of statistical analyses to assess the severity of common method bias. First, the Harman one-factor test on the items indicated that this bias was not an issue. That is, multiple factors were detected, and the variance did not merely stem from the first factors (Podsakoff et al., 2003). In fact, the independent variables included in the model form several factors with eigenvalues higher than 1, and the first two factors capture only 23.35 and 13.57% of the total variance. We also included control variables that have a bivariate correlation with the other variables in the model of below 0.4 (Siemsen et al., 2010).
Model and estimation
Although multiple linear regression is used to test the hypotheses, a variety of models are estimated because not all hypotheses can be tested in the same way. Taking into account the fact we use panel data and to control for endogeneity, we estimate the determinants of sustainability performance using fixed effects multiple linear regression models (Acebo et al., 2021; Alarcón et al., 2019) with robust standard errors, which accounts for unobserved firm fixed effects and firm-specific autocorrelation.
The fixed effects model is appropriate when it is assumed that there are unobservable effects correlated with the independent variables in the model (Greene, 2012). These fixed or time-invariant effects are associated with the individual units under study (in our case, each firm) and generate time-invariant unobservable heterogeneity. A company’s unique characteristics should not be compared with those of other companies, so in fixed effects models, the time-invariant effects are eliminated. By contrast, in a dynamic or variable effects model, the variations between entities are assumed to be random and, more importantly, uncorrelated with the independent variables (Greene, 2012).
We also tried random effects linear models, but the Hausman specification test rejected the null hypothesis of no correlation between individual effects and regressors ( Appendix), and the additional test conducted confirmed the results obtained with fixed effects.
H1 predicts direct effects between variables, whereas H2, H3 and H4 posit mediating effects. Our mediation hypotheses postulate a mediation effect:
of absorptive capacity on the impact of external knowledge sources on sustainability performance (H2);
of external knowledge sources on the impact of belonging to an STP on sustainability performance (H3); and
of external knowledge sources, first and absorptive capacity on the relationship between belonging to an STP and a firm’s sustainability performance (H4).
To test these mediation hypotheses, we follow the methodology proposed by Baron and Kenny (1986). According to Baron and Kenny (1986), the analysis of the mediating effect requires the formulation of three equations. In the first equation, the dependent variable is estimated using independent and control variables, and the equation is the same as that of the direct effect. In the second equation, the mediator variable is estimated using independent and control variables.
In the third, the dependent variable (Y) is simultaneously estimated using the independent (X), mediator (Me) and control variables (c), for firm i at time t:
Thus, step 1 of the test for mediation is to show that a significant relationship exists between the independent variable and the dependent variable; step 2 is to show that a significant relationship exists between the independent variable and the mediator; and step 3 is to show that the mediator variable is related to the dependent variable. In other words, β11 ≠ 0, α21 ≠ 0, β32 ≠ 0 and/β31/</β11/ – all of these coefficients must be statistically significant.
Finally, step 4 is to show that the effect of the independent variable on the dependent variable is weaker when the mediator variable is included in the model. If these four conditions described by Baron and Kenny (1986) are met, then we can conclude that a mediation effect occurs. Additionally, we use Sobel tests (Baron and Kenny, 1986) and bootstrapping confidence intervals (CIs) to test all these indirect effects on sustainability performance.
The Sobel test of significance assumes that the indirect effect of the independent variable is normally distributed, an assumption that may make this a conservative test (Mackinnon et al., 1995). The indirect effect is considered to be significant when the Sobel test Z-value is significant (>1.96).
Bootstrapping (Shrout and Bolger, 2002) is a non-parametric method that takes into account the skew of the distribution. When the resulting bootstrapped CIs do not contain the value 0, the indirect effect is different from 0. As these tests make different assumptions, it is advisable to use them both.
The Stata Statistical Package version 17 was used for the calculations.
Results
Table 3 presents the models used to test the hypotheses. As can be seen, the F-test of significance is acceptable for all the models estimated. For the complete model (Model 4), the value of overall R2 indicates that it explains 34.1% of the variance in sustainability performance, above the threshold of 0.1 set by Falk and Miller (1992).
Estimation results
| (1) | (2) | (3) | (4) | (5) | (6) | |
|---|---|---|---|---|---|---|
| Model I | Model II | Model III | Model IV | Model V | Model VI | |
| VARIABLES | SUSTAIN | SOURCES | ACAP | SUSTAIN | SUSTAINInstrumented | SUSTAIN GMM |
| L1.SUSTAIN | 0.232*** | |||||
| STP | 0.463* (0.022) | 0.394** (0.033) | 0.048 (0.011) | 0.115 (0.005) | 0.084 (0.223) | −0.066 (0.324) |
| SOURCES | 0.063*** (0.170) | 0.769*** (0.444) | 0.728*** (0.015) | 0.779*** (0.019) | ||
| ACAP | 0.616*** (0.128) | 0.554*** (0.034) | ||||
| ACAP (instrumented) | 1.267*** (0.096) | |||||
| SIZE | 0.487*** (0.042) | 0.254*** (0.038) | 0.228*** (0.095) | 0.142 (0.012) | −0.006 (0.144) | 0.002 (0.199) |
| GROUP | 0.075 (0.007) | 0.019 (0.003) | −0.026 (−0.012) | 0.076 (0.007) | 0.093 (0.114) | −0.068 (0.159) |
| EXPORTS | 0.355*** (0.031) | 0.194*** (0.030) | −0.016 (−0.007) | 0.208** (0.018) | 0.220*** (0.085) | 0.044 (0.116) |
| FUNDS | 0.844*** (0.082) | 0.494*** (0.083) | 0.412*** (0.193) | 0.191*** (0.018) | −0.077 (0.067) | 0.180** (0.074) |
| INDUSTRY | 0.271 (0.026) | 0.073 (0.012) | 0.072 (0.034) | 0.167 (0.016) | 0.120 (0.224) | 0.398 (0.323) |
| COOP | 1.292*** (0.127) | 0.918*** (0.156) | 0.203*** (0.095) | 0.425*** (0.041) | 0.292*** (0.064) | 0.396*** (0.084) |
| NEWNESS | 0.008*** (0.039) | 0.003*** (0.028) | 0.001*** (0.025) | 0.004*** (0.023) | 0.004*** (0.001) | 0.003** (0.001) |
| Constant | 4.639*** | 1.206*** | 5.282*** | 0.411 | −3.026*** | −0.582 |
| Observations | 47,870 | 47,870 | 47,870 | 47,870 | 47,870 | 29,356 |
| Number of ident | 8,874 | 8,874 | 8,874 | 8,874 | 8,874 | |
| R2 within | 0.031 | 0.042 | 0.087 | 0.243 | 0.223 | |
| R2 between | 0.189 | 0.290 | 0.434 | 0.447 | 0.453 | |
| R2 overall | 0.112 | 0.189 | 0.262 | 0.344 | 0.341 | |
| F statistics | 80.55*** | 99.85*** | 241.82*** | 499.85*** | ||
| Wald Chi-square | 534,842.78 | 2,589.595 | ||||
| rho | 0.587 | 0.573 | 0.446 | 0.545 | 0.531 |
Notes:
Robust standard error in parentheses; *p < 0.05; **p < 0.01; ***p < 0.001
The results from the regression analysis in Model 1 indicate that except for the firm belonging to a group (GROUP) and a specific industry (INDUSTRY), which do not have a significant effect on sustainability performance, all the control variables considered (size, exports, funding, cooperation and newness) have a positive significant effect on sustainability performance.
Model 4, which analyses the effects of all the independent variables considered on sustainability performance, shows the positive and significant direct effect of external knowledge sources (β = 0.769 and p < 0.001) on sustainability performance, providing support for H1.
Results of Model 3 confirm the positive and significant impact of external knowledge sources on absorptive capacity (β = 0.063 and p < 0.001). Considering the results obtained in support of H1 and the direct effect that absorptive capacity has on sustainability performance (β = 0.616 and p < 0.001) (Model 4), Model 3 provides evidence of the partially mediating effect that absorptive capacity has on the relationship between external knowledge sources and sustainability performance (β = 0.039 and p < 0.001), posited in H2.
Model 4 also shows that the direct effect of a firm belonging to an STP on sustainability performance is positive but not significant (β = 0.115 and p > 0.05). However, Model 1, which tests only the effect of belonging to an STP on sustainability performance, indicates a significant positive effect between the two variables (β = 0.463 and p < 0.05). If the impact of a firm belonging to an STP on mediating variables is confirmed in Models 2 and 3, then we can confirm our results meet all the requirements of mediation analysis.
Model 2 shows that belonging to an STP is positively related to external knowledge sources (β = 0.394 and p < 0.01). Considering the results in support of H1, we can confirm the mediating effect that external knowledge sources have on the relationship between belonging to an STP and sustainability performance (β = 0.303 and p < 0.01), as posited in H3.
Model 3 shows that belonging to an STP has no direct effect on absorptive capacity (β = 0.048 and p > 0.05). This result, thus, confirms that the relationship between belonging to an STP and absorptive capacity is fully mediated by external knowledge sources (β = 0.025 and p < 0.001). Therefore, considering all the previous results, we can confirm our H4, specifying that the relationship between STP location and sustainability performance is, first, fully mediated by external knowledge sources and, second, partially mediated by absorptive capacity (β = 0.015 and p < 0.01). We also confirm all the mediating effects through bootstrapping CIs.
Robustness tests and alternative models
In addition to the common tests for goodness of fit and model performance, which indicate the acceptability of the estimates, we control for the problems of endogeneity that are generated in the estimation of the causal relationships in the model.
Although fixed effects estimations eliminate any autocorrelation bias, to account for the potential endogeneity of absorptive capacity, we complement the analysis by using an instrumental variable approach. Following previous literature (Alarcón et al., 2019; Claver-Cortés et al., 2016), we instrument the variable using SKILLEDR&D, measured as the total number of researchers involved in the firm’s internal R&D divided per total employees in R&D (see Appendix for the regression results between ACAP and the instrument variable). The results reinforce those obtained in the first estimation of Model 4 (Table 3).
In addition, using dynamic panel data with one-step difference GMM, we include the lag of the dependent variable sustainability performance to test for sustainability strategy persistence and the endogeneity problem. The main results from Model 4 in Table 3 hold with only minor changes, as shown in Model 6 (Table 3). Furthermore, we apply the Arellano and Bond (1991) difference GMM estimator, confirming that the estimation is consistent and that the errors do not suffer from second-order serial autocorrelation (AR (2) pr > z = 0.109).
We also performed a robustness check of our main panel fixed effects model. We ran the fixed effects model using a balanced panel of 27,560 observations and 3,445 firms. The results, available from the authors on request, confirm those obtained for the entire panel of 8,874 firms considered in our first estimation.
Finally, we cross-checked our results using alternative measures for sustainability performance based on the triple bottom line conceptualization of the construct. Specifically, we consider each dimension that makes up the sustainability performance construct: economic (comprising items related to market product and process technology), environmental (items related to green technology and compliance with standards) and social (items related to employment and employees’ qualifications and welfare). We, thus, ran five additional model specifications (Table 4).
Estimation results for each of the sustainability performance dimensions
| (1) | (2) | (3) | (4) | (5) | (6) | |
|---|---|---|---|---|---|---|
| Model I | Model II | Model III | Model IV | Model V | Model VI | |
| Variables | Product dimension | Process dimension | Economic sustainability performance | Environmental sustainability performance | Social sustainability performance | Sustainability performance |
| STP | 0.020 (0.002) | 0.042 (0.008) | 0.063 (0.005) | 0.036 (0.006) | 0.016 (0.002) | 0.115 (0.005) |
| SOURCES | 0.237*** (0.376) | 0.139*** (0.321) | 0.376*** (0.414) | 0.182*** (0.359) | 0.212*** (0.375) | 0.769*** (0.444) |
| ACAP | 0.206*** (0.119) | 0.164*** (0.137) | 0.370*** (0.147) | 0.112*** (0.080) | 0.134*** (0.085) | 0.616*** (0.128) |
| SIZE | 0.072 (0.017) | −0.000(−4.48e − 05) | 0.072 (0.012) | 0.000 (0.000) | 0.069 (0.018) | 0.142 (0.012) |
| GROUP | −0.028 (−0.007) | −0.021 (−0.008) | −0.050 (−0.009) | 0.072* (0.024) | 0.053 (0.016) | 0.076 (0.007) |
| EXPORTS | 0.118*** (0.029) | −0.011 (−0.004) | 0.106** (0.018) | 0.064** (0.019) | 0.037 (0.010) | 0.208** (0.018) |
| FUNDS | 0.097*** (0.026) | −0.010 (−0.004) | 0.087*** (0.016) | 0.031* (0.010) | 0.072*** (0.021) | 0.191*** (0.018) |
| INDUSTRY | 0.085 (0.023) | −0.058 (−0.023) | 0.027 (0.005) | 0.047 (0.016) | 0.091 (0.027) | 0.167 (0.016) |
| COOP | 0.186*** (0.050) | 0.068*** (0.027) | 0.254*** (0.047) | 0.071*** (0.024) | 0.098*** (0.029) | 0.425*** (0.041) |
| NEWNESS | 0.002*** (0.031) | 0.000 (0.009) | 0.002*** (0.026) | 0.000** (0.012) | 0.001*** (0.018) | 0.004*** (0.023) |
| Constant | 0.673*** | 0.154 | 0.827*** | −0.145 | −0.271* | 0.411 |
| Observations | 47,870 | 47,870 | 47,870 | 47,870 | 47,870 | 47,870 |
| Number of ident | 8,874 | 8,874 | 8,874 | 8,874 | 8,874 | 8,874 |
| R2 within | 0.177 | 0.121 | 0.212 | 0.138 | 0.160 | 0.243 |
| R2 between | 0.369 | 0.205 | 0.387 | 0.315 | 0.352 | 0.447 |
| R2 overall | 0.266 | 0.147 | 0.288 | 0.228 | 0.260 | 0.344 |
| F statistics | 326.13*** | 242.05*** | 406.79*** | 282.93*** | 330.78*** | 499.85*** |
| rho | 0.565 | 0.528 | 0.555 | 0.510 | 0.522 | 0.545 |
Notes:
Robust standard error in parentheses; *p < 0.05; **p < 0.01; ***p < 0.001
Comparing the estimates with those from the baseline model, we can confirm the main results of the baseline model hold with only very minor changes. The direction of the effects of the explanatory variables remains the same across the models (Table 4).
The process dimension of sustainability performance is the construct with the lowest explanatory power (R2 = 0.147). However, absorptive capacity has a greater effect on this specific dimension (β = 0.164) than on external knowledge sources (β = 0.139). The only control variable that has a significant effect on this process dimension is cooperation agreements.
Discussion
Concern about sustainability is not a recent fad; on the contrary, supranational bodies such as the United Nations have made numerous efforts over the past few decades to make society aware of the dangers of continuing increases in pollution and resource exploitation (UN, 2015). In the corporate sphere, sustainability requires both the refinement of existing capabilities and the implementation and development of new ones based on technological and non-technological knowledge (Dzhengiz and Niesten, 2020; Forés, 2019). To do so, organizations need to broaden their knowledge bases and deploy learning processes.
This study demonstrates that the diverse social structure underlying external sources of knowledge provides benefits in terms of both efficiency and diversity, which can enhance sustainability performance, thus lending support to H1 and H2. The variety of knowledge networks in which the firm participates allows it to incrementally increase its knowledge base and improve its management efficiency. The firm's absorptive capacity allows it to harness the diverse knowledge sources in the creation of new knowledge or radical changes to its knowledge base.
When these diverse knowledge sources are closely related to the firm's current knowledge bases and cognitive models, we assume that their impact on sustainability performance is direct. However, certain external knowledge sources, which are novel and radical relative to the firm's previous knowledge stock, must first be absorbed by the firm to have a positive impact on sustainability performance. Absorptive capacity, thus, explains why different firms may be exposed to the same external knowledge but not be able to exploit it to the same extent (Camisón et al., 2018; Claver-Cortés et al., 2016; Camisón and Forés, 2011; Camisón, 2004).
These learning processes aimed at broadening the firm’s cognitive bases, and mental models can take place in a localized manner in a specific environment (Hervás-Oliver et al., 2018; Camisón and Forés, 2011). STPs have been defined as learning centres and cognitive laboratories home to a confluence of scientific, technological and business actors (Ubeda et al., 2019; Arauzo-Carod et al., 2018).
As underlined by the literature on knowledge management and innovation, simply being located in a space rich in knowledge spillovers does not necessarily mean firms there will be able to effectively exploit such knowledge to improve their performance. Our longitudinal analysis allows us to confirm previous findings in the academic literature (Ubeda et al., 2019; Claver-Cortés et al., 2018; Camisón and Forés, 2011) that location alone is not enough to ensure effective identification, assimilation and exploitation of new external knowledge and, consequently, the long-term competitiveness of the firm through the improvement of the triple bottom line.
To benefit from belonging to an STP in terms of sustainability performance, on-park firms must be embedded in the creation and diffusion of diverse knowledge flows. That is, on-park firms should be able to integrate into the social structure of the STP, joining the cognitive community and becoming a network insider so that they can access the external knowledge sources that are gathered there (Porter, 1998b; Granovetter, 1985). Thus, our study confirms the fully mediating role of external knowledge sources in the relationship between belonging to an STP and sustainability performance, as stated in H3.
When STP knowledge spillovers are less directly exploitable (Ubeda et al., 2019; Claver-Cortés et al., 2018; Forés and Camisón, 2016) because of their tacit, complex and novel nature, firms’ absorptive capacity can help ensure that said knowledge still impacts sustainability performance (Song et al., 2018; Cohen and Levinthal, 1990). Therefore, absorptive capacity has a multiplier effect on the impact of external knowledge sources available in an STP on sustainability performance, as posited in H4.
We also introduced several control variables into our empirical model. Starting with size, this variable has a positive and significant effect on sustainability performance in Model 1, in which only control variables are considered. However, when the effects of the explanatory variables external knowledge sources and absorptive capacity are introduced, the impact of size on sustainability performance loses significance, in line with the tenets of the resource-based view (Barney, 1991).
Exporting firms show better sustainability performance given their higher productivity because of exposure to external competitive pressures (Fryges and Wagner, 2010), embeddedness in global value chains (De Loecker, 2007) and need to comply with social and environmental regulations (Camisón, 2010).
The study also confirms that the use of external funding improves the innovation components of sustainability projects (Hall and Lerner, 2010). Cooperation is a source of new ideas that boost firms’ capabilities to create, use and recombine new and existing knowledge (Laursen and Salter, 2006; Chesbrough, 2003). It seems logical, therefore, that it would have a positive impact on sustainability performance. Moreover, given the complexity of balancing economic, social and environmental dimensions, it is the control variable with the greatest impact of all those in our model.
Finally, the newness of products in the market, considered as a proxy for strategic proactivity (Miles et al., 1978), seems to exert pressure on firms not only to offer more technologically innovative products but also to be more sustainable to address environmental issues (Forés, 2019; Aragón-Correa, 1998).
We performed additional analyses to confirm the robustness of the results and control for endogeneity problems with the variables. In addition, we cross-checked our results using alternative measures for sustainability performance. Specifically, we considered each dimension of the sustainability performance construct. The direction of the effects of the explanatory variables remained the same across the models, but the magnitude of the effects changed. Although the impact of external knowledge sources was greater than that of absorptive capacity on all sustainability dimensions, the impact of absorptive capacity is more relevant for the process dimension of economic sustainability performance than the direct exploitation of knowledge sources.
Theoretical implications for academia
Based on the results of this research, we can identify a number of implications for academia. First, this study confirms that knowledge is a key strategic resource that can impact performance through the mechanism of absorptive capacity. Our findings, thus, contribute to the literature on open innovation and knowledge management by showing how localized sources of external knowledge impact firms’ sustainability performance and determine their long-term competitiveness.
Our empirical evidence answers one of the main questions of this research, confirming that the location of firms’ operations does matter, but it does not directly impact firm performance in terms of sales growth, increased employment, increased productivity or better innovative performance; rather, it establishes the conditions for such an influence on performance (Bellandi and De Propris, 2015). A paradox highlighted by Porter (1998b) is that in an increasingly globalized and hyper-connected world, regional factors (especially geographically bounded knowledge) remain a source of long-run competitive advantage that non-colocalized rivals cannot easily imitate. According to our longitudinal study, this also holds when a company's performance is measured in terms of the triple bottom line of sustainability. Therefore, our findings highlight the need to delve further into the impact that location in a territorial agglomeration of organizations (such as an STP) has on the firms therein, especially in the area of sustainability.
Finally, while the literature on corporate sustainability performance has traditionally placed greater emphasis on environmental performance, this research uses a measure of sustainability performance that holistically integrates the three widely recognized dimensions of sustainability: social, economic and environmental (Engert et al., 2016). It, thus, responds to recent calls for further exploration of triple bottom line sustainability measures (Ben Arfi et al., 2018; Engert et al., 2016).
Implications for practitioners
This research also has important practical implications for policymakers, managers of STPs and company managers. As far as policymakers are concerned, especially those responsible for industrial and territorial development policies, our study underlines the importance of STPs as instruments to support business competitiveness and stimulate regional development.
The results of this research also show that STPs, by hosting a variety of scientific, technological and business agents that generate knowledge spillovers through social networks, can provide a space which allows companies to improve their triple bottom line sustainability performance.
The creation of a collective reputation and a shared vision of social and environmental aims for on-park firms has important implications for their competitiveness and economic performance in terms of cost savings, productivity, employee engagement and satisfaction and access to new markets. Ultimately, by enabling firms to improve their sustainability performance, STPs play a critical role in the transition to a more sustainable economy.
We cannot understand the impact of belonging to an STP on a firm’s sustainability without considering the contextual and structural factors that promote access to and development of multiple sources of knowledge. Our findings point to a need for public actions aimed at improving the infrastructure endowments of these spaces, the provision of high value-added services to on-park organizations and the creation of networks of STP organizations to accelerate the sustainable transformation of their productive model. The provision of value-added services can be assigned to park management teams, freeing them from traditional infrastructure maintenance tasks to concentrate on higher-value services.
Finally, regarding company management, this study suggests that even in a highly globalized world connected through new technologies, location remains a strategic decision. Thus, company management should carefully choose a location in areas where there is an abundance of knowledge spillovers about markets, green technologies and the latest management trends to improve sustainability performance. That said, managers should be aware that location alone is not enough for the external knowledge sources available in STPs to impact sustainability performance; they must strive to ensure integration in the social networks, processes and cognitive communities of the STP, whether through formal market mechanisms (e.g. incorporating companies as suppliers) or through informal mechanisms (e.g. participating in social events or training courses). Furthermore, company management should endeavour to create the internal capabilities that enable the acquisition, assimilation, transformation and exploitation of the surrounding knowledge; developing absorptive capacity should, therefore, be a managerial priority.
Limitations and future lines of research
Despite its contributions to the literature, this research has some limitations. The first is that our database only covers Spanish companies. Focusing on the external knowledge sources construct, it is composed of 11 items representing knowledge spillovers produced by market sources, education and research and other sources such as conferences or professional associations. However, future studies can assess whether our empirical results hold up using a knowledge spillovers measure constructed from concrete objective indicators, as well as an objective performance measure for each of the three dimensions of sustainability.
In future research, it would be interesting to explore the different impacts of explorative versus exploitative knowledge (Camisón et al., 2018), by examining the specific influence of each external knowledge source (and its degree of relatedness to the firm’s existing knowledge) on each of the variables that make up our sustainability performance measure.
STPs may also be units embedded in much larger regional innovation systems. In such cases, relevant partners or sources of knowledge may be located outside the vicinity of the park but within the boundaries of the regional innovation system. Therefore, future analysis could be extended to off-park knowledge sources. This proposal is particularly relevant given that STPs can house subsidiaries of large international groups or that innovation projects (not only traditional product or service innovation but also projects incorporating elements of sustainability) are often run by multinational consortia.
This research was funded by “Plan Estatal de Investigación Científica y Técnica y de Innovación 2021-2024” of the Ministerio de Ciencia e Innovación, with the reference PID2020-119642GB-I00. The author José María Fernández Yáñez has been supported by the predoctoral grant PD-UJI/2019/13.
Note
To build the panel data until 2016, we use the mean of the degree of importance of clients, divided into clients from the private sector and clients from the public sector for the year 2016 of the panel data.
References
Further reading
Appendix
Regression results for absorptive capacity instrumented
| ACAP | Coefficient | Standard error | t-value | p-value | [95% Conf | Interval] | Significance |
|---|---|---|---|---|---|---|---|
| SKILLEDR&D | 0.014 | 0 | 127.38 | 0 | 0.014 | 0.014 | *** |
| Constant | 5.536 | 0.007 | 843.01 | 0 | 5.523 | 5.549 | *** |
| Mean-dependent variable | 5.870 | SD-dependent variable | 1.049 |
| Overall R2 | 0.304 | Number of observations | 71571 |
| Chi-square | 16224.583 | Probability > chi-square | 0.000 |
| R2 within | 0.136 | R2 between | 0.426 |
Notes:
***p < 0.01; **p < 0.05; *p < 0.1

