The purpose of the study is to describe the implications of strategic lead times (SLTs) for return on investment (ROI).
This study was part of an interactive research project and is based on the logic of theory application leading to theory building. It uses a multiple case study with five holistic single cases. Empirical data (ED) have mainly been collected from interviews and focus groups.
The length of and uncertainty in SLTs have implications for companies' financial performance. These implications vary in strength and can be either direct or indirect. These findings are incorporated into a framework on SLTs' implications for ROI.
The presented array of SLTs' implications for ROI could be further investigated, focussing on their strength. Additionally, it would be interesting to substantiate the findings in the context of environmental and social sustainability (i.e. the triple bottom line).
The findings offer practitioners a rich description and understanding of SLTs' actual implications for financial performance in terms of ROI. This knowledge can support practitioners in analysing supply chain designs based on financial performance.
Using a combination of a relative financial performance measure (ROI) and a set of SLTs (systems perspective), this study focuses on SLTs' actual implications for ROI. The findings provide evidence that different sections of a supply chain can have different implications for revenue, cost and investment (i.e. the three absolute measures related to ROI).
1. Introduction
Lead time is relatively simple to measure. But a standardised way of estimating the cost of reducing lead time is missing. – Strategic purchaser, TurbineCo
… it is challenging to clearly see the actual payoff from reducing lead times. This means that we [PumpCo], in some situations, do not prioritise short lead times in projects involving procurement. The focus is on traditional measurements. – Inbound/outbound manager, PumpCo
Lead time is an important aspect when it comes to competing for customer orders. It is, however, difficult to assess the value of lead time. In product costing, it is usually the cost of the product that is valuated, not the lead time itself. Also, the reasons for shortening lead times are often met with the argument, “This will increase the price of the product”. So how to value shorter lead times? – Logistics manager, LuminaireCo
The preceding quotes describe some issues raised by manufacturing companies' representatives in a recent research project. As evident from these quotes, the goal of businesses is to generate money and earn profit (Goldratt and Cox, 2016; Leon, 2016). A key part in generating profit rests in the design and control of supply chain operations (Gligor, 2017; Wagner et al., 2012). Hence, supply chain operations managers play a strategic role in contributing to business profitability. Historically, managers have intuitively understood this role and worked to reduce supply chain operations costs. Currently, supply chain operations managers have started to gain a more widespread understanding of this relation, realising that supply chains and shorter lead times can be used to compete and generate profit (Stank et al., 2019). Nonetheless, most supply chain operations managers lack a detailed understanding of lead times' actual implications for financial performance (Stank et al., 2019). Furthermore, performance measures are usually unable to reflect the relation between lead-time performance and financial performance (Godinho and Veloso, 2013), impeding the ability to make informed decisions on when lead-time changes are financially desirable (Gelsomino et al., 2016; Godinho and Veloso, 2013; Ponte et al., 2018).
Previous research has mostly studied lead-time implications for financial performance using a cost perspective, for instance, in terms of changes in direct materials and inventory costs from sourcing materials from low-cost countries (see, e.g. Blackburn, 2012; De Treville et al., 2014; Whicker et al., 2009). Cost is an important measure but still an absolute one, meaning that it does not consider whether a costlier solution may be more profitable if the potential increase in revenue exceeds the costs. Acknowledging this fact, some studies use relative financial performance measures, such as return on investment (ROI), including not only cost but also revenue and investment (see, e.g. Christensen et al., 2007; Droge et al., 2004; Gligor, 2017; Jayaram et al., 1999; Vickery et al., 1995; Wagner et al., 2012). Using quantitative approaches, these studies demonstrate that lead times have implications for financial performance and that these implications can have different magnitudes. However, these studies bypass the question of how such implications manifest themselves in practice. Hence, supply chain operations managers know that lead times have implications for financial performance, but they lack a detailed understanding of the actual implications (Stank et al., 2019).
Some important exceptions exist, in which the qualitative aspects of lead-time implications for financial performance have been addressed (see, e.g. Stalk and Hout, 1990; Towill, 1996; Wouters, 1991). These studies acknowledge that different types of lead times, such as delivery lead time, can have different implications for the three absolute measures that together form ROI: revenue, investment and cost. However, these studies and the current one differ in three ways. First, published studies address lead time from a general perspective, not basing it on a systems perspective, such as the strategic lead times (SLTs) used here. SLTs are important from either a demand or a supply perspective and are based on a system boundary (Wikner, 2014, 2018). Second, published studies focus on reducing and compressing lead times to increase profit. In contrast, the present study acknowledges that it might sometimes be more profitable to prolong lead times, such as when less costly materials can be sourced from low-cost countries (Blackburn, 2012). Third, analysing different sections of a supply system (i.e. a supply chain) separately is also possible using SLTs, in which each section can be prolonged, reduced or kept unchanged for increased profitability, for instance. In accordance with these three aspects and the managerial challenges, the purpose of the current study is to describe SLTs' implications for ROI, with the objective of operationalising these implications. The main research question (RQ) is therefore:
What are SLTs' implications for ROI?
The remainder of this paper is organised as follows. Section 2 elaborates on ROI and its use in lead-time research. The section also presents the theory of decoupling thinking, including SLTs and their main implications for ROI, as summarised in a conceptual model (CM) (presented in Wikner, 2015) substantiated with the additional literature. Section 3 describes the research design, including the procedures used in the case study design, data collection and analysis. Section 4 summarises the findings from each case company, whereas section 5 offers a cross-case analysis. Section 6 discusses and interprets these findings vis-à-vis the extended CM (presented in section 2), answering the main RQ. In section 7, SLTs' implications for ROI are operationalised in a framework. Lastly, section 8 presents the study's conclusions, contributions, limitations and offers opportunities for further research.
2. Theoretical framework
This section starts by clarifying ROI and presenting a synthesis of the studies on the relation between lead time and ROI. Next, the theory of decoupling thinking is addressed, followed by a discussion on six of the SLTs within decoupling thinking and their implications for ROI from a conceptual perspective.
2.1 Return on investment, lead time and their relation
Financial performance measures should support managerial decisions (Gelsomino et al., 2016) and be easy to use (Godinho and Veloso, 2013). A useful model or equation for bridging the gap between operations and finance is the DuPont model. This model is based on the accounting measure of ROI, which measures profitability, is easy to use and is frequently applied (Leon, 2016; Weijiao et al., 2018). ROI has also been used in previous studies on the relation between lead time and financial performance. Using for instance ROI, Vickery et al. (1995) studied the relation between time compressions and financial performance in the furniture industry. Vickery et al. (1995) found that business performance was strongly related to lead-time. Using a similar research design, Jayaram et al. (1999) studied the relation between lead time and overall financial performance (e.g., using ROI) in three car manufacturers in North America. The study provided empirical support for a positive relation between lead-time performance and financial performance.
ROI is thus considered suitable for studying SLTs' implications for financial performance. It is “a relative measure of financial performance that provides a means for comparing various investments by calculating the profits returned during a specific time period” (APICS Dictionary, 2013, p. 151). It helps determine when a financial investment might generate the most profit (Leon, 2016) and provides a useful overall approximation of the success of a company's past investment policy (Drury, 2000). Briefly, ROI can be calculated as net income (revenue minus cost) divided by investment (Leon, 2016). ROI is therefore based on three absolute measures: revenue, cost and investment.
2.2 Decoupling thinking
The theory of decoupling thinking is defined as a management philosophy based on a holistic and integrated approach to flow discontinuities, focussing on creating effective flows using SLTs to position strategic decoupling points (adapted from Wikner, 2018, p. 445). The positioning of strategic decoupling points has a direct relation to the length of the related SLTs and the manufacturing strategy used. For instance, one of the main strategic decoupling points is the customer order decoupling point (CODP; Giesberts and van der Tang, 1992; Wikner, 2018), also known as the order penetration point (Olhager, 2003; Sharman, 1984), which separates decisions about initiating flow based on speculation on future customer orders from the commitment to actual customer orders (Hoekstra and Romme, 1992; Wikner, 2018). The CODP has been used in supply chain operations management studies to differentiate and study manufacturing strategies, such as engineer-to-order, make-to-order, assemble-to-order and make-to-stock (see e.g. Hedenstierna and Ng, 2011; Hoekstra and Romme, 1992; Olhager, 2003; Wikner, 2014). The positioning of the CODP is thus a strategic decision related to manufacturing companies' competitive priorities, such as delivery speed, flexibility and price (Olhager, 2003).
Because of the direct relation of decoupling thinking to competitive priorities and manufacturing strategies, it is expected to be a useful theory to study the relation between lead time and financial performance. Wouters (1991) used the CODP to study the economic consequences of lead-time reduction but addressed lead time rather generally, in line with the APICS Dictionary's (2013, p. 90) definition of lead time as the “span of time required to perform a process”. However, in a supply chain operations management context, identifying the most significant lead times is important, as all available lead-time measures are too numerous. The present study uses a triadic perspective, in line with the study of Wikner (2018), in which the focal actor (i.e. the actor used as the basis for the analysis) is supplied by an upstream supplier actor, and in turn, supplies the downstream customer actor. SLTs reflect this triadic perspective, and because of their strategic emphasis, they can be expected to have significant implications for ROI.
2.3 Strategic lead times and their implications for return on investment
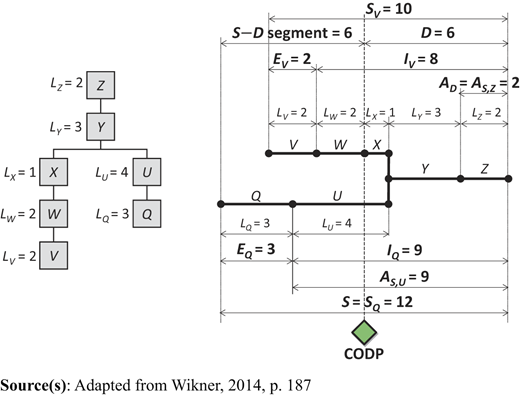
This study considers six types of SLTs, grouped into control-, risk- and variant-based SLTs (Wikner, 2018). From a systems perspective, these SLTs address three important flow aspects–whether the flow is controllable or uncontrollable by an actor, whether activities are conducted on speculation or commitment to customer orders and whether the offering is standardised or customised. As a time perspective is significant, a time-phased bill of materials (BOM) is a useful way to illustrate the implications of these SLTs. The traditional material-based BOM (on the left side of Figure 1) can be transformed into a time-phased BOM (on the right side of Figure 1), in which the horizontal distances between the two filled circles correspond to each item's lead time in the material-based BOM. In Figure 1, for instance, the system lead time (S) is the cumulative lead time of the complete product, that is, the supply system and equals 12 time units. The SLTs are further described and exemplified in Sections 2.3.1–2.3.3 when presenting their main implications for ROI and its three absolute measures according to a conceptual approach. The main implications are also summarised in the three columns labelled “CM” in Table 3. Note that contract and payment terms, among others, have not been elaborated on in this study.
2.3.1 Category 1: control-based SLTs
The controllable part of a system is related to the internal lead time , whereas the part outside the system's control is related to the external lead time . Wikner (2018, p. 444) further classified into the external upstream lead time and the external downstream lead time . However, this study only addresses (hereafter simply referred to as E). Control is defined as the extent to which resources can be considered finite (Wikner, 2018). A controllable lead time denotes the use of resources at the system's discretion. Typically, lead times can gradually change from uncontrollable to controllable (Wikner, 2018), but in this study, they have been simplified as either/or. Because E is based on the lead time beyond the system's control, it is usually associated with purchased materials and hence direct material costs (Wikner, 2015). Conventional wisdom suggests that as the replenishment lead time (here corresponding to E) increases, so do inventory and safety stock (Blackburn, 2012; Er and MacCarthy, 2006). Furthermore, both the length of and uncertainty in E have implications for the investment in raw materials and inventory-carrying costs (Blackburn, 2012; Wikner, 2015).
I is then related to the transformation of direct materials and thus to the capacity associated with direct labour costs. Additionally, I represents the time spent by an item in the system; a high I value could be an indication of the time slack embedded in the system per the 0.05–5% rule. According to this rule, most products receive value only 0.05–5% of the time when they are in the supply system (Stalk and Hout, 1990). This value-adding percentage can be increased by decreasing machine utilisation, resulting in reduced queues and waiting times. I can also be shortened by reducing batch sizes. This can result in an earlier detection of quality issues and a decrease in scrap and expenses for repairing defective products. Consequently, I is also linked to the amount of materials and items in the system, here referred to as work in process (WIP; Gregory and Rawling, 1997; Wouters, 1991).
In summary, and are important from both the cost and the investment perspectives. Note that each branch within the supply system has a separate tuple of E and I, as shown in Figure 1 , which are indicated by subscript k in Tables 2–4, representing a specific branch, that is, branch k.
2.3.2 Category 2: risk-based SLTs
Risk-based SLTs are related to demand-based risks and the extent of speculation required. The delivery lead time (D) can be one or more of the following: (D1) what the company tells its customers, in which they have no involvement in the decision, (D2) the requested lead time from the customer or (D3) the lead time that would give the company a competitive edge in the marketplace (Mather, 1988). For this study, corresponds to customers' requested lead time (i.e. ; hereafter simply referred to as D), whereas is the cumulative lead time of the complete supply system. Note that is based on (for each branch k). From an item perspective, each branch within the supply system has a separate . From a complete supply system perspective (product perspective), as used here, the branch with the longest cumulative lead time reflects the cumulative lead time of the complete supply system (e.g. a supply chain), corresponding to in Figure 1. Therefore, the upstream end of indicates the point at which a company should start taking a material-based risk (Mather, 1988; Towill, 1996). Correspondingly, the upstream end of indicates the positioning of the CODP (Hoekstra and Romme, 1992; Wikner, 2018). This means that if is longer than D, the company should start taking a material-based risk-based on speculation (Hedenstierna and Ng, 2011; Hoekstra and Romme, 1992). The segment (i.e. the time span upstream of but within S, equals 6 time units in Figure 1) is thus based on speculation; in such situations, WIP will most likely accumulate and have an impact on investments. Furthermore, if the segment can be reduced, the forecast window is also reduced. Consequently, the inventory-carrying cost may be lessened through improved accuracy and reduced safety stocks (Forza et al., 2008; Gregory and Rawling, 1997; Mather, 1988). A higher demand uncertainty also relates to a higher variance and then more investment in buffers throughout the system (Christensen et al., 2007).
The activities during (i.e. the flow downstream from the CODP to delivery) are based on commitment to customer orders, which decreases the supplier's risk (Mather, 1988; Wikner, 2015; Wouters, 1991). As mentioned, determines the CODP's position and consequently, the main buffer point related to the CODP (Hedenstierna and Ng, 2011; Hoekstra and Romme, 1992). To reduce D, a company could decrease the load on its resources involved in by increasing available capacity or decreasing capacity requirements, increase buffer levels and/or supply based on speculation. Hence, reducing or prolonging affects the CODP's position and the amount of capital invested in the main buffer (Hoekstra and Romme, 1992; Wouters, 1991). is also a key SLT for generating a competitive advantage and increasing revenue (Hedenstierna and Ng, 2011; Hoekstra and Romme, 1992; Vickery et al., 1995). For example, if the company can gain a competitive edge in the marketplace and offer a superior service by reducing D, then this can also improve its sales volume and/or selling prices (Wouters, 1991), increasing its revenue. The revenue thus depends on the lead time facing the customer (i.e. ) and the company's capability to leverage to provide a competitive offering (Wikner, 2015).
In summary, and are both important from an investment perspective, where is also vital from a cost perspective and significant from a revenue perspective.
2.3.3 Category 3: variant-based SLTs
Variant-based SLTs pertain to certain points in the supply system when demand or supply provides a basis for variants (Wikner, 2015). As the adapt lead time – supply based () corresponds to all lead times downstream from where it is possible to create delivery-unique variants, there could be multiple s within a supply system, as shown in Figure 1 (see and ) and identified by subscript in Tables 2–4.
When comparing s with D, one can identify the subset that can be used for delivery-unique offerings. The farthest upstream but still within is called adapt lead time – demand based (AD). In Figure 1, two s are identified (i.e. and ). However, only is possible for delivery-unique offerings, as it is within ; hence, is selected as . Assuming that is market oriented (i.e. customisations are based on customers' requirements), it shows an obvious potential for increasing revenue (Gregory and Rawling, 1997; Wikner, 2015). If this point of differentiation can be moved downstream, reducing AD, then customers' input for product differentiation features is required at a later point, resulting in increased order flexibility (Er and MacCarthy, 2006; Forza et al., 2008) and possibly higher revenue due to a possible reduction and increase in market share.
However, is related to supply and a product's untapped possibilities for customisation. Thus, the implications of are not as obvious because the customisation has not yet been requested by the market. The potential cost implications are more prominent, as this would result in more item numbers (Wikner, 2015).
In summary, and are both important from a revenue perspective; is also essential from a cost perspective.
3. Research design
This study uses theory application, along with an element of theory-building logic (see, e.g. Eisenhardt, 1989), to describe SLTs' implications for ROI. A CM (presented in Wikner, 2015) has been substantiated with relevant literature and is used as a basis to empirically investigate SLTs' implications for ROI. A multiple case study with five holistic single cases (i.e. five companies) is used (see Yin, 2009) to explore the linkages between SLTs and ROI. The design is based on the suggestions of Voss et al. (2002) for matching the research purpose with the methodology, as well as on Wacker's (1998) recommendations for refuting analytical conceptual work. The results of the analysis are summarised and combined with the CM, using logic reasoning (i.e. analytical conceptual research), resulting in a more elaborate framework.
3.1 Company and respondent selection
This study was part of an interactive research project on the structural analysis of flow in terms of lead time and the financial valuation of lead time. Based on the projects interactive approach, the research purpose was developed and finalised together with the participating companies, and thus, the companies were selected prior to the finalisation of the research project´s design. Furthermore, the research project was a continuation of a former research project in which all the companies participated and where the question “What is the cost of lead time?” was raised. Thus, the company selection for both the larger project as well as the present study is based on a pragmatic grounds approach (Swanborn, 2010), where the companies were already part of the researcher´s network and where the company representatives had professional interests in the research. Nevertheless, the five case companies were still considered suitable following the four inclusion criteria developed from the study´s purpose and RQ. First, the companies are all for-profit manufacturing companies. Second, the companies have some form of customer–order–driven production (i.e. ). Third, the companies produce customised products (i.e. ). Fourth, the companies and their representatives have interest in and basic knowledge of SLTs, increasing the probability of relevant and fruitful discussions and access to high quality empirical data (ED).
The five manufacturing companies are all located in Sweden and fairly large, each with 200–3,000 employees. All their representatives were managers in supply chain operations, with substantial knowledge of their respective organisations' supply chain operations (see Table 1). For the purpose of confidentiality, the companies' products, in combination with “Co” (abbreviation of the company), are used as pseudonyms to identify the companies in this paper. These are PumpCo (hydraulic pumps and motors), TelecomCo (telecommunication equipment), LuminaireCo (luminaires), AircraftCo (aircraft systems) and TurbineCo (gas turbines). The companies differ in the types of products produced, product volume and variety, types of markets, supply chain complexity, number of suppliers and length of and uncertainty in SLTs. However, the companies all struggle with similar challenges in understanding how SLTs have implications for their firms' financial performance.
3.2 Data collection and analysis
As this study was carried out as part of a research project, numerous on-site tours of the manufacturing facilities, document studies, interviews and workshops were conducted. As such, prior to the study initiation, the researchers already had previous knowledge of the case companies' manufacturing facilities, their supply chain designs and contextual information regarding lengths of SLTs. The activities specifically pertaining to this study can be divided into three main parts. This is illustrated in Table 1, presenting a condensed version of the research protocol used in the study.
Part 1 was a workshop whose objective was to improve the company representatives' understanding of SLTs and their implications for ROI. A moderator presented the CM (summarised in the “CM” columns in Table 3), which was followed by interactive discussions among the respondents, similar to a focus group (see Saunders et al., 2012). The workshop was audio recorded, and the researchers listened to the entire recording shortly after the workshop to identify any possible misunderstandings by the participants that needed to be followed up before or during Part 2 of the study.
Combined individual and group interviews were conducted in Part 2 of the study (see Table 1). In line with the procedures proposed by Saunders et al. (2012), an interview protocol was developed for these semi-structured interviews, and probing questions were asked to follow up on interesting leads. As presented in section 1 and section 2.3, lead-time implications for cost have mainly been studied by making changes to the length of lead times. Therefore, to aid the respondents in discussing the question of What are SLTs' implications for ROI? (the RQ) it was decided that the implications should be discussed in relation to changes in the SLTs (i.e. prolonged or reduced). Furthermore, to isolate each SLT's implications for ROI, the SLTs and the three absolute measures related to ROI (revenue, cost and investment) should be addressed individually. Thus, based on the RQ, the respondents were asked “If is prolonged/reduced, what are the implications for revenue/cost/investment?” As such, almost the same question was asked 36 (6*3*2) times per interview, where only the SLT (6), absolute measure (3) and prolonged/reduced (2) were changed until every combination had been discussed. Shortly before the interviews, the interview protocol was sent to the respondents to prepare them for the interview, as recommended by Voss et al. (2002). The interview protocol was structured as a table (resembling Table 2 in section 4), with the six SLTs presented in the rows and the three absolute measures related to ROI presented in the columns. Each SLT row was divided into two sub-rows, one called “prolong” and the other “reduce”. During the interview, the interviewer also took notes within the different columns of the table, ensuring that each of the 36 questions was discussed. The unit of analysis is each company's supply system (i.e. supply chain), which was discussed and illustrated using key products produced by the respective companies. Lasting around one to two hours each, all the interviews were conducted on-site and face to face, except for that with TurbineCo, which was conducted online via a communication tool (see Table 1). After each interview, the notes and audio recordings were imported to NVivo version 11 and grouped by case company before being transcribed, coded and grouped by construct category (i.e. the different SLTs and the three absolute measures). In accordance with the recommendation of Voss et al. (2002), the transcripts were done within 24 h to maximise recall and simplify any need to follow up on gaps in the data. The raw data were first analysed separately for each company and entered into separate condensed tables (i.e. data display). The tables were then sent to the corresponding respondents for feedback and data checking – a process that Carlson (2010) defines as member checking. Section 4 presents a condensed summary of these data displays, where each SLT's implications for the three absolute measures related to ROI are provided for each case separately. These tables were then compared with the data from the other case companies to identify similarities and differences. Section 5 offers a condensed summary of this case comparison. These steps can be considered to constitute within-case and cross-case analyses (see, e.g. Eisenhardt, 1989; Voss et al., 2002).
In Part 3 of the study, the results of the cross-case analysis were discussed in a workshop. Lasting almost two and a half hours, the discussion resembled a focus group. As in Part 1, a moderator presented the empirical results for each SLT, which was followed by interactive discussions among the respondents. Just as in Part 2 of the study, the session was also audio recorded, transcribed and imported into NVivo. The results of the cross-case analysis were further analysed using the transcribed data from Part 3. These results (presented in section 5) were then compared with the CM using a pattern-matching logic, as described by Yin (2009). Section 6 presents a condensed summary of this comparison. The comparison revealed that the CM did not capture some key elements of the dynamics between SLTs and ROI that were perceived by the respondents. These findings were logically combined with the conceptual framework, using analytical conceptual reasoning (see Wacker, 1998), resulting in a more elaborate framework on SLTs' implications for ROI.
3.3 Reliability and validity
The drawbacks associated with a case study approach include misjudging of single events and exaggeration of available data. The use of multiple cases and cross-case comparison somewhat mitigated these issues and enhanced the external validity of this research (Eisenhardt, 1989; Merriam, 2009). The respondents' comments on the transcribed interview data and the case descriptions were sought to minimise researcher bias and misunderstandings.
One drawback of this study is its lack of triangulation and internal validity. However, most of the interviews were conducted in groups, and all the respondents from each company reviewed the data, so this limitation was somewhat mitigated.
Merriam (2009) argued that a qualitative study conducted twice would not produce the same results. Reliability should therefore not measure whether the study can be replicated by others but whether the results can be perceived as sensible by others, given the collected data (Merriam, 2009). To aid the reader in this assessment, and to some degree support a chain of evidence, the case study report (this article) presents the RQ, a condensed version of the research protocol (including a summary of the 36 interview questions), citations on specific data sources (including actual citations and summaries of data, in terms of the within-case analysis, the cross-case analysis and pattern matching).
4. Findings
Table 2 provides a summary of the findings for each case company, organised according to the SLTs described in the theoretical framework. A check mark (✓) indicates that the respondents from the different case companies consider an SLT to have implications for an absolute measure related to ROI.
5. Cross-case analysis
The presentation of the cross-case results is organised based on the SLT categories given in the theoretical framework.
5.1 Category 1: control-based SLTs
The respondents explained that and could be either prolonged or reduced by switching suppliers and the mode of transportation, by changing the time slack and the level of flexibility or by outsourcing activities. As presented in Table 2, all companies perceived that changes to and , in terms of both length and uncertainty, would have strong implications, not only for cost in terms of tied-up capital and capacity requirements but also for investment in these resources, for instance. However, the respondents did not consider and to have direct implications for revenue. This is probably best summarised by R4: “I [i.e. R4] do not see how I or E can have a direct implication for revenue … indirectly you could always find one.” Similarly, R7 and R12 said that if they could reduce costs by either prolonging or reducing and and if the cost reduction would be used to decrease the sales price, then it could have an indirect implication for revenue in terms of increased sales.
5.2 Category 2: risk-based SLTs
As seen in R8's statement in Table 2, can be considered the critical path or the end-to-end lead time of the system. As such, can be either prolonged or reduced in different ways, such as by switching to a global or a local supplier, changing the transportation mode to either a slower, more sustainable alternative or to a faster one, or adding or reducing the time slack (e.g. safety time) in the system. Similarly, can be either prolonged or reduced by using a slower or a faster transportation mode, increasing or reducing the time slack in the system and/or insourcing or outsourcing activities, respectively. Making changes to and will thus have implications for the supply chain design and the level of flexibility, for instance. As such, the respondents considered both and to have strong implications for cost and investment in terms of capacity needs and material accumulation in the system (see Table 2). Furthermore, all the respondents indicated that is a key lead time. This can also be observed in Table 2 when comparing the comments on the other SLTs and the relative number of comments related to . According to the respondents, reducing has obvious and strong implications for a company's ability to generate more customer orders and thus more revenue, especially if is an order winner. Companies can also be motivated to reduce the length of or uncertainty in as a result of changes to any of the other five SLTs. For instance, if can be reduced, decreasing costs and investments, a company may sacrifice these savings for a reduced or more reliable (certain) and a potential revenue increase. According to the respondents (except R3 and R4 from TelecomCo), this increase in revenue can even be twofold, that is, increasing both the market share and the ability to charge a premium price. However, R3 and R4 did not see the possibility of increasing the selling price due to their highly competitive market. Moreover, an attempt at reducing will most likely imply increased costs, unless the product's architecture is significantly changed to allow late software configurations, for example.
5.3 Category 3: variant-based SLTs
The respondents explained that and could be either prolonged or reduced by making changes to the product's architecture or by redesigning the process for producing the product. Another way of offering as is through a prolonged . Based on the definition, the respondents also considered the two variant-based SLTs to have an obvious relation to . Specifically, if for one or more branches of the supply system can be reduced such that it becomes shorter than (i.e. downstream of the CODP) or through a prolonged so that becomes longer than an , it could potentially increase revenue by resulting in a new alternative for delivery-unique offerings (i.e. becoming a potential ). However, this likelihood is based on the assumptions that the potential customisation is or will be desired by the market, and it will not excessively cannibalise other products offered by the same company. The increase in potential customisations may nonetheless lead to an increase in item numbers, product range, potential suppliers and time slack, as adding complexity typically adds queue time. All representatives of the case companies (except R8 from AircraftCo) thus stated that either prolonging or reducing and could have strong implications for all three absolute measures. However (as seen in Table 2), AircraftCo (R8) did not see a correlation between the length of and a potential increase in revenue since customers are typically not interested in where the customisation is achieved (the upstream end of ), as long as it is within . Nonetheless, any uncertainty in could have implications for the uncertainty in and thus indirect implications for revenue.
The subsequent discussion about the length of and can be summed up by the following statement by R8: “About AS, it seems that there are only three cases. Either AS is equal to zero [there is no delivery-unique offering], or AS is somewhere in between zero and D [downstream of CODP] […]. But if AS would be to the left of D, in other words, longer than D, on the wrong side of the CODP, then this will have rather severe implications” Therefore, the length of in relation to determines the implications for all three contingent absolute measures related to ROI.
6. Comparing the empirical data with the conceptual model
The findings presented in sections 4 and 5 provide a comprehensive overview of how SLTs have implications for ROI. The case companies differ in terms of product type, volume and variety, type of market, supply chain complexity, number of suppliers and length of and uncertainty in SLTs. Even so and in line with the arguments by Stank et al. (2019), the case companies all face the same challenge of understanding how SLTs have implications for their financial performance. This study suggests that SLTs are central to customer–order–driven manufacturing companies and that the findings are general for SLTs.
In this section, the empirical findings are compared with the CM described in the theoretical framework (section 2). In several aspects, the findings validate the CM, but the data provide additional insights that allow extending the CM. The comparison is presented in Table 3, where a check mark (✓) indicates that the CM or the ED considers an SLT to have implications for an absolute measure related to ROI. The comparison thereby answers the RQ: What are SLTs' implications for ROI?
Both the respondents and the CM suggest that …
(1) the length of and uncertainty in and have implications for cost and investment but no direct implications for revenue,
(2) has implications for investment but no significant direct implications for revenue,
(3) has strong implications for all three absolute measures,
(4) has implications for revenue and cost and
(5) has implications for revenue (except for R8 from AircraftCo, who does not see a relation between the length of and revenue, as long as is within . Rather, the delivery-unique offering has implications for revenue).
The differences are that only the respondents consider …
(1) to have implications for cost,
(2) to have implications for investment and
(3) to have implications for cost and investment.
The core theme derived from the original CM is that the actual length of SLTs is fundamental, as confirmed by the respondents. This conclusion is not ground-breaking, since the notion that a shorter lead time can be a source of competitive advantage has been well established in the literature (see, e.g. Christensen et al., 2007; De Treville et al., 2014; Gregory and Rawling, 1997; Towill, 1996). However, as indicated by the respondents and Blackburn (2012), prolonging lead times rather than reducing them might sometimes be more financially beneficial, for example, when , and thereby , are prolonged so that less costly materials can be sourced from low-cost countries, or when is prolonged to achieve production levelling by using buffers to isolate variations.
Apart from the length of each SLT, the respondents considered the risks related to the uncertainty associated with SLTs. The uncertainty concerns not only SLTs related to supply but also those related to customer requirements. In a customer-order-driven context, is uncertain per se, but the customers may also change their requirements during . The uncertainty in the forecast may also affect the upstream parts of supply. In total, all parts of the supply system (i.e. all SLTs) may be affected by uncertainty. Length and uncertainty in SLTs are thus two fundamental properties of a time-based entity. However, this study also presents the properties of the actual implication itself. As observed by the respondents, the implication may have different strengths or may even be non-existent. Finally, in several cases, the respondents struggled with the cause–effect relation between SLTs and ROI. The implication was perceived as simple and direct in some cases, but in others, it was formulated as more indirect; for example, an increased certainty in has indirect revenue implications when it results in an increased certainty in . It is thus important to consider if an implication is direct or indirect.
7. A framework on SLTs' implications for ROI
As indicated in the preceding section, the CM does not capture some key elements of the dynamics between SLTs and ROI, as perceived by the respondents. These empirical aspects have been summarised as supplementary properties, that is, the length of and uncertainty in the SLTs and the strength and indirect/direct nature of their implications. Here, these four areas are combined with the CM, resulting in a more elaborate framework. This framework provides a more detailed picture of the relation between the independent and the dependent variables and supports the operationalisation of SLTs' implications for ROI. The framework is illustrated in Table 4, where the rows correspond to the independent variables (SLTs), and the columns correspond to the dependent variables (the three absolute measures related to ROI). Each cell represents the causation between the independent and the dependent variables. A range of causation functions is defined to operationalise the relations. The functions are based on the set Chains, which is assumed to represent all significant causations, direct and indirect, between the independent variables (x) and the dependent variables (y). The causation can range from weak to strong, and the causation with the most significant implication is of main interest. The “max” function is used to identify the causations with the most significant implication, that is, the maximum strength. Furthermore, the extension of the SLTs captures the uncertainty in terms of stochastic properties, represented by the expected value and the SD. For example, if is the independent variable and is the dependent variable, the strongest causation would be represented by
This function represents the causation between the independent and the dependent variables. It is quite detailed, and the point of departure is the set of Chains, which includes all the significant cause–effect relations of x on y, directly or indirectly. For each element (Ch) in the set, the implication for y is evaluated by considering x, where a tilde (∼) indicates the stochastic properties of the independent variable; correspondingly, the dependent variable could be stochastic although this is not assumed here. All causations are evaluated, and the most straightforward approach is to select the chain with the maximum implication as the dominant causation, even though other chains could also be significant. In the framework, this is abbreviated to , a condensed representation in which the subscript indicates that the function is unique to that particular combination of independent and dependent variables. Note that in Table 3, for , and , the causation details in relation to revenue are empty. However, this is not the case in Tables 4; Table 3 only covers direct causations, whereas Table 4 also includes indirect causations. The intersections in the framework represent potential combinations to be investigated, totalling 18 unique intersections.
8. Conclusions and further research
The study makes several noteworthy theoretical contributions. It builds on and goes beyond the notion that lead times have implications for financial performance (see, e.g. Blackburn, 2012; De Treville et al., 2014; Jayaram et al., 1999; Vickery et al., 1995; Whicker et al., 2009), also identifying how these implications manifest themselves in reality.
The study's main theoretical contribution is that not only do the expected length of and uncertainty in SLTs have implications for companies' financial performance, but these implications can also differ in strength and have a direct or an indirect nature. As such, the study supports the findings of Stalk and Hout (1990), Towill (1996) and Wouters (1991), as well as adds a more nuanced understanding. This increases the possibility of questioning the idea that lead times should always be reduced, such as time compression and time-based management (Stalk and Hout, 1990; Towill, 1996). In line with Blackburn's (2012) conclusion, the study demonstrates that increasing lead times can be more profitable in reducing cost or providing customised offerings, for instance.
Finally, using the theory of decoupling thinking, the study contributes to further developing the theory by establishing the relations between decoupling thinking and financial performance. The use of decoupling thinking and SLTs also increases the possibility of examining different parts of a supply chain, such as the or the , and the findings provide evidence that different sections of a supply chain can have different implications for revenue, cost and investment.
The study also contributes to practice by illustrating that how the supply chain is designed and operated has implications for the company's bottom line and shows the intricate and complex relation between SLTs and financial performance. These findings are incorporated into a framework, offering a structured tool for analysing different supply chain design options. The framework, in combination with the empirical examples and the time-phased BOM (see Figure 1 for an example), may aid practitioners in analysing and designing supply chains for profitability. This is supported by the respondents, who all agreed that this way of presenting SLTs and ROI helped them understand the strategic importance of lead time and its implications for their companies' financial performance. R12 said, “The relation between “cost for lead time” and “change in lead time” has been highlighted and exemplified for some of our products, which has led to a correction of the strategic focus where we, in a better way, have managed to justify where we are going and why.”
The study is nevertheless subject to limitations and provides opportunities for further research. The presented array of SLTs' implications for ROI is not exclusive, and the authors welcome further studies where the strength of the implications could be further investigated. During the second focus group, the SLTs' implications for non-financial performance measures, such as environmental sustainability, were briefly discussed. It would be interesting to investigate whether the findings could be substantiated in the context of environmental and social sustainability (i.e. the triple bottom line). Payment terms could also be studied in line with the supply chain financing literature (see, e.g. Gelsomino et al., 2016).
This research is based on the collaborative research project KOPtimera, focussing on the positioning of strategic decoupling points and the relations between strategic lead times and costs. The author acknowledges the financial support for this project, provided by the Swedish Knowledge Foundation under Grant [20130150], Jönköping University and the participating companies. Finally, the authors would also like to thank the anonymous reviewers for their valuable comments and feedback on earlier versions of this article.