1-20 of 5159
Keywords: COUNTY SURVEYOR
Close
Follow your search
Access your saved searches in your account
Would you like to receive an alert when new items match your search?
Journal

Covers the effect of civil engineering on local communities.
Journal Articles
Assessing bus stop accessibility for persons with reduced mobility in Durban, South Africa
Available to Purchase
Proceedings of the Institution of Civil Engineers - Municipal Engineer 1–14.
Published: 04 June 2026

Low-floor bus in operation (Durban People Mover) A People Mover bus with...
Available to Purchase
in Assessing bus stop accessibility for persons with reduced mobility in Durban, South Africa
> Proceedings of the Institution of Civil Engineers - Municipal Engineer
Published: 04 June 2026
Figure 1. Low-floor bus in operation (Durban People Mover) A People Mover bus with 10537 displayed is parked beside a paved walkway surrounded by trees and buildings in an outdoor urban setting. More about this image found in Low-floor bus in operation (Durban People Mover) A People Mover bus with...
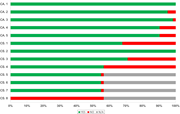
Results for critical requirements at bus stops A horizontal bar chart co...
Available to Purchase
in Assessing bus stop accessibility for persons with reduced mobility in Durban, South Africa
> Proceedings of the Institution of Civil Engineers - Municipal Engineer
Published: 04 June 2026
Figure 2. Results for critical requirements at bus stops A horizontal bar chart compares yes, no, and not applicable responses across categories labelled C A and C S. The horizontal stacked bar chart displays response distributions across categories labelled C A 1 to C A 5 and C S 1 to C S 8. ... More about this image found in Results for critical requirements at bus stops A horizontal bar chart co...
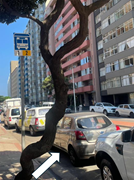
Boarding zone obstruction by parked vehicles A curved tree trunk stands ...
Available to Purchase
in Assessing bus stop accessibility for persons with reduced mobility in Durban, South Africa
> Proceedings of the Institution of Civil Engineers - Municipal Engineer
Published: 04 June 2026
Figure 3. Boarding zone obstruction by parked vehicles A curved tree trunk stands beside parked vehicles and high-rise buildings along a city street with a bus stop sign 1 and 2. More about this image found in Boarding zone obstruction by parked vehicles A curved tree trunk stands ...
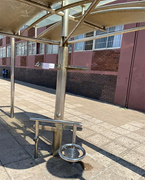
Absence of required perch or leaning supports A metal bus shelter includ...
Available to Purchase
in Assessing bus stop accessibility for persons with reduced mobility in Durban, South Africa
> Proceedings of the Institution of Civil Engineers - Municipal Engineer
Published: 04 June 2026
Figure 4. Absence of required perch or leaning supports A metal bus shelter includes accessible seating and support rails positioned along a paved pedestrian walkway. More about this image found in Absence of required perch or leaning supports A metal bus shelter includ...
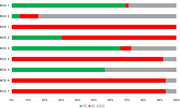
Results for non-critical requirements at bus stops A stacked horizontal ...
Available to Purchase
in Assessing bus stop accessibility for persons with reduced mobility in Durban, South Africa
> Proceedings of the Institution of Civil Engineers - Municipal Engineer
Published: 04 June 2026
Figure 5. Results for non-critical requirements at bus stops A stacked horizontal bar chart compares Yes, No, and N slash A responses across N C A and N C S categories. The stacked horizontal bar chart compares response distributions across 7 categories labelled N C A 1, N C A 2, N C S 1, N C ... More about this image found in Results for non-critical requirements at bus stops A stacked horizontal ...
Non-compliant tree pit creating a tripping hazard A damaged pavement bes...
Available to Purchase
in Assessing bus stop accessibility for persons with reduced mobility in Durban, South Africa
> Proceedings of the Institution of Civil Engineers - Municipal Engineer
Published: 04 June 2026
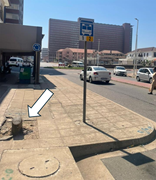
Figure 6. Non-compliant tree pit creating a tripping hazard A damaged pavement beside a bus stop sign includes a broken concrete section highlighted with an arrow. More about this image found in Non-compliant tree pit creating a tripping hazard A damaged pavement bes...
Absence of tactile ground surface indicators A bus stop shelter and road...
Available to Purchase
in Assessing bus stop accessibility for persons with reduced mobility in Durban, South Africa
> Proceedings of the Institution of Civil Engineers - Municipal Engineer
Published: 04 June 2026
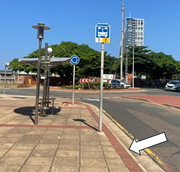
Figure 7. Absence of tactile ground surface indicators A bus stop shelter and roadside sign stand beside a curved roadway near a roundabout and trees with an arrow pointing to the pavement. More about this image found in Absence of tactile ground surface indicators A bus stop shelter and road...
Different bus stop signpost models within the network Two roadside trans...
Available to Purchase
in Assessing bus stop accessibility for persons with reduced mobility in Durban, South Africa
> Proceedings of the Institution of Civil Engineers - Municipal Engineer
Published: 04 June 2026
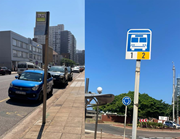
Figure 8. Different bus stop signpost models within the network Two roadside transit signs stand along urban pavements beside parked vehicles and city streets. The split-panel image shows two roadside transit signs installed along urban pavements. The left panel displays a tall signpost with a... More about this image found in Different bus stop signpost models within the network Two roadside trans...

A public bus transport accessibility assessment form records bus stop ident...
Available to Purchase
in Assessing bus stop accessibility for persons with reduced mobility in Durban, South Africa
> Proceedings of the Institution of Civil Engineers - Municipal Engineer
Published: 04 June 2026
A public bus transport accessibility assessment form records bus stop identification, photograph, critical checks, non-critical checks, and remarks. The form title is Accessibility Assessment Form for Public Bus Transport. The first section is Bus Stop Identification. It includes fields for bus rou... More about this image found in A public bus transport accessibility assessment form records bus stop ident...
Journal Articles
Effect of spatial location and land-use attributes on trip generation: Jaipur case study
Available to Purchase
Proceedings of the Institution of Civil Engineers - Municipal Engineer 1–8.
Published: 26 May 2026
Details of sample collection Flowchart showing sampling methods for 3000...
Available to Purchase
in Effect of spatial location and land-use attributes on trip generation: Jaipur case study
> Proceedings of the Institution of Civil Engineers - Municipal Engineer
Published: 26 May 2026
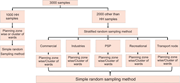
Figure 1. Details of sample collection Flowchart showing sampling methods for 3000 samples divided into household and non-household groups across planning zones and ward clusters. The flowchart shows a sampling framework for 3000 samples divided into 1000 H H samples and 2000 other than H H sa... More about this image found in Details of sample collection Flowchart showing sampling methods for 3000...
Delineation of zones in the study area Map of Jaipur showing Core, Middl...
Available to Purchase
in Effect of spatial location and land-use attributes on trip generation: Jaipur case study
> Proceedings of the Institution of Civil Engineers - Municipal Engineer
Published: 26 May 2026
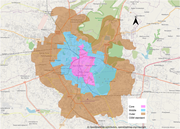
Figure 2. Delineation of zones in the study area Map of Jaipur showing Core, Middle, and Outer zones with labelled regions, roads, and a north direction indicator. The map displays Jaipur divided into three spatial zones labelled Core, Middle, and Outer over an O S M base layer. The Core zone ... More about this image found in Delineation of zones in the study area Map of Jaipur showing Core, Middl...
Journal Articles
UML-based four-dimensional cadastral design: the case of Gölhisar-Burdur, Türkiye
Available to Purchase
Proceedings of the Institution of Civil Engineers - Municipal Engineer 1–21.
Published: 25 May 2026
Four-dimensional cadastral scheme A diagram shows parcel subdivision ove...
Available to Purchase
in UML-based four-dimensional cadastral design: the case of Gölhisar-Burdur, Türkiye
> Proceedings of the Institution of Civil Engineers - Municipal Engineer
Published: 25 May 2026
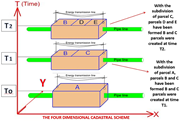
Figure 1. Four-dimensional cadastral scheme A diagram shows parcel subdivision over time from T 0 to T 2 with energy transmission line and pipeline crossing parcels A, B, C, D and E. The diagram presents a four dimensional cadastral scheme with time increasing from T 0 to T 2. At T 0 parcel A ... More about this image found in Four-dimensional cadastral scheme A diagram shows parcel subdivision ove...
The flowchart of the four-dimensional cadastral study Flowchart illustra...
Available to Purchase
in UML-based four-dimensional cadastral design: the case of Gölhisar-Burdur, Türkiye
> Proceedings of the Institution of Civil Engineers - Municipal Engineer
Published: 25 May 2026
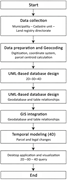
Figure 2. The flowchart of the four-dimensional cadastral study Flowchart illustrating steps for data management, including data collection, preparation, UML design, GIS integration, temporal modeling, and application visualisation. The vertical flowchart begins with start, followed by data co... More about this image found in The flowchart of the four-dimensional cadastral study Flowchart illustra...
Workflow of the proposed four-dimensional cadastral methodology A vertic...
Available to Purchase
in UML-based four-dimensional cadastral design: the case of Gölhisar-Burdur, Türkiye
> Proceedings of the Institution of Civil Engineers - Municipal Engineer
Published: 25 May 2026
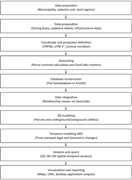
Figure 3. Workflow of the proposed four-dimensional cadastral methodology A vertical workflow shows data acquisition to visualization for 3 D and 4 D cadastral modeling and analysis. The vertical workflow presents sequential steps starting with data acquisition from municipality, cadastre unit... More about this image found in Workflow of the proposed four-dimensional cadastral methodology A vertic...
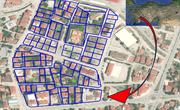
Illustrates the location of the work area A cadastral map shows numbered...
Available to Purchase
in UML-based four-dimensional cadastral design: the case of Gölhisar-Burdur, Türkiye
> Proceedings of the Institution of Civil Engineers - Municipal Engineer
Published: 25 May 2026
Figure 4. Illustrates the location of the work area A cadastral map shows numbered parcels within block 128 over an aerial view with a regional location inset. More about this image found in Illustrates the location of the work area A cadastral map shows numbered...
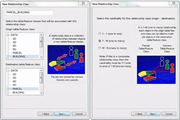
Creating a new relationship class Two panels show a new relationship cla...
Available to Purchase
in UML-based four-dimensional cadastral design: the case of Gölhisar-Burdur, Türkiye
> Proceedings of the Institution of Civil Engineers - Municipal Engineer
Published: 25 May 2026
Figure 5. Creating a new relationship class Two panels show a new relationship class setup linking parcel and building with 1 to many cardinality selection. The left panel shows the relationship name parcel building and lists origin and destination table feature classes under data including 2 ... More about this image found in Creating a new relationship class Two panels show a new relationship cla...
