
1-20 of 1011
Follow your search
Access your saved searches in your account
Would you like to receive an alert when new items match your search?
Journal

Examines public procurement from the perspectives of management law economics and politics and at a local regional national and international level.
Journal Articles
Journal:
Journal of Public Procurement
Journal of Public Procurement 1–25.
Published: 23 September 2026
in Public procurement, social justice and constitutional values in India: a bibliometric and legal analysis
> Journal of Public Procurement
Published: 23 September 2026
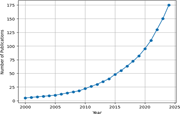
Figure 1. Annual publication trends Source(s): Authors’ own work A line graph shows publications increasing from 5 in 2000 to 175 in 2024, with growth accelerating after 2015. The horizontal axis shows years from 2000 to 2024. The vertical axis shows the number of publications. Values rise ... More about this image found in Annual publication trends Source(s): Authors’ own work A line graph s...
in Public procurement, social justice and constitutional values in India: a bibliometric and legal analysis
> Journal of Public Procurement
Published: 23 September 2026
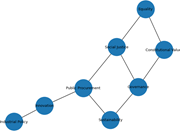
Figure 2. Keyword co-occurrence network Source(s): Authors’ own work A network links Equality, Constitutional Values, Governance, Sustainability, Public Procurement, Innovation, Industrial Policy and Social Justice. The network contains eight connected concepts. Equality connects to Social ... More about this image found in Keyword co-occurrence network Source(s): Authors’ own work A network ...
Journal Articles
Journal:
Journal of Public Procurement
Journal of Public Procurement 1–29.
Published: 17 September 2026
in How predictable are public procurement awards? Network evidence from EU above-threshold contracts
> Journal of Public Procurement
Published: 17 September 2026
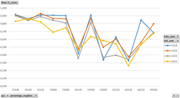
Figure 1. Mean F1 Score evolution by CPV category – average across 10%, 50% and 100% negative samples Note(s): F1 combines precision and recall into a single metric ranging from 0 to 1, with higher values indicating stronger predictive performance. High F1 values indicate that the model ident... More about this image found in Mean F1 Score evolution by CPV category – average across 10%, 50% and 100...
in How predictable are public procurement awards? Network evidence from EU above-threshold contracts
> Journal of Public Procurement
Published: 17 September 2026
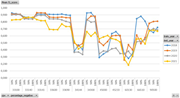
Figure A1. F1 Score evolution by CPV category under different negative sampling ratios Mean f 1 scores vary by percentage negative across 12 C P V sectors for test years 2018 to 2021. The line chart plots mean f 1 score from 0 to 1 for percentage negative levels of 10 per cent, 50 per cent a... More about this image found in F1 Score evolution by CPV category under different negative sampling rati...
in How predictable are public procurement awards? Network evidence from EU above-threshold contracts
> Journal of Public Procurement
Published: 17 September 2026
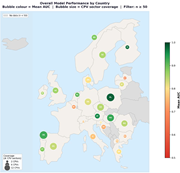
Figure A2. Mean AUC by country, averaged across CPV categories and years (100% negatives). Bubble color: mean AUC (darker = higher). Bubble size: number of CPV categories with sufficient observations (n ≥ 50). Grey = below threshold or missing country codes. Geographic specification includes authority-level HHI A European map presents mean A U C and C P V sector coverage by country for observations of n greater than or equal to 50. The map presents overall model performance by European country, with bubble size representing coverage from 2 to 12 C P V sectors and the scale representing mean A U C from 0.5 to 1.0. Countries with bubbles include Norway, Sweden, Finland, Denmark, Ireland, United Kingdom, Netherlands, Belgium, Germany, Poland, Czech Republic, Austria, Hungary, Romania, Slovenia, Croatia, Italy, Bulgaria, North Macedonia, Greece, France, Spain, Portugal, Latvia and Lithuania. Poland, Austria, Hungary, Finland, France and the Netherlands are among countries near the higher end of the mean A U C scale, while Latvia, Belgium and Croatia are nearer the lower end. Areas without sufficient observations are marked as no data, n less than 50. More about this image found in Mean AUC by country, averaged across CPV categories and years (100% neg...
in How predictable are public procurement awards? Network evidence from EU above-threshold contracts
> Journal of Public Procurement
Published: 17 September 2026
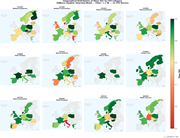
Figure A3. Country-level AUC by CPV domain (100% negative ratio), averaged across temporal periods. Each panel corresponds to one of the twelve CPV categories (see Table 1 ). Color intensity reflects mean AUC (darker = higher). Countries shown in grey had no fold meeting the minimum observation threshold (n ≥ 50) for the respective category; the number of eligible countries per sector is reported in the lower right corner of each panel. The geographic specification in addition includes authority-level HHI as a fourth input feature Twelve European maps compare geographical mean A U C distributions across C P V categories using observations of n greater than or equal to 50. The 12 maps present mean A U C by country for C P V categories 33100 Medical Equipment, 33140 Medical Consumables, 33141 Medical Disposables, 33600 Pharmaceuticals, 33690 Other Pharma, 34144 Special Vehicles, 34300 Vehicle Parts, 45000 Construction, 45233 Road Construction, 60130 Road Transport, 66510 Insurance and 90500 Waste Services. The mean A U C scale ranges from 0.5 to 1.0. Each map uses the same European base and displays only countries meeting the filter n greater than or equal to 50. Countries without qualifying data remain unfilled. The number of countries differs by category, with visible counts including n 15 for Medical Equipment, n 20 for Medical Consumables, n 14 for Medical Disposables, n 10 for Pharmaceuticals, n 7 for Other Pharma, n 14 for Special Vehicles, n 3 for Vehicle Parts, n 10 for Construction, n 4 for Road Construction, n 7 for Road Transport, n 16 for Insurance and n 9 for Waste Services. More about this image found in Country-level AUC by CPV domain (100% negative ratio), averaged across ...
in How predictable are public procurement awards? Network evidence from EU above-threshold contracts
> Journal of Public Procurement
Published: 17 September 2026
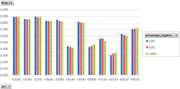
Figure A4. Mean F1 score by CPV category across negative sampling ratios A grouped bar chart compares mean F 1 scores across 12 C P V categories for 10 per cent, 50 per cent and 100 per cent negative data. The grouped bar chart plots mean F 1 from 0 to 1 across C P V categories 33100, 33140,... More about this image found in Mean F1 score by CPV category across negative sampling ratios A groupe...
in How predictable are public procurement awards? Network evidence from EU above-threshold contracts
> Journal of Public Procurement
Published: 17 September 2026
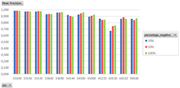
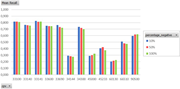
Figure A5. Precision by CPV category across negative sampling ratios A grouped bar chart compares mean precision across 12 C P V categories for 10 per cent, 50 per cent and 100 per cent negative data. The grouped bar chart plots mean precision from 0 to 1 across the 12 C P V categories. For ... More about this image found in Precision by CPV category across negative sampling ratios A grouped ba...
in How predictable are public procurement awards? Network evidence from EU above-threshold contracts
> Journal of Public Procurement
Published: 17 September 2026
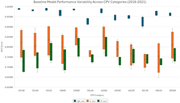
Figure A6. Recall by CPV category across negative sampling ratios A grouped bar chart compares mean recall across 12 C P V categories for 10 per cent, 50 per cent and 100 per cent negative data. The grouped bar chart plots mean recall from 0 to 1 across the 12 C P V categories. For 10 per ce... More about this image found in Recall by CPV category across negative sampling ratios A grouped bar c...
in How predictable are public procurement awards? Network evidence from EU above-threshold contracts
> Journal of Public Procurement
Published: 17 September 2026
Figure A7. AUC distributions by CPV category across model specifications (XGBoost vs baselines), 2018–2021 A box plot compares baseline A U C variability for X G B, L R and H F models across 12 C P V categories from 2018 to 2021. The box plot presents A U C scores from about 0.60 to 1.00 a... More about this image found in AUC distributions by CPV category across model specifications (XGBoost v...
Journal Articles
Journal:
Journal of Public Procurement
Journal of Public Procurement 1–18.
Published: 08 September 2026
in Centralisation without digitalisation? The missing configuration in Cross-Country procurement architectures
> Journal of Public Procurement
Published: 08 September 2026
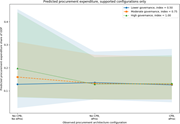
Figure 1. Predicted procurement expenditure by recorded procurement architecture configuration and governance level Note(s): The figure reports predicted procurement expenditure as a share of GDP from the fractional-logit model. The governance labels are shown in raw-index units and correspon... More about this image found in Predicted procurement expenditure by recorded procurement architecture conf...
Journal Articles
Journal:
Journal of Public Procurement
Journal of Public Procurement 1–24.
Published: 27 August 2026
in The practical landscape and optimal incentives of government purchasing public sports services from the perspective of incomplete contracts – an empirical analysis
> Journal of Public Procurement
Published: 27 August 2026
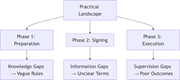
Figure 1. Government procurement of public sports services: the practical landscape Source: Authors’ own work A flowchart links a practical landscape to three phases, each leading to a specific gap and outcome. The flowchart begins with a box titled Practical Landscape. Three arrows extend ... More about this image found in Government procurement of public sports services: the practical landscape ...
in The practical landscape and optimal incentives of government purchasing public sports services from the perspective of incomplete contracts – an empirical analysis
> Journal of Public Procurement
Published: 27 August 2026
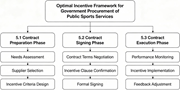
Figure 2. Optimal incentives of government purchasing public sports services Source: Authors’ own work A Flowchart presents an optimal incentive framework for government procurement across contract preparation, signing, and execution phases. The flowchart begins with a rounded box titled Op... More about this image found in Optimal incentives of government purchasing public sports services Source...
in Competence development as a driver of innovative and sustainable public procurement
> Journal of Public Procurement
Published: 24 August 2026
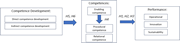
Figure 1. Illustration of the research framework Source: Authors’ own work A conceptual diagram links competence development to enabling, procedural and relational competences, then to three performance areas. The conceptual diagram contains three connected sections. Competence Development ... More about this image found in Illustration of the research framework Source: Authors’ own work A co...
in Competence development as a driver of innovative and sustainable public procurement
> Journal of Public Procurement
Published: 24 August 2026
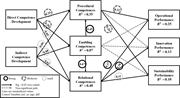
Figure 2. The results of the study Source: Authors’ own work A path diagram links competence development, three competence types and operational, innovation and sustainability performance. The path diagram links direct and indirect competence development to procedural, enabling and relation... More about this image found in The results of the study Source: Authors’ own work A path diagram lin...

