
The kinematic behaviour of drag embedment anchors has become a recent research focus due to the increase in offshore renewable energy devices. This is due to their potential use as an anchoring system for future floating wind applications, in addition to the need to understand their penetration behaviour as a part of the Cable Burial Risk Assessment. Studies on the behaviour of anchors typically consist of field scale or model centrifuge tests, where such facilities are not readily available to all and can result in significant cost. In addition to this, measuring the load–penetration behaviour of an anchor has proven to be a significant challenge, as any contact-based methods are likely to influence the penetration behaviour of the anchor. In this paper, a novel wireless method of recording the inclination of the anchor and calculating the penetration depth is presented. A comparison of the penetration behaviour of a Class F (AC-14) anchor has been made in sand using centrifuge and 1g model scale testing. The results indicate that the 1g testing can match the behaviour of the anchor testing in the centrifuge in terms of both the position of the anchor and its orientation during the dragging event.
Notation
- Ax
acceleration in x direction
- Ay
acceleration in y direction
- Az
acceleration in z direction
- ak−1
acceleration vector
- Dr
relative
- D10
effective particle diameter
- D50
average particle diameter
- H
penetration depth
- N
scaling factor
- R
measurement noise covariance matrix
- Sx
standard deviation of the position
standard deviation of the velocity
- vk
velocity vector
- Xk
current state of the anchor
- xk
current position in x direction
acceleration in the x direction
velocity in x direction
- yk
current position in y direction
- zk
measurement model
- β
anchor opening angle
- δ′crit
sand-steel interface friction angle
- Δt
timestep
- θ
angle in a given direction
- θa
angle reported from accelerometer
- μa
gyroscope data
- ρmax
maximum dry density
- ρmin
minimum dry density
- φ′crit
critical state friction angle
- φ′pk
peak friction angle
- ψ
dilation angle
1. Introduction
Drag embedment anchors (DEAs) are starting to attract a new more recent research focus due to offshore renewable energy applications. This may be as a potential anchoring system for future floating wind applications (Cerfontaine et al., 2023; Davidson et al., 2023) or due to a need to understand their behaviour as a part of a Cable Burial Risk Assessment (CBRA) framework (Carbon Trust, 2015; Sharif et al., 2023). To be able to inform such investigations, it is necessary to understand not only the load–displacement of the anchor but also how it transitions from the seabed surface to a final steady state if pulled to its ultimate holding capacity (UHC). This includes how the anchor fluke pitches (Figure 1(b)) and how the depth evolves to the anchor’s final position and orientation. CBRA methodologies often attempt to predict the anchors final penetration depth based upon a simplistic soil-dependent seabed factor multiplied by the fluke length and the angle of the opening of the fluke relative to the shank (Equation 1) (Carbon Trust, 2015).
where H is the penetration depth of the anchor, SF is the seabed factor (1 for ‘hard soils’ and 4 for ‘soft soils’), F is the fluke length of the anchor and β is the opening angle of the anchor. The assumption of Equation 1 is that the shank is horizontal (Figure 1) to the seabed and that the opening angle of the anchor is the maximum possible for that anchor type. From a previous centrifuge study by Sharif et al. (2023), it was found that both assumptions may not always be correct as the values change with soil density and there is a lack of available data regarding the actual opening angle in reality due to the difficulty in measuring this property once the anchor has been deployed.
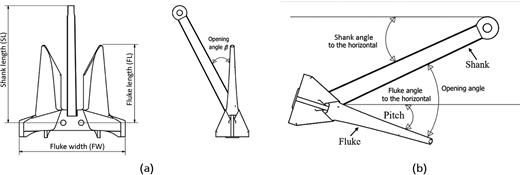
(a) Schematic diagram of a common AC-14 anchor used within this study (dimensions can be seen in Table 2), (b) definition of anchor orientation
(a) Schematic diagram of a common AC-14 anchor used within this study (dimensions can be seen in Table 2), (b) definition of anchor orientation
Information on the behaviour of DEAs is difficult to obtain during the pull event itself in 1g or centrifuge physical modelling experiments, as the anchor is likely to penetrate to some depth below the soil surface, making observations of the continuous location and orientation of the anchor during the anchor pull difficult. In previous studies, the anchor depth has been monitored by placing thin shafts on the fluke, which protrude above the soil surface. The length and angle of the shafts were then monitored and used to determine the penetration depth of the anchor (Neubecker and Randolph, 1996). However, the effect of the attached shaft could result in the kinematic behaviour of the anchor changing, thus providing a penetration depth or orientation that may not be accurate for the geometry of the anchor. Other methods that have been employed are excavation of the soil around the anchor at its final location (Moore et al., 2021) and stopping the anchor drag at regular intervals to probe the soil in an attempt to locate the anchor and its penetration depth. Excavation of the anchor at the end of the drag distance, by first saturating the soil and then draining the water as was conducted by Moore et al. (2021), gives an accurate indication of the orientation and depth of the anchor but does not provide any information on the transitional behaviour of the anchor. Probing the soil during the dragging may give an indication of depth, but true positioning information is difficult to obtain as it is not always clear what part of the anchor you are in contact with and does not allow detailed information on fluke opening angles to be obtained.
Other attempts include the use of on-board three-axis micro-electromechanical (MEMs) accelerometers as used by Robinson et al. (2019) to track the progress of offshore pipeline and cable ploughs, but these require wired connections that can be dragged behind the anchor or transferred up the shank and towline (Davidson et al., 2023). Similar to the protruding shaft, the addition of a trailing wire has the potential to affect the kinematics of the anchor or even damage the wiring or the MEMs chip to wire connection during testing.
In addition to the challenge of instrumentation, tracking and data transfer, anchors are often complicated bespoke shapes that vary from manufacturer to manufacturer and do not lend themselves to accurate reproduction at small scale for physical modelling. It is also the case that not all researchers are fortunate enough to have access to a geotechnical centrifuge facility and it is thus useful to determine which modelling activities are sensitive to stress-based scaling when testing small models during large strain drag events. For instance, Bransby et al. (2005) and Robinson et al. (2019) showed that with proper consideration, large deformation events such as pipeline ploughing could be adequately represented by 1g testing without changing the size of the model plough.
This paper describes a comparison of both 1g and centrifuge testing of a common DEA type fabricated using three-dimensional (3D) metal printing in dry sand (assuming fully drained conditions). To allow comparison of kinematics of the model anchors during installation, a miniature wireless tracking system with real-time monitoring was developed and is also described herein.
2. Methodology
The following section outlines the methodology and equipment used to model the scaled centrifuge and 1g experiments used within this study. The equipment used for the 1g and centrifuge tests was identical, with the only difference being the application of an enhanced gravitational acceleration in the centrifuge experiments.
2.1 Sand used and preparation
The sand beds used to test the anchor penetration were dry pluviated into the large deformation strong box to a depth of 400 mm. Sand beds were created at four homogenous relative densities to assess how density affects the penetration of the AC-14 anchor as part of a wider CBRA study. For each of the chosen relative densities, a 1g and a centrifuge box were prepared so that a comparison of the kinematic behaviour at each relative density could be made. The relative densities (Dr) chosen were 25%, 38%, 55% and 82% to represent sand bed in the loose, medium and very dense categories. The sand used in the experiments was HST95 sand, which is a fine-grained quartz laboratory sand commonly used in the geotechnical laboratories of the University of Dundee (Table 1).
HST95 sand material properties (Al-Defae et al., 2013; Lauder et al., 2013)
| Property | Value |
|---|---|
| Effective particle size, D10: mm | 0.09 |
| Average particle size, D50: mm | 0.14 |
| Peak friction angle, ϕ′pk, at 57% relative density: ° | 40 |
| Peak friction angle, ϕ′pk, at 84% relative density: ° | 45 |
| Critical state friction angle, ϕ′crit: ° | 32 |
| Sand–steel interface friction angle, δ′crit: ° | 24 |
| Angle of dilation*, ψ: ° | 16 |
| Maximum dry density, ρmax: kN/m3 | 17.58 |
| Minimum dry density, ρmin: kN/m3 | 14.59 |
Peak friction angle determined at effective stresses relevant to model testing (0.2–0.3 kN/m2)
Soil beds were created with air pluviation from an automated hopper fixed at a constant height. The pluviator was a slot-type pluviator that extended past the edge of the strong box with the relative density controlled through changing the width of the slot at the lower edge. The same system was used for both the centrifuge and 1g sand beds.
2.2 Centrifuge modelling
To replicate the prototype stress conditions, geotechnical centrifuge testing of a 1/24th scaled model of an 8.5 tonne AC-14 anchor was conducted in dry sand at 16.4g. An AC-14 anchor was chosen for this study, due to Luger (2023) suggesting that it is the most widely deployed anchor in the shipping industry, in addition to having previously been investigated through physical model scale (Moore et al., 2021), numerical modelling (Grabe et al., 2015) and field scale (Luger and Harkes, 2013) experiments. The g level the test was conducted at was lower than the scaling factor in order to recreate the effective stress of a fully saturated soil bed without the need for pore fluid or waterproofing of the instrumentation located within the model anchor. An additional benefit to utilising dry sand beds for testing is the ease of formation of sand bed by way of air pluviation and the potential for quick test turn around, as the sand does not require drying between experiments. This reduced g level approach in dry sand to mimic drained saturated conditions was proposed by Li et al. (2010) and validated by Klinkvort and Hededal (2013). This method utilises the ratio of the dry unit weight and the buoyant unit weight of the soil and uses a lower g level with dry sand to produce the same stress profile as that of a saturated soil bed spun at the g level the scaling factor is determined at. Therefore, a dry sand bed at 16.4g would represent a drained test in a saturated soil bed spun at 24g. Although this may not be fully indicative of field deployment of anchors, it would represent the worst-case scenario for an anchor penetration, as was shown by Grabe et al. (2015), who showed reductions in anchor penetration when the anchor is pulled under undrained conditions in sands of varying relative density, ranging from loose to dense. Further work is planned by the authors to characterise the anchor behaviour under saturated partially drained and undrained conditions, as this requires further development of the internal anchor instrumentation.
The model anchor was 3D metal printed from 316L stainless steel (Figure 2) ensuring that the mass and the centre of gravity of the anchor were scaled accurately, such that the behaviour of the anchor replicated that of the real anchor. Considerations in the design of the anchor were made to account for the mass of the instrumentation and batteries required to power them. The model and prototype scale dimensions of the anchor can be seen in Table 2.
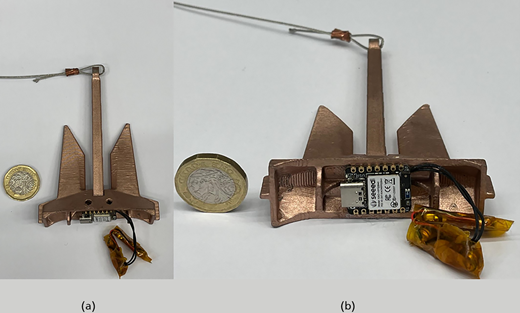
Image of 3D printed metal AC-14 anchor: (a) image of anchor as its placed on the soil surface, (b) image of anchor and wireless instrumentation (GB pound coin shown for scale)
Image of 3D printed metal AC-14 anchor: (a) image of anchor as its placed on the soil surface, (b) image of anchor and wireless instrumentation (GB pound coin shown for scale)
Properties of the model and prototype AC14 anchor geometry
| Property | Model scale | Prototype scale |
|---|---|---|
| Shank length: mm | 137.8 | 3308.0 |
| Fluke length: mm | 71.46 | 1715.0 |
| Fluke width: mm | 90.25 | 2166.0 |
| Mass: kg | 0.07 | 8700 |
The enhanced g experiments were conducted in the University of Dundee’s 3.0 m radius beam centrifuge in a large horizontal deformation strong box. The strong box had internal dimensions of 1400 mm × 400 mm × 650 mm using a dedicated large displacement actuator, developed to investigate the performance of ploughs and anchors (Davidson et al., 2023; Robinson et al., 2017, 2019). The tow force was measured using a 5 kN S-type load cell (Tedea Huntleigh type 616) positioned at the surface of the sand bed, which was attached to the towing arm mounted to a moving platform. The moving platform was attached to the motor by two timing belts looped around pulleys positioned at the ends of the actuator. The pulleys were in turn connected to an axle driven by a secondary belt attached to a Paralux SD12-LWS high torque 220 V DC motor (capacity of 63 Nm at 13 rev/min). The displacement of the platform was measured by a draw wire transducer (DWT) (Multi-comp SP1-50) (Figure 3).
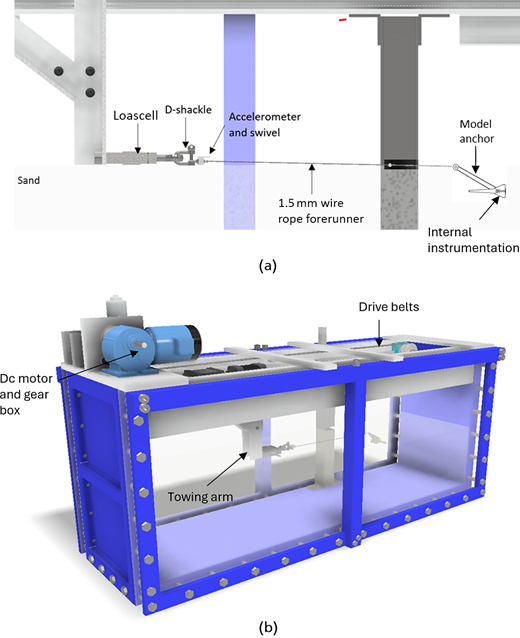
Schematic diagram of centrifuge anchor installation apparatus utilised for both centrifuge and 1g testing: (a) assembly of apparatus and attachment of anchor to the towing arm, (b) diagram of complete actuator and strong box (soil is not shown for clarity)
Schematic diagram of centrifuge anchor installation apparatus utilised for both centrifuge and 1g testing: (a) assembly of apparatus and attachment of anchor to the towing arm, (b) diagram of complete actuator and strong box (soil is not shown for clarity)
The anchor pad-eye was connected to the load cell by a forerunner (tow cable) consisting of a 1.5 mm diameter steel wire rope of length 420 mm (Figure 3(a)). A cable was selected in place of a chain due to the difficulty in obtaining a chain scaled correctly that would be strong enough to withstand the forces experienced in the centrifuge experiments. It was also thought that a cable would represent a worst-case scenario due to its lower frictional resistance and reduced flexibility, thus resulting in the anchor that penetrate deeper than one installed using a chain. Determining the influence of a chain compared with a cable would require a further study, which is out of scope of the present study. A swivel and shackle were located at the load cell end of the forerunner cable to minimise tortional forces from tensioning of the twisted wire rope. A 200g three-axis accelerometer (Analogue Devices ADXL377) was mounted to the swivel to measure the inclination of the forerunner during the centrifuge tests, and a 3g three-axis accelerometer was used for the 1g tests, which was used as an indication of the shank angle of the anchor. The measurements of the accelerometer were verified pre- and post-testing by taking manual measurements of the taught forerunner cable using a digital clinometer. The values obtained from the digital clinometer were on average ±0.1° different from that of the accelerometer due to the level of precision from the clinometer. Based on excavations conducted of the anchor post-testing, it was found that the shank of the anchor was in-line with the forerunner cable in all densities tested; as such, it was assumed that the angle of the forerunner cable could be used as an indication of the angle of the anchor shank. This assumption would only apply for the experiments and would not be applicable for anchor deployment in the field, as it is unlikely that the inclination of the towline/chain would be the same as that of the anchor shank in long chain field situations. This is due to potential that a reverse catenary is formed in the soil by the chain.
To control the actuator and record the signals from the analogue sensors, a National Instruments (NI)–based control and data acquisition system was used with a purpose-built Labview 2018 virtual instrument. The system is based around a CompactRio cRIO-9024 in hybrid mode, utilising both the scan engine and field programmable gate arrays for analogue output (instrumentation power and relay switching, where the relays control the power state and direction of the motor) and analogue input (reading signal data from instrumentation). To provide the required stable voltage to the wired analogue sensors, an NI-9264 C-series module was utilised and an NI-9202 C-series modules was used to simultaneously read the analogue channels. A logging rate of 50 Hz was used for all instrumentation, as this was deemed adequate for the relative slow drag velocity (20 mm/min) of the model anchor. The drag speed was chosen to maximise the amount of data that were recorded by the logging system in the relatively short time available from the batteries used in the anchor internal instrumentation. As the test was conducted under drained conditions, this did not influence the results of the experiment.
Testing started with the anchor on the sand surface, such that the opening angle was 0° and test progressed by advancing the platform away from the anchor at a rate of 20 mm/min. The test was typically stopped after 1000 mm of displacement. Once the test had been conducted, and the centrifuge had spun down, the soil surrounding the anchor was partially saturated using water and the anchor was carefully excavated to take measurements of the anchors final penetration depth, shank angle and fluke angle to confirm the readings recorded by the on-board logging system during the test. The anchor attitude (orientation relative to the seabed) was measured using a digital inclinometer and the anchor depth determined relative to the sand bed surface using a Vernier calliper.
2.3 1g testing
To undertake the 1g testing, the same equipment and testing procedure as described for the centrifuge experiments were used (Figure 3(b)). The only difference between the two sets of experiments is that the centrifuge-based experiments were conducted at 16.4g, whereas the 1g experiments were conducted on the lab floor without the use of the centrifuge. This allows for a direct comparison of the experiments.
2.4 Instrumentation development and operation
The towline accelerometer was monitored with the NI-based logging system through a wired connection that travelled up the towing arm. The internal system inside of the anchor was based around a low-cost Seeed Studio XIAO nRF52840 Sense Bluetooth development board, which is an Arduino compatible board (Figure 2(b)). The development board features an on-board Bluetooth antenna (for transmitting and receiving data) and a six-axis inertial measurement unit (IMU) containing a 16g three-axis accelerometer and a three-axis gyroscope. Due to the low measuring range of the digital accelerometer built into the development board, a secondary 200g accelerometer was wired into the Seeed Studio board for transmitting to the logging PC. To programme the Seeed Studio XIAO nRF52840 Sense, a variety of programming languages and software packages can be used, including but not limited to Arduino Integrated Development Environment (IDE), MicroPython and CircuitPython; in the case of this study, Arduino IDE was utilised, with C++ being the chosen programming language.
The on-board anchor Bluetooth instrumentation was continuously logged at a rate of 50 Hz. To process the data, a Kalman filter was used to calculate the state of the anchors position and orientation based on the measured six-axis IMU data. Since undertaking the experiments outlined in this study, the logging system for the wireless sensors has been updated and thus it recorded the data concurrently with that of the wired sensors. The Bluetooth signal for the updated system was received by a nonsense XIAO BLE development board from the XIAO nRF52840 Sense in the anchor and the data written through a serial connection to the CompactRIO, such that the wireless instrumentation and the wired instrumentation are logged concurrently. The data are then logged directly in Labview to a technical data management streaming file.
The XIAO nRF52840 used in this study was programmed to broadcast the data to the logging PC. The transmitting unit was powered by two nickel–cadmium (NiCad) coin-cell batteries to provide the required voltage to the development board. NiCad batteries were used in place of the more power dense lithium-based battery types (lithium ion and lithium polymer) due to safety concerns. Lithium battery technology is considered too volatile for the forces experienced in centrifuge testing, due to the potential damage that may occur when spinning up and as such are not used in the University of Dundee geotechnical centrifuge. As a result of using the NiCad batteries, the available transmission time of the development board is significantly reduced such that for a single battery pack, only 30 mins of power is available. Therefore, the battery pack is changed for each test.
Instrumentation embedded on the XIAO BLE Sense board and attached to the anchor through wires were powered through the voltage regulator chip on the board. To extend the available charge on the coin-cell batteries, the development board was initially placed in standby mode, in which none of the instrumentation is powered and no transmission of data is occurring. Once the centrifuge had reached the desired g level, a signal was sent from the logging PC to ‘wake’ the development board up, at which point the data are read from the on-board gyroscope and accelerometer and concatenated with the timestamp of the reading and then transmitted to the logging PC. For each timestep or cycle of data reading, the concatenated string is transmitted and received, such that the logging PC received the data at a frequency of 50 Hz. Before commencing the test, the logging PC received 10 s of data to establish a baseline and to ensure that the data were being transmitted effectively. Once it had been established that the signal is stable, the test commences. At the end of the drag event, the data are recorded for an additional 30 s before a sleep command is transmitted to the development board in the anchor to place it back into standby mode.
The data for the wired instrumentation (towline accelerometer, load cell and DWT) were recorded from the moment the centrifuge starts to accelerate, and recording ends when the centrifuge has decelerated and has come to a standstill. To synchronise the data from the wired and wireless sensors, inclination of the towline accelerometer and the point at which the load cell records a force are assessed. As the forerunner cable is initially slack, the inclination of the accelerometer on the swivel reads a value that is high in pitch direction (Figure 1(b)). When the sled moves, the forerunner becomes taut, and as the load cell is positioned at the surface of the soil, the pitch of the accelerometer reads a single digit value, typically 1°–3°. When this value remains constant for 25 consecutive readings, it is assumed that this is the range in which the anchor starts to move. The load cell data within this range are then assessed and an initial jump in the data can be seen and this indicates that the anchor has moved. This point in time is then matched up with the initial movement shown in the wireless gyroscope and accelerometer data and selected as the start point of the test.
Once the data have been synchronised, the data from the instrumentation can be converted into the orientation of the anchor and the forerunner cable using the method outlined in Robinson et al. (2019), with the pitch of the anchor and forerunner calculated using Equation 2. To determine the positional data of the anchor, the three directions of acceleration recorded by the accelerometer were corrected using the gyroscope data using the following equations:
where Ax, Ay and Az are the accelerations recorded in the local x, y and z directions based on the orientation of the MEMs accelerometer, θ is the angle in a given direction, θa is the angle reported from the accelerometer and μ is the data from the gyroscope.
Once the accelerometer data had been corrected, the data were then passed through a Kalman filter using the following procedure:
where Xk is the current state, xk is the current position in the x direction, yk is the current position in the y direction, denotes the velocity of the previous timestep and is the acceleration in the x direction at the previous timestep. This can then be simplified as follows:
where Xk is the current state, Xk−1 is the previous state and ak−1 is the vector of the previous acceleration in the x and y directions. Matrices A and B can then be defined as follows:
The measurement model zk can then be defined as follows:
where H is the transformation matrix and vk is the velocity vector of the current timestep.
The process convergence matrix (Q) for the 2D Kalman filter can be defined as:
where and are the standard deviations of the position and velocity, respectively, which can then be defined using the standard deviation of the measured acceleration using the following assumption:
where Sa is the magnitude of the standard deviation of the acceleration. The measurement noise covariance matrix R can then be defined as:
Specifying the initial position of the anchor, a timestep of 20 ms (due to the 50 Hz logging rate), and the corrected acceleration values in the x and y direction (based on the orientation of the anchor with respect to the gravitational field), the aforementioned matrices can be input into the KalmanFilter.py functions in python or the Kalman filter function available in MATLAB, to obtain the current state Xk of the anchor with time (and by association drag distance). A flow chart outlining the steps taken to calculate the penetration depth can be seen in Figure 4.
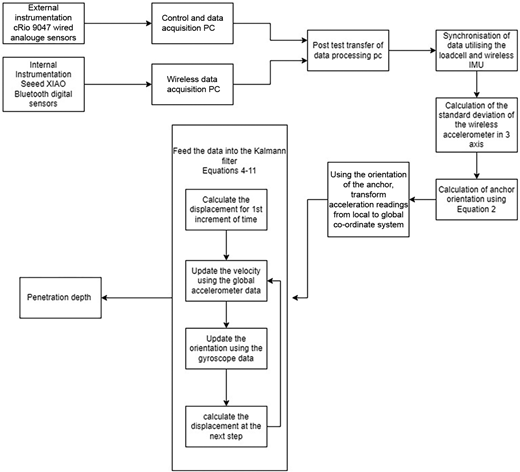
Flow chart outlining the steps required to calculate the penetration depth of the anchor from the recorded data
Flow chart outlining the steps required to calculate the penetration depth of the anchor from the recorded data
3. Results and discussion
The following section presents the comparison of the data obtained from the 1g and centrifuge tests in all soil densities investigated. Results and dimensions are shown at prototype scale, unless otherwise stated. The results section is split into three sections, the first outlining the load–displacement behaviour of the anchor, the second the attitude of the anchor during the anchor pull and the third and final section discussing the reliability and experience using the developed instrumentation.
3.1 Scaling
The scaling laws adopted in this study for both the 1g and centrifuge testing are shown in Table 3 as summarised by Robinson et al. (2019).
Comparison of model scaling factors used for 1g and centrifuge testing (Robinson et al., 2019)
| Parameter | Scaling factor for 1g testing | Scaling factor for centrifuge testing |
|---|---|---|
| Acceleration | 1 | N |
| Length | 1/N | 1/N |
| Volume | 1/N3 | 1/N3 |
| Mass | 1/N3 | 1/N3 |
| Stress | 1/N | 1 |
| Force | 1/N2 | 1/N2 |
The adequacy of the 1g test scaling has previously been proven by Lauder and Brown (2014) that used a modelling of models technique that involved 1g testing of offshore pipeline ploughs at various scales (1/10th, 1/25th, 1/50th). This was later verified by Robinson et al. (2019) for dry and saturated testing of pipeline ploughs and Robinson et al. (2017) for cable ploughs by comparison to centrifuge testing and field tow forces from real installation campaigns. These verification processes have typically considered large deformation load–displacement behaviour and have not typically focused on plough kinematics and attitude. The same laws were adopted in this study for a buried DEA.
3.2 Comparison of load–displacement behaviour of 1g and centrifuge drag embedment anchor test
Figure 5 outlines the load–displacement behaviour of the 1g and centrifuge anchor drag tests in all soil densities tested. The secondary axes of Figure 5 (top and right) have been normalised by properties of the anchor, the drag distance has been normalised by the fluke length, and the tow force by the anchor weight. A comparison to a similar albeit more efficient stockless anchor has been added to Figure 5 utilising the design charts in the API RP 2SK document (Petruska et al., 2008). Two lines have been presented in Figure 5 to highlight the 25% reduction suggested for dense sands. The performance of the AC-14 anchor in the experiments are in line with those of the stockless anchor (a similar anchor), with a reduction for dense sands also being present in Figure 5 for the AC-14 anchor tested, although the reduction is only 15%. From Figure 5, it can be seen that the load–displacement behaviour of the anchor is near identical when comparing the two testing methods with both the stiffness of the transition zone (distance to reach full depth and a steady-state force) and the UHC being the same for a given density. When assessing the holding capacity of the anchor, it can be seen that for the loose (Dr = 25% and 38%) and the medium dense (Dr = 55%) soil beds, the UHC value is 32% higher than in the dense soil bed (Dr = 82%). Although this may appear counter-intuitive due to higher density soils having greater resistance, this phenomenon can be explained by orientation of the anchor at UHC and the penetration depth that is reached when the anchor reaches steady state.
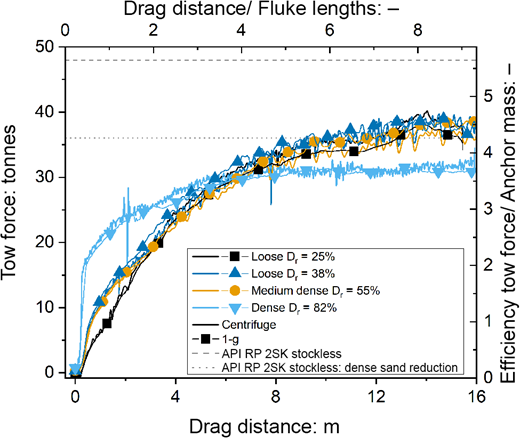
Comparison of the tow force plotted against drag distance for anchor tests conducted at 1g and centrifuge model testing with comparison to a higher specification stockless anchor type in API RP 2SK
Comparison of the tow force plotted against drag distance for anchor tests conducted at 1g and centrifuge model testing with comparison to a higher specification stockless anchor type in API RP 2SK
From previous studies, and the results of the current investigation, it has been identified that the penetration depth of the anchor is inversely proportional to the relative density of the sand bed, with looser soils producing higher penetration than denser soils (Figure 6) (Moore et al., 2021 ; Naval Civil Engineering Laboratory, 1982). The lack of penetration results in a lower overburden stress and as such a reduction in the resistance. The anchor will attempt to reach a position in which the forces acting on the front and rear faces of the fluke are in equilibrium, and in general, for fixed fluke anchors this is likely to result in the same value for UHC for the majority of soil densities for a given anchor geometry. In the case of the anchor used within this study, the geometry of the anchor changes as it is being pulled along, as the anchor fluke is able to open to whatever angle it requires to meet equilibrium; as such, it is not necessarily the case that the opening angle of the anchor is the same for all soil densities, which could result in different UHC values occurring in the different soil relative densities. To investigate this, the orientation of the anchor was assessed during the pull to determine how the opening angle evolves with drag distance.
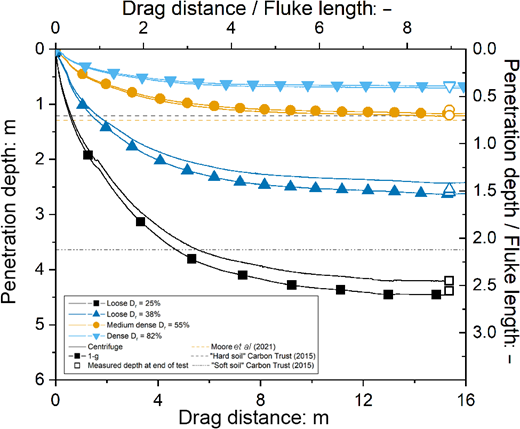
Comparison of the anchor penetration depth from 1g and centrifuge model anchor tests (open symbols are measured at the end of test to verify depth). Comparison also with previous drum centrifuge testing (Moore et al., 2021) and the field CBRA approach (Carbon Trust, 2015)
Comparison of the anchor penetration depth from 1g and centrifuge model anchor tests (open symbols are measured at the end of test to verify depth). Comparison also with previous drum centrifuge testing (Moore et al., 2021) and the field CBRA approach (Carbon Trust, 2015)
3.3 Comparison of orientation and embedment depth of anchor
In the case of this study, the geometry of the anchor is able to change (fluke opening angle; Figure 2) during the dragging event as the opening angle of the AC-14 anchor is not fixed at the start of the test (in both the 1g and centrifuge tests) (Figure 7). This results in the opening angle of the anchor changing as the anchor opens up when being pulled and remains in a certain position after the transition length.
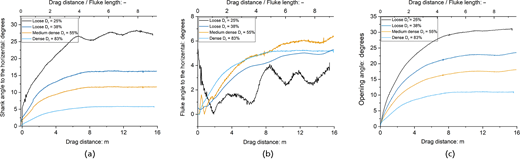
Orientation of the model anchor during test, angles taken from the horizontal axis: (a) shank angle, (b) fluke angle, (c) opening angle (all data in this figure are from centrifuge tests)
Orientation of the model anchor during test, angles taken from the horizontal axis: (a) shank angle, (b) fluke angle, (c) opening angle (all data in this figure are from centrifuge tests)
Figure 7 shows the orientation of the anchor during the pull, with the fluke angle, shank angle and the opening angle all outlined for all relative densities tested in the centrifuge. A graphical representation of the anchor attitude at the end of the pull can be seen in Figure 8. From Figures 7(a)–7(c), it can be seen that transition length of the lower three densities is similar with the anchor reaching its equilibrium point (flattening of the curve) by a distance of 8.0 m, whereas in the dense soil bed this point is at approximately 5.0 m of horizontal displacement. The assumption of Equation 1 is that the maximum opening angle is achieved by the anchor for all soil types and densities; it is also assumed that the shank is near horizontal to the sand surface. From the data obtained from the anchor tests, it can be seen in Figure 7(a) that the shank angle (Figure 1(b)) varies significantly with relative density. The range of shank angle to the horizontal is from 27° in the loose soil bed (Dr = 25%) to 5° in dense soil bed (Dr = 83%), with no cases showing a horizontal shank angle. In terms of the opening angle (Figure 1(b)), shown in Figure 7(c), only the loose soil bed (Dr = 25%) nearly achieved the full opening angle of the anchor, at 31°, with the opening angle reducing as the relative density increases. In the case of the densest soil bed tested, the opening angle is reduced to only 10°, indicating that in this soil bed it was not possible for the anchor to open, which may explain the differences between the UHC values from Figure 5.
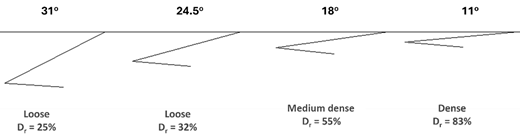
Schematic representation of the orientation of the anchor at the end of the pull (note that the anchor at not shown at the final depth but are all displayed as if at the surface)
Schematic representation of the orientation of the anchor at the end of the pull (note that the anchor at not shown at the final depth but are all displayed as if at the surface)
Figure 7(b) shows that the angle of the fluke to the horizontal does not increase significantly during the drag event with the angle to the horizontal ranging from 6° to 3° at the end of the anchor pull; fluctuations in the data are attributed to adjustments in the fluke angle as the anchor is being dragged along to maintain an equilibrium of forces on the fluke as there appears to be an optimum UHC that is maintained. The fluctuations only occur in the loose soil and are thought to be due to fluctuations in soil bed density due to difficulty in producing loose soil beds. The angle of the fluke has a small density dependency with the looser soil showing a flatter angle of the fluke compared with the dense soil bed. This could be attributed to a difficulty in the fluke penetrating into the soil as a larger resistance would be met as the relative density increases. The results also show that the assumption of zero fluke angle at UHC adopted in analytical (Neubecker and Randolph, 1996) approaches may not be appropriate.
Figure 7(c) also shows that as the sand relative density decreases, the opening angle of the anchor increases, with the test in the loose soil bed reaching an opening close to the maximum (35°) at 31°, whereas in the dense soil bed the anchor only achieves an opening of 15° at the end of the anchor pull. The opening angle is predominantly determined by the shank angle (Figure 7(a)) and can therefore be linked to the depth of penetration, as it assumed that the forerunner cable (towing cable) of the anchor is taught during the pull and inline with the anchor shank due to the necessity of it being relatively short. To confirm the assumption of the shank angle based upon forerunner inclination to the horizontal, exhumation of the anchor was conducted after each pull, and the angle of the forerunner cable and the shank of the anchor were manually recorded using a digital inclinometer and compared. The physical measurements of the cable and shank matched and were within 0.1° of the calculated values using the instrumentation. As the anchor penetrates deeper, the inclination of the forerunner cable increases, resulting in the anchor opening up further.
Using the instrumentation in the anchor and the Kalman filter is possible to approximate the depth of the anchor. Figure 6 shows the depth of all the anchors tested within this study. An additional point has been added to each data set to verify the depth of the anchor after the test had been conducted, with this data point being obtained by manual excavation of the anchor and measurements to surface using callipers. From Figure 6, it can be seen that as the relative density increases, there is a decrease in the penetration depth of the anchor, with the dense soil bed having a penetration depth of 0.7 m or 0.4 fluke lengths and in the loose soil bed the anchor has a penetration depth of 4.2 m or 2.5 fluke lengths. Comparing these values with the recommendation of penetration depth of 1 fluke length by Naval Civil Engineering Laboratory (1982), which is cited in the Carbon Trust (2015) documentation, it can be stated that for looser soils (Dr < 40%) the anchor is able to penetrate deeper than the recommendations. For Dr = 25% and 32%, the penetration was 150% and 50% larger than the 1 fluke length suggested by Nation Civil Engineering Laboratories (1984) (as indicated by the ‘hard soil’ line on Figure 6), as also shown in Sharif et al. (2023).
Figure 6 compares the penetration depths achieved in the 1g and centrifuge model tests for all relative densities. From Figure 6, it can be seen that the 1g testing is able to accurately recreate the results of the centrifuge tests in the medium dense (Dr = 55%) and the dense (Dr = 82%) sand beds, but overpredicts the penetration by a small amount (6%) in the loose (Dr = 25% and 38%) sand beds. As the overprediction is small and the depth is greater in the 1g tests, the ability of 1g testing to capture the penetration depth of the anchor is thought to be adequate across all sand relative densities.
Figures 9(a) and 9(b) compare the attitude of the centrifuge and 1g anchor tests in the loose (Dr = 25%) and dense (Dr = 82%), respectively. From Figure 9, it can be seen that the small changes in the attitude of the anchor exist between the 1g and centrifuge experiments, with the difference in orientation being greater in the loose soil bed than in the dense, as was also shown in the penetration depth data. The largest difference in Figure 9(a) is seen in the shank angle, which is directly related to the penetration depth; the angle to the horizontal of the anchor shank is lower in the centrifuge tests due to the reduced penetration depth. The fluctuations in the loose soil data are thought to be a result of the difficulties in preparing loose sand beds but make no overall significant difference to the kinematic behaviour of the anchor. In the dense soil bed (Figure 9(b)), the data show that the 1g test is able to reproduce the findings of the centrifuge experiment with both the fluke and shank angles matching. Overall, the centrifuge and 1g behaviour of the anchor is consistent in terms of both the kinematic properties and the UHC. Therefore, the assumptions made for ploughing proposed by Robinson et al. (2019) seem to be extendable for DEAs of the scale used within this study.
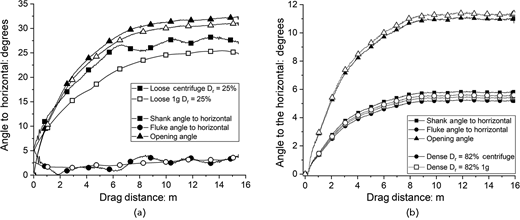
Comparison of anchor attitude in 1g and centrifuge tests within a given soil density: (a) loose soil bed (Dr = 25%), (b) dense soil bed (Dr = 82%)
Comparison of anchor attitude in 1g and centrifuge tests within a given soil density: (a) loose soil bed (Dr = 25%), (b) dense soil bed (Dr = 82%)
The reason behind the kinematic and behavioural similarities between the centrifuge and 1g tests is down to the behaviour of large displacement of low effect stress boundary value problems such as those experienced by pipeline (Lauder et al., 2013) and cable ploughs (Robinson et al., 2019). As discussed by Neubecker and Randolph (1996), the soil resistance and therefore the forces acting upon the anchor are generated by a series of consecutive passive wedges, with a shear plane propagating from the tip of the fluke to the soil surface. Lauder et al. (2013) explained the approach behind why small-scale 1g testing was able to replicate field scale performance using a model of models approach for pipeline ploughs, which have a similar soil failure mechanism. The friction angle along the shear plane evolves and travels along the failure plane resulting in only relatively limited extents reflecting peak behaviour. The length of the shear plane associated with the peak friction angle is approximately 176 D50 according to Stone and Wood (1992), which would be 24 mm for the HST95 sand used within this study. This equates to 12% of the shear plane at centrifuge scale and 31% at 1g. The increase in soil resistance from the critical state portion of the shear band is accounted for in the scaling laws, due to the additional N in the multiplication to calculate force (force scaling from 1g is N3 and for centrifuge is N2). This accounts for the reduction of effective stress attributed to the lack of an enhanced g field. The tip domain (dilating front) reflects movement from peak to critical state behaviour and is at the leading edge of the forming shear plane. Therefore, as the shear plane is at its full length, the shear stress associated with the tip domain is relatively small and therefore the enhanced dilation does not influence the behaviour of the anchor significantly.
In terms of the effect on the trajectory of the anchor, as the influence of the dilating front is minimal it is thought that the overall forces acting on the individual components of the anchor are proportional in the 1g and centrifuge case (and the attitude is controlled by the balance of forces). This means that the orientation of the anchor at any given point would be similar for the centrifuge and 1g cases and the equilibrium point for the next horizontal increment would follow a similar pattern.
Using the instrumentation outlined in this study has enabled the tracking of both the shank and fluke of the anchor, which has not previously been possible using a non-contact approach. This has allowed for the evolution of the anchor orientation and penetration to be monitored over the length of the drag event. It was observed that the anchor does not open to its full extent in all soil densities, contrary to the assumption of Equation 1, with looser soils having a larger opening angle and denser soils having very narrow opening angle. It was also found that the shank angle was dependent on the penetration depth of the anchor and the relative density of the soil and not always near horizontal, although this is the case for the medium dense and dense soil beds. This indicates that for looser soils Equation 1 would need to be modified to include not only the opening angle of the anchor but also the shank angle to the horizontal, as this will inform the direction and size of the soil wedge formed when pulling the anchor across the seabed.
4. Conclusion
This paper has presented a comparison of the load–displacement and kinematic behaviour of the 8.5 tonne AC-14 anchor in homogeneous sand beds of different relative densities tested using both 1g and centrifuge model testing under drained sand conditions. The results of the investigation have shown that as density decreases, the penetration of the anchor increases and that the anchor penetration in loose soils is up to 2.5 times higher than previously predicted. The experimental results represent anchors that have been pulled under drained conditions using a cable rather than a chain, which is assumed to be the worst-case scenario. Further work is required to assess the influence of using a chain and on the influence of rate effects on the anchor behaviour.
The 1g model test was able to replicate the holding capacity of the anchor when scaled up to full size using the scaling factors proposed by Bransby et al. (2005) for ploughing, which have previously been validated by Robinson et al. (2017) for all soil densities tested. The kinematic behaviour of the anchor is comparable at 1g and centrifuge modelling, in terms of its attitude during and at the end of a test. The penetrations depth of the anchor at the end of a pull was shown to be similar in the 1g and centrifuge experiments, with there only being a 6% increase in depth in the loose (Dr = 25%) at 1g when compared with its centrifuge counterpart. Thus, for certain large strain problems, 1g testing can be a reliable and valid alternative to centrifuge testing even for low stress near surface problems.
The wireless instrumentation developed was shown to work well at transmitting data wirelessly from the anchor to a logging PC and was able to measure the inclination of the anchor in real time. Post-excavation of the anchor showed that the instrumentation was able to accurately measure the orientation of the anchor. Using the orientational data recorded during the pull, it is possible to accurately calculate the penetration depth of the anchor, with the post-drag depth matching the calculated value. This study has shown that it is possible to track very small complex buried moving objects in both 1g and centrifuge testing using low-cost, widely available logging and wireless communication systems using simple techniques that can be easily implemented.
Acknowledgements
This work was funded through the UKRI EPSRC grant EP/W000954. W000997, W000970 ‘Offshore Cable Burial: How deep is deep enough?’, in collaboration with Durham University and the British Geological Survey.
