


Smart factory (SF) adoption has become a critical strategy for achieving energy efficiency and sustainable operations. While prior studies emphasize technological drivers, non-technological perspectives remain underexplored, particularly regarding adoption timing and barriers. This study aims to examine the self-efficacy value adoption model (SVAM) by incorporating digital trust (DT) as a determinant of intention to adopt a SF.
This explanatory research applies technology adoption and self-efficacy (SE) theories, using a quantitative approach. Data were collected through a structured questionnaire distributed via Google Forms to managers and employees in technology provider companies actively engaged in SF adoption. A total of 189 valid responses were analyzed with structural equation modeling using SmartPLS 3.2.4.
Results indicate that SE does not directly affect adoption intention but becomes significant when mediated by perceived value (PV). The role of Internet of Things (IoT) in influencing PV is limited, as respondents who are already technologically adept consider IoT a basic necessity rather than a differentiating factor. Moreover, gender does not moderate the relationship between DT and SE.
This study contributes by positioning DT as a critical determinant within the SVAM, highlighting its role in shaping adoption decisions. The findings emphasize the importance of aligning managerial support and frontline employee engagement in realizing SF integration, offering both theoretical enrichment and practical guidance for industry stakeholders.
1. Introduction
The digital transformation of manufacturing through smart and connected products (SCP), particularly in the form of smart factories (SFs), has become essential for companies to remain competitive (Porter and Heppelmann, 2014, 2015). The value proposition of implementing SCP has led to the creation of innovative solutions that not only enhance products but also offer services to customers (Yu and Sung, 2023). As a result, many competitive companies have experienced accelerated digital transformation (Walas and Redchuk, 2021; Jiao et al., 2021). This transformation is not merely technological but also strategic, as firms increasingly recognize the central role of SCP and SF in reshaping value chains, production efficiency and sustainability practices.
The concept of SF evolved from the idea of the transparent factory (Ciardiello, 1998), which emphasized the importance of providing remote access to production areas and facilitating equipment maintenance, diagnostics (Farahani and Monsefi, 2023) and scheduling (Zhou et al., 2021). It also involved the flow of transparent statistical data from the production level to decision-makers at the top management level (Khourshed et al., 2023). The difference between the transparent factory and current SF lies in the level of connectivity through Internet of Things (IoT) technologies and other technological advances like big data, artificial intelligence (AI) and machine learning. These technologies allow for real-time data processing, which is crucial for strategic decision-making (Cao et al., 2022a, 2022b; Sánchez et al., 2020).
As Bouras et al. (2023) argue, SF serve as a bridge between the cyber and physical worlds, especially in traditional manufacturing environments. The academic and industrial attention to SF has grown rapidly since 2015, with the number of publications increasing 20-fold and peaking at more than 300 articles in 2019 (Calabrese et al., 2022). This surge reflects the growing relevance of SF within Industry 4.0 and beyond, signaling that digital transformation has moved from a theoretical concept to a practical necessity. Companies generally pursue two primary strategies through SF adoption: customer engagement strategies and digitized solution strategies (Sebastian et al., 2017). Although complementary, organizations are often advised to prioritize one over the other in the early phases of digital transformation to maximize returns and build organizational readiness (Ross et al., 2016).
SFs and IoT technologies play a significant role in achieving sustainability goals, particularly energy efficiency (Akkad and Bányai, 2023; Karthikeyan and Nagaprakash, 2024). These technologies can reduce production costs by up to 20% and contribute significantly to environmental conservation (Tampubolon et al., 2024). Implementing SF allows companies to meet sustainability targets, particularly sustainable development goal (SDG) 12, which focuses on improving energy efficiency (Hischier et al., 2020). Achieving these energy efficiency goals and reducing costs is possible through the integration of operational technology and information technology within the manufacturing processes (Gombár et al., 2024). The optimal energy efficiency is realized when AI-driven machine decisions align with human decisions, which is possible through the integration of technology (Gunasekaran et al., 2023). Traditional factories must transition to SF to stay competitive and ensure sustainability in the long run (Shao et al., 2021; Grabowska et al., 2022). However, this transition is not without its challenges, as the increasing energy demands of production processes need to be balanced with energy conservation goals, an issue referred to as the efficiency dilemma in manufacturing (High and Smith, 2019).
The adoption of SF represents a correct and rapid approach (Sánchez et al., 2020) to meeting SDG 12 targets. Although SDG 12 is most prominent in the context of the food supply chain, it is closely tied to broader responsible production and consumption practices. Indicators such as productivity per kilogram of oil (Skare et al., 2023) and carbon emissions intensity (Carlsen, 2021) highlight how SF technologies can enhance sustainability performance. Energy and water usage remain central to this discussion, as energy production and consumption drive the majority of emissions worldwide (Jiao et al., 2024). Within manufacturing, non-thermal food preservation enabled by SF reduces energy intensity compared to thermal processes, thereby lowering emissions (Djekic et al., 2021). Empirical evidence confirms that industrial Internet of Things (IIoT)-enabled SFs reduce emissions by improving energy efficiency (Hidayatno et al., 2019) and that adoption extends across industries such as agriculture (Almadani and Mostafa, 2021), food (Redchuk et al., 2023), livestock (Sharma and Villányi, 2023), waste management (Skare et al., 2023) and textiles (Li et al., 2022). Some scholars (e.g. Das, 2023) question the degree to which SF directly supports SDG 12, but others (e.g. Fatimah et al., 2020; Singh et al., 2022) confirm a strong linkage. This mixed evidence underscores the need for further empirical work.
Moreover, SF empowered by IoT technologies not only produce products but also create value-added services, enhancing customer engagement and enabling companies to offer customized solutions tailored to individual customer needs (Wynarczyk et al., 2013; Savitha and Hawaldar, 2022). However, for this transformation to be successful, companies must foster digital trust (DT) among their employees, which combines trust in technology, data, processes and the machines being used (Mubarak and Petraite, 2020). DT is a critical factor in the successful adoption of IoT and SF, influencing employees’ willingness to embrace technological change (Nazron et al., 2023; Jayashankar et al., 2018). Trust in machines, rather than trust in humans, has been shown to significantly affect the intention to adopt (ITA) technology (Tsai et al., 2010). Given this, the DT variable should be further developed and incorporated in the digital transformation processes of companies to ensure successful implementation (Hargitai and Bencsik, 2023).
Despite extensive research on technology adoption, significant theoretical limitations remain when explaining SF adoption in sustainability-oriented contexts. The technology acceptance model (TAM) primarily emphasizes perceived usefulness and ease of use, making it effective for explaining initial technology acceptance but insufficient for capturing value-based and sustainability-driven adoption decisions. Similarly, the value adoption model (VAM) extends TAM by incorporating perceived value (PV) but largely treats users as passive evaluators of technological benefits.
The self-efficacy value adoption model (SVAM) advances these frameworks by explicitly incorporating self-efficacy (SE), recognizing users as active agents whose confidence in using technology shapes value evaluation and adoption behavior. However, existing SVAM studies have largely neglected DT, a critical factor in SF environments characterized by automation, algorithmic decision-making and data dependency.
Moreover, prior studies rarely link SVAM-based adoption mechanisms to sustainability objectives such as SDG 12, resulting in a disconnect between behavioral adoption models and responsible production outcomes. This study addresses this gap by extending SVAM through the integration of DT and positioning PV as a behavioral mechanism that enables SF adoption to contribute meaningfully to responsible consumption and production.
To enrich the explanatory power of this framework, this study introduces gender as a moderating variable. Although gender differences in technology adoption, DT and PV have been examined in previous studies, this research contributes by focusing on gender as a moderating factor in the adoption of SF technologies. Prior studies, such as Wu and Liu (2025), Kim et al. (2023) and del Mar Fuentes‐Fuentes et al. (2023), have highlighted the impact of gender diversity in top management on digital transformation and firm performance. Venkatesh et al. (2003) highlights gender as a moderator in the unified theory of acceptance and use of technology (UTAUT), while Gefen and Straub (1997) show that men and women differ in their trust-building processes with technology. In the context of SF adoption, male employees may demonstrate stronger SE when interacting with advanced technologies, while female employees may place greater emphasis on trust and PV (Zhou et al., 2021). Therefore, this study hypothesizes that gender moderates (a) the relationship between DT and the ITA SF and (b) the relationship between PV and the ITA SF. By accounting for these differences, this research acknowledges the role of inclusivity and diversity in digital transformation strategies and emphasizes the need for gender-sensitive approaches in organizational change.
The research gap that this study addresses lies in the limited exploration of behavioral factors such as DT and SE in the adoption of SF technologies. While much of the existing research focuses on the technological and financial barriers to SF adoption, the behavioral and demographic moderators have not been adequately explored (Taqi et al., 2023). Moreover, most studies focus on developed economies, leaving developing countries, such as Indonesia, underexplored despite their unique challenges in adopting smart manufacturing technologies (Grabowska et al., 2022; Roblek et al., 2021).
Accordingly, this study seeks to answer the following research questions:
How does DT enhance the success of SF adoption through the application of SVAM theory?
What is the direct impact of DT and SE on the success of SF adoption?
How do perceptions of trust, IoT and SF influence perceptions of DT?
How does gender moderate the relationship between DT, PV and the intention to adopt smart factory?
By answering these questions, this study contributes to the literature on digital transformation by enriching the application of SVAM theory in the context of SF adoption. This study used a quantitative approach using partial least squares structural equation modeling (PLS-SEM) to assess the relationships between DT, SE, trust, IoT and gender in the context of ITA SF. Data was collected through a structured survey, targeting employees and managers involved in the adoption of smart technologies. Theoretically, it expands our understanding of how non-technological factors such as DT, SE and gender differences influence the adoption of SF technologies. Practically, the findings provide actionable insights for organizations to design gender-sensitive strategies, enhance employee trust and strengthen SE to maximize the potential benefits of digital transformation.
Accordingly, this study aims to extend the SVAM by integrating DT and examining how behavioral factors enable SF adoption to support sustainability objectives under SDG 12. By focusing on employees and managers involved in SF implementation, this research highlights the role of PV as a critical mechanism linking technological capabilities, trust and SE to adoption intention.
The study contributes theoretically by bridging behavioral technology adoption models with sustainability discourse and practically by offering insights into how organizations can design trust-based and value-oriented strategies to ensure that SF investments translate into responsible and sustainable production practices.
2. Literature review and hypothesis development
2.1 Theoretical foundation of SVAM
The SVAM originates as an extension of earlier theories of technology adoption, such as the theory of reasoned action (Fishbein and Ajzen, 1975), the TAM (Davis, 1989) and the theory of planned behavior (TPB) (Ajzen, 1991). These classical models conceptualize adoption as a rational process shaped by attitudes, perceived usefulness, perceived ease of use and behavioral control. However, they tend to oversimplify user behavior and often fall short in capturing the complexity of modern information and communication technology (ICT) environments (Kim et al., 2007).
SVAM strengthens these frameworks by explicitly introducing SE as a central determinant of adoption. SE, grounded in Bandura’s (2012) social cognitive theory, reflects an individual’s belief in their capability to effectively use new technologies. This addition improves predictive power because users’ confidence influences not only their perceptions of ease of use but also their evaluations of expected outcomes. Empirical evidence shows that SVAM outperforms earlier models, with Zhu et al. (2013) demonstrating a 64% higher predictive accuracy compared to the VAM.
The theoretical assumption underlying SVAM is that adoption occurs when individuals evaluate that the perceived benefits outweigh the perceived sacrifices and this evaluation is strongly shaped by SE. Individuals with high SE are more likely to perceive technology as manageable, valuable and less risky. However, recent studies reveal inconsistencies: while some confirm SE as a strong predictor of adoption (Masril et al., 2021; Stofberg et al., 2021), others find weak or context-dependent effects in smart manufacturing (Cao et al., 2022a, 2022b). This inconsistency underscores the need to further examine SE within the context of SF adoption, where human–machine collaboration is more complex than in traditional ICT settings.
In addition to SE, recent scholarship emphasizes the role of DT. Trust is a critical mechanism for reducing perceived risk and uncertainty in environments dominated by IoT, AI and automation (Mubarak and Petraite, 2020). A meta-analysis by Khan et al. (2020), which reviewed six major adoption theories (TRA, TPB, TAM, UTAUT, etc.), found that DT is rarely studied in isolation but often as a background or moderating factor. Yet, in highly digitalized and automated contexts like SF, DT deserves to be modeled as a direct antecedent shaping user evaluations and intentions. Trust in data integrity, machine decisions and organizational governance can fundamentally alter perceptions of value and adoption readiness (Jayashankar et al., 2018; Nazron et al., 2023).
Thus, this study extends the SVAM by incorporating DT alongside SE to form a more comprehensive framework. The assumption is that both SE (a personal belief) and DT (a relational/systemic belief) interact with technological enablers, such as IoT and SF capabilities and converge into PV, which in turn drives the ITA SF. This study integrates digital transformation into the socio-technical adoption model, addressing deficiencies in previous research that neglected risk, trust and socio-technical factors, thus providing a more robust theoretical framework for examining digital transformation in manufacturing.
2.2 Smart factory adoption, SVAM and SDG 12
Smart factory adoption is increasingly recognized as a strategic enabler of SDG 12 (responsible consumption and production), particularly through improvements in energy efficiency, resource optimization and waste reduction. SDG 12 emphasizes decoupling economic growth from environmental degradation by promoting responsible production systems, which aligns directly with the objectives of smart manufacturing technologies.
From a sustainability perspective, SF contribute to SDG 12 by enabling real-time monitoring of energy consumption, predictive maintenance to minimize material waste and data-driven optimization of production processes (Hischier et al., 2020; Akkad and Bányai, 2023). However, the realization of these sustainability benefits depends not only on technological deployment but also on human adoption behavior within organizations.
Existing sustainability-oriented studies predominantly focus on technological capabilities or environmental outcomes, often overlooking the behavioral mechanisms that determine whether SF technologies are effectively used (Das, 2023; Jiao et al., 2024). In this context, the SVAM provides a relevant behavioral lens by emphasizing how PV mediates the relationship between individual capability beliefs and adoption intention.
Integrating DT into SVAM further strengthens its relevance for SDG 12. Trust in data integrity, automated decision-making and cyber-physical systems reduces perceived risk and encourages employees to engage consistently with SF systems, thereby ensuring that sustainability-oriented technologies are not underused. Consequently, DT and PV act as behavioral enablers that translate SF investments into responsible production outcomes, positioning SVAM as a suitable framework for examining sustainability-driven technology adoption.
2.3 Digital trust, IoT, smart factory, self-efficacy and perceived value
Within the SVAM, the concept of PV plays a central mediating role. SVAM assumes that adoption decisions are not based solely on technological attributes but on the user’s evaluation of whether the expected benefits outweigh the sacrifices required (Zhu et al., 2013). This aligns with the broader perspective of value theory, where the survival and growth of organizations depend on their ability to consistently create value that resonates with users (Sweeney and Soutar, 2001). In the context of SF adoption, PV encompasses not only tangible benefits such as efficiency and cost reduction but also emotional and social dimensions that enable meaningful synergy between people, machines and digital systems (Marcial and Launer, 2019; Tortorella et al., 2023). Research confirms that PV mediates the effect of multiple antecedents on adoption intention, reinforcing its role as the cognitive mechanism that bridges perceptions and behavioral outcomes (Skandali et al., 2024; Jalo and Pirkkalainen, 2024; Li et al., 2024).
Building on this foundation, DT emerges as a critical antecedent of PV. According to SVAM’s assumptions, the evaluation of value is shaped not only by capability beliefs (SE) but also by the perceived trustworthiness of the technology and systems involved. Trust functions as a mechanism to reduce risk and uncertainty in decision-making (Mubarak and Petraite, 2020). In the SF environment, DT integrates confidence in machine reliability, data integrity and organizational processes, thereby strengthening the user’s evaluation of value. Moreover, DT is dynamic: before adoption, it draws on prior experiences to reduce hesitation, while after adoption, new perceptions of system reliability reshape future intentions (Zhu and Kubickova, 2023). Empirical evidence demonstrates that DT enhances the predictive validity of SVAM by magnifying the influence of antecedents such as perceived usefulness and risk perception (Balci, 2021; Wang et al., 2021). From this reasoning, it follows that:
Trust has a significant influence on perceived value.
The role of IoT technology is equally crucial in shaping PV within the SF context. IoT functions as the connective infrastructure that enables real-time communication among machines, sensors and human operators (Pandey et al., 2023). Its integration allows for rapid decision-making and personalization, which directly enhances users’ evaluations of value. Prior research confirms that positive perceptions of IoT reliability and personalization significantly improve PV (Lu et al., 2021; Lee, 2021). In developing economies, the extent to which IoT creates PV is closely tied to digital capabilities and organizational innovation cultures (Mandari, 2022; Falkenreck et al., 2023). Indeed, studies show that PV mediates a substantial portion of IoT’s influence on adoption intention, with Hu et al. (2022) reporting a mediating effect of 59%. These findings support the expectation that:
IoT has a significant influence on perceived value.
Similarly, the SF itself contributes directly to PV. The primary strength of SF lies in its ability to generate value through customization, resilience and digital integration, allowing firms to shift from mass production toward individualized solutions (Chen et al., 2021). When employees perceive SF as reliable and beneficial, supported by managerial encouragement and organizational readiness, their evaluation of value is enhanced (Potgieter and Ferreira, 2022; Jung et al., 2023). However, adoption decisions are also influenced by perceived risks such as high initial costs and complexity, which may either diminish or reinforce PV depending on how effectively organizations mitigate these concerns (Chang et al., 2021; Micu et al., 2021). This leads to the following expectation:
Smart factory has a significant influence on perceived value.
Finally, SE, the central construct in SVAM, links directly to PV. Bandura’s (2012) social cognitive theory asserts that individuals with higher SE are more confident in their ability to manage new technologies, perceive fewer obstacles and identify more benefits, which elevates their evaluation of value. In SF settings, SE has been associated with enhanced performance, creativity and employee engagement, enabling workers to see new opportunities rather than barriers (Hahm, 2018; Masril et al., 2021; Stofberg et al., 2021). At the same time, recent scholarship warns that digital SE may produce both positive and negative outcomes: while it strengthens creativity and engagement, it may also blur the boundaries between personal and professional life, potentially leading to burnout (Chatterjee et al., 2023). Thus, in this study, SE is conceptualized specifically as employees’ belief in their creative capacity to leverage SF technologies, which is expected to improve PV evaluations. Accordingly:
Self-efficacy has a significant influence on perceived value.
2.4 Intention to adopt smart factory
In line with the SVAM, the ultimate outcome of the adoption process is the ITA SF technologies. Intention reflects a user’s motivational readiness to embrace and continue using a technology in light of evolving functions, benefits and technological integrations. Prior research emphasizes that adoption is not a one-off event but rather a continuous process, whereby individuals and organizations repeatedly evaluate new features, such as artificial intelligence, big data analytics or cross-system integration into areas like marketing and financial performance (Chatterjee and Rana, 2023; Al-Shuridah and Ndubisi, 2023; Khoa, 2023). This underscores the assumption in SVAM that adoption is shaped by ongoing value assessments rather than static choices.
A central factor influencing intention is SE. SVAM assumes that individuals who are confident in their technological capabilities are more likely to persist through transitional challenges and perceive opportunities rather than barriers. Empirical results, however, are mixed. Some studies affirm that SE has a direct, positive effect on adoption intention (Zhu et al., 2022), while others find insignificant or context-dependent effects (Han et al., 2021; Shin, 2009). In SF environments, Jung et al. (2023) argue that managerial support alone is insufficient; successful adoption occurs when employees leverage their SE to engage creatively and design context-specific solutions. This suggests that SE plays a direct motivational role, energizing intention beyond its indirect effect through PV. Accordingly, we propose:
Self-efficacy has a significant influence on the intention to adopt smart factory.
Another critical determinant of intention is DT. Trust reduces uncertainty, allowing individuals to rely on machines, algorithms and digital processes with confidence. In SVAM’s logic, DT is theorized to influence adoption both indirectly through PV and directly as a risk-reduction mechanism. The evidence on this relationship is divided. Some studies in cybersecurity contexts report a non-significant link between DT and intention (Apau and Koranteng, 2019; Sujood et al., 2024), while research in other domains, such as virtual reality (Yuen, Koh, et al., 2023), blockchain (Liu et al., 2023) and IoT (Koohang et al., 2022) consistently demonstrates a positive effect. These inconsistencies point to the importance of testing DT in SF adoption, where reliance on machine-driven decision-making is particularly high. Thus, we propose:
Digital trust has a significant influence on the intention to adopt smart factory.
Finally, the role of PV as the most proximal predictor of intention is well established in adoption research. SVAM assumes that when individuals evaluate that the benefits of using a technology outweigh the costs, their ITA strengthens. Sartono et al.,(2024) demonstrate that PV directly determines adoption decisions, while Mayer (1995) and Falkenreck et al. (2023) emphasize that high levels of trust and digital capability further reinforce this evaluation. In SF adoption, PV captures not only efficiency and financial gains but also the innovation potential and organizational benefits perceived by employees. As such, PV is expected to exert a strong, positive influence on intention. Therefore:
Perceived value has a significant influence on the intention to adopt smart factory.
2.5 Gender as a moderator variable
While SVAM emphasizes SE and DT as central determinants of adoption, prior research indicates that these relationships may not hold uniformly across all individuals. Gender has been repeatedly identified as an important boundary condition in technology adoption, reflecting systematic differences in how men and women evaluate risk, trust and capability. For instance, Faqih (2016) finds that SE does not always directly influence ITA, yet the relationship becomes significant when gender differences are taken into account. This suggests that men and women draw on different psychological cues when forming adoption intentions.
The literature offers several explanations for these differences. Women are often more deliberate in reflecting on their self-development and capability growth, particularly in digital contexts (Pelegrini and Moraes, 2022). In the workplace, gender inclusivity and equal rights in compensation and responsibilities strengthen women’s ability to contribute to digital transformation initiatives (Shehadeh et al., 2024). Moreover, organizational practices that emphasize diversity in recruitment, promotion and mentoring increase women’s engagement and leadership in technology-driven change (Chang and Milkman, 2020). In this way, gender diversity does not merely represent fairness but also acts as a driver of innovation and organizational adaptability in the adoption of SF.
Differences in trust formation are also particularly relevant. Prior studies suggest that women tend to be more sensitive to customization and security features when evaluating new technologies and these evaluations often amplify the role of DT in shaping adoption intention (Shao et al., 2019). In contrast, men may be more strongly influenced by performance-related expectations. This implies that DT, as a confidence-building mechanism, plays a disproportionately stronger role for women in motivating adoption decisions.
Taken together, these findings highlight gender as a crucial moderator in the SVAM framework. Gender is expected to condition the effects of SE and DT on intention, such that women may rely more heavily on trust and SE to form adoption decisions, while men may place greater weight on technological performance. Hence, this study proposes the following hypotheses:
Self-efficacy has a significant influence on the intention to adopt smart factory, moderated by gender.
Digital trust has a significant influence on the intention to adopt smart factory, moderated by gender.
Based on the discussion above and empirical experience, the conceptual model can be illustrated in Figure 1 as follows:
 The diagram shows the S V A M framework. A grouped construct labelled Digital Trust includes Trust, I o T, and Smart Factory. Trust links to Perceived Value through H 1 a. I o T links to Perceived Value through H 1 b. Smart Factory links to Perceived Value through H 1 c. Self Efficacy links to Perceived Value through H 2. Self Efficacy also links directly to Intention To Adopt Smart Factory through H 3. Digital Trust links directly to Intention To Adopt Smart Factory through H 4. Perceived Value links to Intention To Adopt Smart Factory through H 5. Gender acts as a moderator. Gender moderates the relationship between Digital Trust and Intention To Adopt Smart Factory through H 6 a. Gender also moderates the relationship between Self efficacy and Intention To Adopt Smart Factory through H 6 b. No direct path runs from Gender to Intention To Adopt Smart Factory.
Conceptual model
Source: Authors’ construct
The diagram shows the S V A M framework. A grouped construct labelled Digital Trust includes Trust, I o T, and Smart Factory. Trust links to Perceived Value through H 1 a. I o T links to Perceived Value through H 1 b. Smart Factory links to Perceived Value through H 1 c. Self Efficacy links to Perceived Value through H 2. Self Efficacy also links directly to Intention To Adopt Smart Factory through H 3. Digital Trust links directly to Intention To Adopt Smart Factory through H 4. Perceived Value links to Intention To Adopt Smart Factory through H 5. Gender acts as a moderator. Gender moderates the relationship between Digital Trust and Intention To Adopt Smart Factory through H 6 a. Gender also moderates the relationship between Self efficacy and Intention To Adopt Smart Factory through H 6 b. No direct path runs from Gender to Intention To Adopt Smart Factory.Conceptual model
Source: Authors’ construct
3. Research method
This study used an explanatory quantitative approach to examine the causal relationships between variables. Data were collected using structured questionnaires distributed via Google Forms. The data were analyzed using structural equation modeling (SEM) with SmartPLS 3.2.4 (Ringle et al., 2014). SEM was chosen because it allows testing of complex relationships among latent constructs and mediators, making it suitable for analyzing the interactions between DT, SE, PV and SF adoption.
3.1 Population and sample
The population consisted of 356 employees working in companies that have implemented SF practices since the era of transparent factories in the early 2000s. These companies were recognized as lighthouse factories for Industry 4.0 since 2019, reflecting best practices in SF adoption in Indonesia (Folgado et al., 2024). They operate using the IIoT platform EcoStruxure, which enables vertical and horizontal integration of SF equipment, overcoming information silos (Shi et al., 2020).
Following Slovin’s formula with a 5% margin of error, the minimum sample size was calculated at 189 employees. A systematic random sampling technique was applied: a sampling frame of employees was obtained from company HR records and every kth employee was selected until the required sample size was achieved. This procedure ensured that each individual had an equal chance of being selected, thus reducing selection bias. The study was conducted over three months in early 2024, with one month for survey distribution and two months for data cleaning and analysis.
3.2 Questionnaire development and variable measures
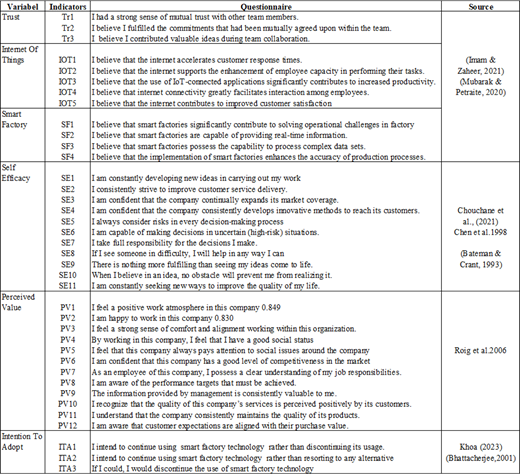
The questionnaire was developed based on established measurement frameworks to ensure validity and reliability. DT was measured using items adapted from Mubarak and Petraite (2020), capturing trust in individuals, data, processes and machines. PV was measured according to Roig et al. (2006), including emotional, social, professional and quality dimensions. SE was measured using the scale from Chouchane et al. (2021), which evaluates employees’ confidence in using SF technologies. IoT and SF constructs were measured following Mubarak and Petraite (2020) and the three-level pyramid framework by Martinez et al. (2021) and Conway (2016). Adoption intention (AI) was measured using items from Khoa (2023). Gender was included as a moderating variable, justified by previous findings that gender diversity influences digital adoption behavior (Pelegrini and Moraes, 2022; Shehadeh et al., 2024). In this study, gender was operationalized as a binary variable, where male was coded as 1 and female as 0.
To reduce response bias, data collection was conducted anonymously and participation was voluntary. Additional steps included randomizing the order of questionnaire items and incorporating reverse-coded questions to detect careless or patterned responses. The full list of questionnaire items used in this study is provided in Appendix.
3.3 Data analysis
The collected data were analyzed using PLS-SEM, which is particularly suitable for studies with complex models and smaller sample sizes. PLS-SEM allows simultaneous assessment of both measurement models (validity and reliability of constructs) and structural models (hypothesized relationships). Descriptive statistics were used to profile the respondents, including age, gender, education, job position and years of experience, to provide context for interpreting the findings. Demographic characteristics were also examined to explore potential implications for adoption behavior.
Reliability was tested using Cronbach’s alpha (CA) and composite reliability (CR), while convergent validity was assessed using average variance extracted (AVE). Discriminant validity was examined using the Heterotrait-Monotrait (HTMT) ratio. The structural model was evaluated using path coefficients, t-statistics, confidence intervals and R2 values to determine explanatory power. Effect sizes (f2) and predictive relevance (Q2) were also reported to ensure robustness of the findings.
4. Results
4.1 Respondents’ profile and characteristics
Out of the 200 questionnaires distributed, 189 valid responses were completed by respondents. Respondent demographic data can be seen in Table 1 below.
Respondent demographic
| Respondent characteristics | Frequency | % | |
|---|---|---|---|
| Age | 24–33 years | 37 | 19.58 |
| 34–43 years | 66 | 34.92 | |
| 44–53 years | 71 | 37.57 | |
| 54–63 years | 15 | 7.94 | |
| Gender | Male | 132 | 69.84 |
| Female | 57 | 30.16 | |
| Working period | 1–6 years | 15 | 7.94 |
| 7–12 years | 36 | 19.05 | |
| 13–18 years | 73 | 38.62 | |
| 19–24 years | 47 | 24.87 | |
| 25–30 years | 18 | 9.52 | |
| Position | People manager | 22 | 11.64 |
| Manager | 62 | 32.80 | |
| Supervisor | 23 | 12.17 | |
| Staff | 82 | 43.39 | |
| Education | High school | 11 | 5.82 |
| Bachelor’s degree | 164 | 86.77 | |
| Master’s degree | 14 | 7.41 | |
| Application used | CRM | 92 | 48.68 |
| SAP | 60 | 31.75 | |
| Others | 37 | 19.58 | |
The majority of the respondents were male (69.84%), while 30.16% were female. Although this gender imbalance may seem to introduce potential bias, it is important to note that such a distribution is consistent with common industry practices, particularly in sectors like manufacturing and technology, where male representation in management roles tends to be higher. In fact, numerous companies, including Schneider Electric, have set ambitious diversity targets, yet gender imbalance remains prevalent, especially at executive and management levels. Moreover, previous research in similar contexts has shown that gender distribution does not necessarily require a 50%–50% balance to draw meaningful conclusions. The focus of this study was on the impact of DT and SE on SF adoption, factors that are largely independent of gender. Thus, while gender representation is acknowledged, it is unlikely to significantly affect the validity of the study’s findings, as the key drivers of adoption lie in broader organizational and technological factors.
Next, the largest age group in the valid sample was 44–53 years, comprising 37.57% of respondents. Regarding work experience, most respondents had worked for 13–18 years, representing 38.62% of the sample. Additionally, descriptive statistics reveal that the most common education level among respondents was a bachelor’s degree (86.77%) and the majority held managerial positions (56.61%). Among the managerial positions, 11.64% were people managers (managers with direct reports), while 88.36% held roles as staff supervisors or managers without direct reports. The statistical data suggests that level 3 of the SF pyramid is primarily represented by people managers. This position is commonly referred to by titles such as director and business vice president.
4.2 Measurement model analysis
The measurement model, as shown in Table 2, includes the variables of DT, trust, IoT, SF, SE, PV and ITA, all of which are structured reflectively. Four key analyses were conducted to assess the reflective model: evaluating indicators with strong and significant factor loadings and using CA, CR and AVE to assess the model’s reliability and validity (Patalay et al., 2015; Hair et al., 2011; Iqbal et al., 2021).
Measurement model
| Variable | Indicators | Loadings | CA | CR | rho_A | AVE |
|---|---|---|---|---|---|---|
| DT | Tr1 | 0.710 | 0.903 | 0.919 | 0.909 | 0.690 |
| Tr2 | 0.763 | |||||
| Tr3 | 0.743 | |||||
| IOT1 | 0.789 | |||||
| IOT2 | 0.707 | |||||
| IOT3 | 0.717 | |||||
| IOT4 | 0.778 | |||||
| IOT5 | 0.762 | |||||
| SF1 | 0.773 | |||||
| SF2 | 0.808 | |||||
| SF3 | 0.781 | |||||
| SF4 | 0.814 | |||||
| Tr | Tr1 | 0.867 | 0.779 | 0.872 | 0.779 | 0.694 |
| Tr2 | 0.834 | |||||
| Tr3 | 0.796 | |||||
| IOT | IOT1 | 0.848 | 0.844 | 0.889 | 0.846 | 0.616 |
| IOT2 | 0.791 | |||||
| IOT3 | 0.778 | |||||
| IOT4 | 0.754 | |||||
| IOT5 | 0.749 | |||||
| SF | SF1 | 0.892 | 0.898 | 0.929 | 0.899 | 0.766 |
| SF2 | 0.885 | |||||
| SF3 | 0.863 | |||||
| SF4 | 0.861 | |||||
| SE | SE1 | 0.784 | 0.845 | 0.877 | 0.859 | 0.699 |
| SE2 | 0.770 | |||||
| SE3 | 0.795 | |||||
| SE4 | 0.709 | |||||
| SE5 | 0.760 | |||||
| SE6 | 0.743 | |||||
| SE7 | 0.778 | |||||
| SE8 | 0.732 | |||||
| SE9 | 0.798 | |||||
| SE10 | 0.798 | |||||
| SE11 | 0.798 | |||||
| PV | PV1 | 0.783 | 0.942 | 0.949 | 0.944 | 0.610 |
| PV2 | 0.838 | |||||
| PV3 | 0.828 | |||||
| PV4 | 0.798 | |||||
| PV5 | 0.773 | |||||
| PV6 | 0.778 | |||||
| PV7 | 0.730 | |||||
| PV8 | 0.751 | |||||
| PV9 | 0.802 | |||||
| PV10 | 0.854 | |||||
| PV11 | 0.798 | |||||
| PV12 | 0.727 | |||||
| ITA | ITA1 | 0.952 | 0.791 | 0.814 | 0.919 | 0.627 |
| ITA2 | 0.932 | |||||
| ITA3 | 0.728 |
To assess reliability, CA and CR were used. The results for CA and CR are displayed in Table 2 for DT (0.903, 0.919), trust (0.779, 0.872), IoT (0.844, 0.889), SF (0.898, 0.929), SE (0.845, 0.877), PV (0.942, 0.949) and ITA (0.791, 0.814). All these values exceed the 0.70 benchmark, indicating acceptable reliability for further analysis (Hair et al., 2011). Convergent validity was also examined using AVE values, with DT (0.690), trust (0.694), IoT (0.616), SF (0.766), SE (0.699), PV (0.610) and ITA (0.627), all surpassing the recommended threshold of 0.50 (Henseler et al., 2016). Discriminant validity was further tested using the HTMT criterion, as shown in Table 3.
HTMT ratio
| Variable | DT | Gender | ITA | IoT | PV | SE | SF |
|---|---|---|---|---|---|---|---|
| DT | |||||||
| Gender | 0.050 | ||||||
| ITA | 0.682 | 0.157 | |||||
| IoT | 0.771 | 0.035 | 0.615 | ||||
| PV | 0.714 | 0.113 | 0.654 | 0.491 | |||
| SE | 0.788 | 0.078 | 0.638 | 0.559 | 0.801 | ||
| SF | 0.787 | 0.039 | 0.616 | 0.685 | 0.683 | 0.745 | |
| Tr | 0.715 | 0.065 | 0.524 | 0.53 | 0.741 | 0.804 | 0.76 |
The HTMT ratio of correlations was used to confirm the model’s discriminant validity. As presented in Table 3, all values were below the threshold of 0.90, which indicates that the respondents were able to distinguish between the seven constructs, thereby confirming the discriminant validity of the model.
4.3 Structural model
Following the assessment of the outer model’s reliability and validity, the focus shifts to analyzing the structural model. Hypothesis testing results are outlined in Table 4 and illustrated in Figure 2 below.
Results for path analysis
| Relationship | β | t-values | 95% CI (LL-UK) | p-values | Decision | R2 | f2 | Q2 | VIF |
|---|---|---|---|---|---|---|---|---|---|
| H1a: Tr → PV | 0.218 | 2.61 | 0.056–0.370 | 0.009 | Accepted | 0.591 | 0.286 | 0.354 | 1.983 |
| H1b: IoT → PV | 0.016 | 0.25 | −0.091−0.127 | 0.799 | Rejected | 0.190 | 1.604 | ||
| H1c:SF → PV | 0.184 | 2.32 | 0.032–0.331 | 0.020 | Accepted | 0.135 | 2.396 | ||
| H2:SE → PV | 0.456 | 5.12 | 0.273–0.605 | 0.000 | Accepted | 0.243 | 2.092 | ||
| H3:SE → ITA | 0.102 | 0.95 | −0.118–0.303 | 0.341 | Rejected | 0.475 | 0.198 | 0.265 | 2.621 |
| H4:DT → ITA | 0.314 | 2.97 | 0.102–0.472 | 0.003 | Accepted | 0.186 | 2.181 | ||
| H5:PV → ITA | 0.338 | 4.22 | 0.172–0.502 | 0.000 | Accepted | 0.189 | 2.450 | ||
| H6a: DT*Gender → ITA | 0.039 | 0.41 | −0.101–0.186 | 0.684 | Rejected | ||||
| H6b: SE*Gender → ITA | 0.054 | 0.57 | −0.092–0.201 | 0.570 | Rejected |
 The diagram shows relationships among Trust, I o T, Smart Factory, Digital Trust, Perceived Value, Self Efficacy, Gender, and Intention to Adopt. Trust has a path to Digital Trust with a coefficient of 0.767. I o T has a path to Digital Trust with a coefficient of 0.832. Smart Factory has a path to Digital Trust with a coefficient of 0.908. Trust is connected to T 1, T 2, and T 3. I o T is connected to I O T 1, I O T 2, I O T 3, I O T 4, and I O T 5. Smart Factory is connected to S F 1, S F 2, S F 3, and S F 4. Trust has a path to Perceived Value with a coefficient of 0.218. I o T has a path to Perceived Value with a coefficient of 0.016. Smart Factory has a path to Perceived Value with a coefficient of 0.184. Self Efficacy has a path to Perceived Value with a coefficient of 0.456. Perceived Value has a path to Intention to Adopt with a coefficient of 0.338. Self Efficacy has a path to Intention to Adopt with a coefficient of 0.102. Digital Trust has a path to Intention to Adopt with a coefficient of 0.314. Gender has a path to Intention to Adopt with a coefficient of negative 0.083. Two separate moderating effects are shown pointing to Intention to Adopt. One moderating effect has a coefficient of 0.039. The other moderating effect has a coefficient of 0.054.
PLS algorithm results
Source: Processed by authors (2024)
The diagram shows relationships among Trust, I o T, Smart Factory, Digital Trust, Perceived Value, Self Efficacy, Gender, and Intention to Adopt. Trust has a path to Digital Trust with a coefficient of 0.767. I o T has a path to Digital Trust with a coefficient of 0.832. Smart Factory has a path to Digital Trust with a coefficient of 0.908. Trust is connected to T 1, T 2, and T 3. I o T is connected to I O T 1, I O T 2, I O T 3, I O T 4, and I O T 5. Smart Factory is connected to S F 1, S F 2, S F 3, and S F 4. Trust has a path to Perceived Value with a coefficient of 0.218. I o T has a path to Perceived Value with a coefficient of 0.016. Smart Factory has a path to Perceived Value with a coefficient of 0.184. Self Efficacy has a path to Perceived Value with a coefficient of 0.456. Perceived Value has a path to Intention to Adopt with a coefficient of 0.338. Self Efficacy has a path to Intention to Adopt with a coefficient of 0.102. Digital Trust has a path to Intention to Adopt with a coefficient of 0.314. Gender has a path to Intention to Adopt with a coefficient of negative 0.083. Two separate moderating effects are shown pointing to Intention to Adopt. One moderating effect has a coefficient of 0.039. The other moderating effect has a coefficient of 0.054.PLS algorithm results
Source: Processed by authors (2024)
The results from Table 4 provide insights into the relationships between DT, IoT, SF, SE, PV and ITA, evaluated using the structural model. The R2 values for PV and ITA are 0.591 and 0.475, respectively. Based on Sarstedt et al. (2017), R2 values of 0.75, 0.50 and 0.25 represent strong, moderate and weak explanatory power. Therefore, the R2 for PV indicates moderate explanatory power, while the R2 for ITA also falls in the moderate category. This suggests that the predictors explain a substantial portion of the variance in these constructs.
Next, the effect size (f2) was calculated to determine the impact of individual predictors on PV and ITA. According to Hair et al. (2019), f2 values of 0.02, 0.15 and 0.35 indicate small, medium and large effects, respectively. From the table, SE has a medium effect size on PV (f2 = 0.243), while DT and PV have medium effects on ITA (f2 = 0.186 and 0.189, respectively). Other relationships, such as SF on PV, show a small effect size (f2 = 0.135), indicating a more limited impact. Meanwhile, IoT has an insignificant effect on PV (f2 = 0.190).
The predictive relevance (Q2) values were also assessed, as proposed by Henseler et al. (2009). The model demonstrates predictive relevance if the Q2 value exceeds zero. The Q2 for PV is 0.354 and for ITA, it is 0.265, indicating that both constructs have moderate predictive relevance.
Finally, the hypothesis testing results reveal that several relationships are significant while others are not. Specifically, trust significantly affects PV (β = 0.218, p = 0.009), supporting the hypothesis. The t-values of 2.61 and 95% CI [0.056, 0.370] confirm that the effect of trust on PV is statistically robust. Similarly, SE significantly impacts PV (β = 0.456, p < 0.001), confirming this relationship. With a t-values of 5.12 and 95% CI [0.273, 0.605], the results show strong support for the mediating role of PV in connecting SE to adoption intention. DT also significantly influences ITA (β = 0.314, p = 0.003), confirming the hypothesized path. The bootstrapping results (t = 2.97, 95% CI [0.102, 0.472]) provide evidence that DT is a key determinant in shaping adoption intention. Additionally, PV has a significant positive effect on ITA (β = 0.338, p < 0.001). This is supported by a t-values of 4.22 and 95% CI [0.172, 0.502], indicating that PV is a consistent predictor of adoption intention.
However, some hypotheses were rejected. For example, IoT does not significantly affect PV (β = 0.016, p = 0.799) and SE does not significantly impact ITA (β = 0.102, p = 0.341). The very low t-values (0.25 for IoT → PV and 0.95 for SE → ITA) and wide confidence intervals crossing zero confirm that these relationships are not supported. Furthermore, the moderating effects of gender on the relationships between DT and ITA (H6a) and SE and ITA (H6b) were also found to be insignificant. Both paths produced low t-values (<1.0) and confidence intervals that included zero, reinforcing the conclusion that gender does not moderate these relationships.
5. Discussion
The SF, often equated with the IIoT, represents one of the most transformative paradigms in contemporary manufacturing. Although frequently linked with Industry 4.0, scholars such as Sommer (2024) underscore the importance of distinguishing between the two to avoid conceptual conflation. Industry 4.0 serves as the overarching socio-technical revolution, while SF reflect a practical and modular implementation of its principles. Global technology providers, including Siemens, Schneider Electric and General Electric (Folgado et al., 2024) have demonstrated how SF adoption is not only a technological innovation but also a pathway to sustainability, aligning directly with the objectives of the United Nations’ SDG 12 on responsible consumption and production. The dual emphasis on operational excellence and environmental stewardship situates SF adoption as both a corporate strategy and a societal necessity.
The architecture of SF can be understood through a three-level framework. At level one, connected products operate on the shop floor, forming the foundation of digital integration. Level two or the control level, consolidates production at a single site (Hajdini et al., 2024; Reis et al., 2021), while level three integrates analytics, supervision and decision-making across multiple factories (Hung et al., 2019). This multi-tiered structure illustrates not only the technical but also the behavioral complexity of SF adoption. A behavioral information systems perspective emphasizes that adoption is not solely determined by technical feasibility but also by the behavioral adaptation of employees at different organizational strata. Ergonomic considerations (Reiman et al., 2024), employees’ perceptions of technological value (Matošková et al., 2023) and the cultivation of SE all shape the pace and success of adoption.
5.1 How DT enhances the success of SF adoption through the application of SVAM theory
From a theoretical standpoint, this study explores how digital transformation influences the success of SF adoption, especially through the application of the SVAM. The relationship between DT and SF adoption is not just about technological integration but also about fostering employee readiness and engagement with the new systems. Unlike traditional models that focus primarily on technological acceptance, SVAM expands the lens by integrating SE and PV, capturing both psychological and strategic dimensions of adoption. The application of SVAM theory in this context offers a more comprehensive understanding of how employees’ belief in their abilities to use technology (SE) influences their acceptance of SF technologies. Furthermore, DT contributes to the adoption process by enhancing SE through providing employees with the tools, training and confidence to adopt these technologies effectively. This approach shifts the focus from purely technological implementation to a more holistic, employee-centric transformation, aligning with the sustainability goals embedded in SDG 12.
At the shop floor level, which receives the bulk of manufacturing investment, employees play a decisive role in whether SCPs are integrated effectively. The convergence of physical and digital systems through SCPs (Xie et al., 2022; Javaid et al., 2023) requires a skilled and motivated workforce capable of bridging traditional manufacturing processes with new digital systems. The findings of this study reinforce prior work (Bouras et al., 2023; Monios et al., 2024; Martinez et al., 2021) that categorizes SF into physical and virtual spaces. Yet the critical insight emerging from this analysis is that adoption at this level hinges on employee readiness, highlighting the salience of technology adoption theories such as the TAM, UTAUT and their extensions that incorporate constructs like PV and perceived risk. In this study, PV mediates the relationship between digital technology and adoption intention, underscoring its centrality in the adoption process.
5.2 The direct impact of DT and SE on SF adoption
The direct impact of DT and SE on SF adoption is evident in the way these factors influence employees’ willingness to engage with new technologies. This study confirms that DT and SE play crucial roles in enhancing adoption intentions. As expected, the analysis shows a significant positive relationship between DT, SE and the ITA SF, particularly through PV. In this context, DT is essential in building employees’ trust in the technology and the systems they are being asked to use, while SE enables them to feel confident in their ability to interact with these technologies. and were tested and confirmed to indicate that higher levels of SE and DT increase the likelihood of adopting SF, as these factors help reduce perceived risks and uncertainties associated with new technologies. While the study acknowledges the importance of these factors, further exploration into how they interact with other organizational dynamics, such as management and strategic alignment, would enrich the theoretical understanding of SF adoption.
From a theoretical standpoint, this finding enriches adoption models by embedding SE as a mediating factor that shapes how employees interpret and act upon PV. SE, as theorized by Bandura (2012), functions as a personal resource that enables individuals to manage uncertainty, overcome resistance and engage proactively with new technologies. Employees with strong SE are more willing to experiment with novel practices, test innovative ideas on the production floor and adapt to changing workflows. This dynamic is consistent with Zhu et al. (2017, 2022), who describe pre-adoption as a critical stage in which employees rely on PV to make sense of emerging technologies before converting intentions into sustained behaviors. The integration of SE into adoption models thus represents a significant theoretical contribution, extending frameworks like SVAM to capture the psychological underpinnings of adoption behavior.
5.3 How perceptions of trust, IoT and SF influence perceptions of DT
The influence of trust, IoT and SF technologies on employees’ perceptions of DT is an important aspect of this study. It is essential to understand how the integration of IoT and SF technologies shapes the trust that employees place in the technology and, consequently, how this affects their willingness to adopt new systems. While IoT is often seen as a fundamental enabler of SF, its role in driving PV is less significant than expected in this study. This finding aligns with research by Nazron et al. (2023), which suggests that IoT is increasingly viewed as a utility, rather than a unique value proposition. As IoT becomes normalized within manufacturing processes, its influence on DT may diminish, especially if employees do not perceive it as providing additional value beyond basic functionality. However, the broader SF ecosystem, particularly the integration of IoT and digital systems, continues to impact DT positively by enabling data-driven decision-making and increasing operational transparency. These factors, in turn, enhance employee trust in the technology and its potential benefits, aligning with previous research on the importance of trust in technology adoption (Tsai et al., 2010). The integration of IoT and SF technologies, while critical to operational efficiency, should be communicated effectively to employees to build trust in both the technology and the organizational processes it supports.
The human dimension of adoption extends beyond technical competence to include organizational culture, leadership style and diversity. While the moderating role of gender in this study was insignificant, the broader literature suggests that inclusive leadership and diverse teams enhance problem-solving and innovation capacity (Gupta, 2024; Shehadeh et al., 2024). Corporate Knight’s sustainability rankings further highlight gender diversity as a metric of organizational responsibility. Thus, while gender itself may not directly determine adoption intention, cultivating inclusivity may contribute indirectly to building resilient and adaptive digital organizations capable of sustaining technological change. This insight links SF adoption not only to theories of technology acceptance and SE but also to organizational theories that emphasize the role of culture and diversity in shaping innovation trajectories.
The managerial implications of these findings are substantial. First, managers must recognize that technology adoption is not a linear technical exercise but a socio-technical transformation requiring continuous communication, trust-building and skill development. Second, investment strategies should be explicitly tied to sustainability outcomes, framing SF adoption as a means to achieve both financial and environmental returns. Third, managers must integrate adoption initiatives into broader corporate governance and strategy frameworks, ensuring that sustainability metrics such as energy efficiency, emissions reduction and waste minimization are embedded into performance evaluations. By doing so, firms not only improve operational efficiency but also demonstrate accountability to stakeholders and contribute directly to global sustainability targets.
From a theoretical perspective, this study advances the literature in three ways. First, it extends adoption models by integrating SE as a mediator that shapes the relationship between PV and adoption intention, providing a psychological lens on adoption behavior. Second, it reinforces the importance of distinguishing managerial and employee perspectives, demonstrating that value alignment is a critical determinant of adoption success. Third, it situates SF adoption within the sustainability discourse, highlighting its potential to advance SDG 12 and thereby linking technology adoption research with broader debates in sustainable development and corporate responsibility. These contributions enrich both the behavioral information systems literature and the sustainability management literature, bridging a gap that is often overlooked in studies focusing exclusively on either technical or environmental dimensions.
In summary, the transition from traditional factories to SF represents a complex interplay between technology, human behavior and sustainability imperatives. This study highlights that successful adoption requires more than the deployment of SCPs and IoT systems; it demands behavioral adaptation, SE cultivation and managerial practices that align value propositions across organizational levels. By situating these dynamics within the framework of SDG 12, the research underscores that SF adoption is not only a technological imperative but also a societal responsibility. The findings provide theoretical insights into the psychology of adoption, practical guidance for managers navigating digital transformation and evidence of how manufacturing innovation can contribute to global sustainability goals.
From a sustainability perspective, the findings reinforce the role of PV and DT as critical behavioral mechanisms through which SF adoption contributes to SDG 12. The insignificance of IoT as a direct driver of PV suggests that technological infrastructure alone is insufficient to achieve responsible production outcomes. Instead, sustainability benefits materialize when employees trust the systems and perceive clear value in using SF technologies to improve efficiency, reduce waste and optimize resource consumption.
These results imply that organizations pursuing SDG 12 should shift their focus from technology-centric investments toward human-centered digital transformation strategies. By strengthening DT and SE, firms can ensure that SF technologies are actively used, thereby transforming digital capabilities into measurable sustainability performance.
6. Conclusion
DT plays a critical role as a primary determinant in the VAM theory, influencing the successful adoption of SF. Trust must be perceived by all employees within an organization and can be formalized through annual updates to certifications or the implementation of a Trust Charter applicable to all employees and their ecosystem. A workforce embedded in a mature technological environment, where internet connectivity is regarded as a fundamental necessity, is essential for the effective transition toward SF.
The SF pyramid distinguishes between management and employees, necessitating a mutually supportive collaboration. While technological performance is primarily determined by employees, the competencies of management do not require firsthand experience of the employees’ tasks. Specifically, for level 3 positions, it is not necessary to have previously held a level 1 position. Any gaps that arise can be addressed by maximizing training, ensuring comprehensive certifications for specific roles and optimizing the middle office function. The middle office, which maintains the technical core of the back office while also possessing front office expertise grounded in customer knowledge, serves as a bridge between the two areas. The influence of gender requirements and moderation on the success of adoption was found to be insignificant in this study.
From a theoretical standpoint, this study contributes to the literature on technology adoption by reinforcing the role of DT and SE in shaping adoption intentions within the SVAM framework. Additionally, this study contributes to the growing body of literature linking SF adoption to sustainability imperatives under SDG 12, particularly focusing on responsible consumption and production. By integrating psychological factors such as SE and DT, this research extends current adoption models to provide a more nuanced understanding of the adoption process, moving beyond purely technical or financial factors to include human-centered variables.
From a practical perspective, the findings of this study highlight several key actions for practitioners and organizations seeking to facilitate SF adoption. First, managers should align value perceptions between employees and organizational leadership by investing in trust-building mechanisms and reskilling initiatives. This includes fostering a culture of continuous learning and technological integration. Additionally, companies should focus on creating a collaborative environment where employees feel confident in adopting new technologies through the development of DT and ensuring SE in navigating these changes. By providing adequate training and reskilling opportunities, organizations can bridge the gap between managerial aspirations and employee execution, enhancing the overall success of the SF adoption process.
Despite the significant contributions of this study, several limitations must be acknowledged. First, the study used a cross-sectional survey design, which limits causal inference and may be prone to common method bias. Longitudinal or mixed-method designs could provide richer insights into adoption dynamics over time. Second, the sample was concentrated in specific sectors and regions, which may limit the generalizability of the findings to other industries or geographic contexts where technological readiness, institutional pressures or cultural attitudes differ. Third, the majority of respondents were employees, with relatively fewer managers represented. This imbalance may understate managerial perspectives on adoption strategies. Additionally, the study did not include several potentially relevant variables, such as individual perceptions of blockchain, big data or cyber-physical systems, as suggested by Mubarak and Petraite (2020), which could provide deeper insights into the broader ecosystem of Industry 4.0 technologies. Another limitation was the gender imbalance in the sample, with a higher proportion of male respondents (69.84%) compared to female respondents (30.16%). This imbalance may limit the ability to fully assess gender-based moderating effects and future research could benefit from recruiting a more gender-balanced sample to ensure more representative findings. Finally, it should be acknowledged that the study did not include a direct SDG 12 (responsible consumption and production) variable, which could be an important factor in understanding the sustainable aspects of SF adoption. This omission suggests the inclusion of SDG 12 as a direction for future research.
Acknowledgements
The authors would like to express their sincere gratitude for the support and resources provided during the course of this research.
References
Further reading
Appendix. Questionnaire items
Source: Processed by authors (2024)

