


Drawing on configuration theory, this study examines how different combinations of business model (BM) design themes shape the financial performance of entrepreneurial firms that simultaneously adopt multiple business models. We thus depart from typical BM research that investigates design themes in isolation to focus on how configurations of design themes differentially influence the performance of firms that operate BM portfolios.
We employ fuzzy-set qualitative comparative analysis (fsQCA) to test whether specific configurations of BM design themes relate to high financial performance. fsQCA aligns well with the main objectives of this study because it captures equifinality and causal complexity, allowing for the empirical examination of multiple configurations that can lead to high performance. The final sample consists of 107 UK software firms characterized by rapid innovation adoption and frequent use of BM portfolios.
The results indicate three distinct configurations that relate to high financial performance: (1) novelty combined with the absence of customer lock-in and product/service complementarities; (2) novelty combined with efficiency and the absence of product/service complementarities; and (3) novelty combined with customer lock-in and product/service complementarities in the absence of efficiency. Across all these configurations, novelty clearly emerges as a core BM theme. Notably, we do not find a configuration in which all four BM design themes are present, suggesting that high performance relates with specific combinations rather than the cumulative presence of all themes.
This study contributes to BM literature by providing new theoretical arguments and evidence on how firms with BM portfolios can realize performance benefits. We therefore extend pertinent BM theory to the portfolio level and shift scholarly attention from optimizing individual BMs to understanding how design themes are configured across multiple BMs within the same firm.
Our findings show how software firms can combine different design themes in their BM portfolio to achieve high performance. The results suggest that performance benefits relate to specific combinations of novelty, efficiency, customer lock-in, and product/service complementarities. Although our findings are specific to the context of UK software companies, they provide managers with a practical guide on how to design their BM portfolios when pursuing high financial performance.
Despite the growing attention to the design of business models, our understanding of BM portfolios in entrepreneurial firms remains limited. This study advances this stream of literature by theorizing and empirically examining configurations of BM design themes (novelty, efficiency, customer lock-in and product/service complementarities) at the portfolio level. Based on configuration theory, it moves beyond analyzing individual design themes in isolation and contributes to a more nuanced understanding of how combinations of BM design themes are associated with high performance.
1. Introduction
Since the emergence of the business model (BM) concept, denoting a firm's set of activities to create and capture value from its market offerings (Teece, 2010), related scholarly work has gained significant traction within the fields of strategy and entrepreneurship (Snihur and Markman, 2023). A substantial part of this literature has focused on how different sets of activities–captured through BM design themes such as novelty, efficiency, product/service complementarities, and customer lock-in (Zott and Amit, 2007, 2010) - drive firm performance. Much of this work, however, has adopted a single-BM logic examining how particular design themes within a singular BM can trigger performance, better positioning or faster scale-up in a given ecosystem, and foster more effective access to and allocation of valuable resources held by partners or customers (e.g. Carrasco-Farré et al., 2022; Markman et al., 2021).
Though insightful, this research overlooks an increasingly common organizational reality: many firms now adopt multiple BMs simultaneously. Firms diversify their product and service portfolios to balance risks, reach new market segments, serve existing customers in new ways, or respond to environmental change (Lanzolla and Markides, 2021; Loon et al., 2020; Sohl et al., 2020). For example, a software provider may release its core software as open source while selling enterprise subscriptions, support services and hosted solutions, thereby combining activities characteristic of the Patron and Product Steward/Cloud Liberator BM types (for a similar approach, see Xenakis and Manolopoulos, 2026). Red Hat follows a similar approach: it builds a business around its open-source software while generating revenue through certified enterprise subscriptions and support services. Although these models revolve around the same core offering, they differ in their activity configurations, governance structures, and revenue logics, thereby constituting multiple and distinct BMs. We refer to such a set of coexisting BMs as a BM portfolio.
Despite this growing tendency of firms to employ multiple BMs, we still know very little about whether and how the design themes (i.e. novelty, efficiency, complementarities, and lock-in) embedded in the specific BMs that jointly compose a firm's portfolio reinforce (or compete with) each other at the firm level. While prior research explains how novelty, efficiency, product/service complementarities, or customer lock-in enhance performance within a single BM, it remains unclear whether combining differently themed BMs generates synergies or diminishing effects (Aversa et al., 2021; Burgelman et al., 2022; Snihur and Markman, 2023; Sohl et al., 2020). This question is particularly salient for entrepreneurial firms, which frequently supplement core products with related services to enhance value (Karatzas et al., 2025; Kim and Min, 2015) but lack strategic guidance on how to configure their BM portfolios effectively.
To address this void, we draw on configuration theory (Meyer et al., 1993) to develop and test theoretical arguments about how configurations of design themes across a firm's BM portfolio relate to its performance outcomes (high vs low). Configuration theory emphasizes that organizational outcomes arise from interdependent constellations of conditions rather than from the net effects of isolated variables. As such, we extend Amit and Zott's (2001) activity-system perspective from the single-BM level to the portfolio level and conceptualize novelty, efficiency, customer lock-in and product/service complementarities as design themes embedded within individual BMs that interact across coexisting activity systems within a firm. When combined within a BM portfolio, these themes may reinforce, offset, or reshape one another's performance implications. Accordingly, we shift attention from the performance consequences of singular business model designs to the systemic performance effects of combining multiple activity systems within an organization, examining how distinct cross-BM theme configurations relate to performance heterogeneity among multi-BM firms.
We test our predictions using fuzzy-set qualitative comparative analysis (fsQCA) on a sample of 107 UK software firms. Our empirical strategy unfolds in two stages. First, we identify firms that simultaneously operate multiple and distinct business models (a BM portfolio) within the same organizational boundary. Firms meeting this criterion form our analytical sample of multi-BM entrepreneurial firms. Second, we apply fsQCA to examine how different configurations of BM design themes (novelty, efficiency, product/service complementarities and customer lock-in) across a firm's BM portfolio relate to high versus low performance outcomes. This method addresses calls for greater use of configurational approaches in examining high- and low-performing BM configurations (e.g. Jiang et al., 2021; Täuscher, 2018). The software industry offers an appropriate empirical context, as prior research shows that software companies frequently operate BM portfolios by adopting multiple BMs simultaneously (e.g. Bonaccorsi et al., 2006; Valtakoski and Rönkkö, 2010).
This study contributes to the entrepreneurship literature on business models in two important ways. First, we extend emerging work on firms that operate multiple BMs in tandem (Lanzolla and Markides, 2021; Snihur et al., 2023) by shifting attention from individual BMs to the portfolio-level configuration of coexisting BMs. Despite some notable exceptions (e.g. Sohl et al., 2020, 2022), extant research still adopts a single BM perspective, largely ignoring the potential of multi-BM configurations. As organizations (and especially entrepreneurial firms) increasingly adopt a portfolio of BMs to manage risks and seize opportunities, key questions remain about how the design structure of a BM portfolio relates to firm performance. By conceptualizing and empirically examining BM portfolios as combinations of distinct yet interacting activity systems, our study provides systematic evidence on how portfolio-level design relates to performance heterogeneity among entrepreneurial firms.
Second, we advance related theory by applying a configurational lens to BM portfolios (Meyer et al., 1993). Whereas prior research on BM design themes has largely examined their performance implications within a single BM, we theorize and test how these themes combine across coexisting BMs within a firm. Rather than assuming additive or independent effects which may introduce bias because the focus is too narrow (Kulins et al., 2016), we identify distinct configurations of themes associated with high performance. Our findings identify three alternative configurations of BM design themes associated with high-performing portfolios. Across all high-performance configurations, novelty is present, but its association with high performance depends on how it combines with other themes. Specifically, high performance is linked to: (1) novelty combined with the absence of customer lock-in and product/service complementarities; (2) novelty combined with efficiency and the absence of product/service complementarities; and (3) novelty combined with customer lock-in and complementarities in the absence of efficiency. These results highlight that performance is not associated with the isolated presence of any single theme, but with specific configurations of design themes within the BM portfolio. These insights enrich theory on business model design and inform entrepreneurs and managers about how specific configurations of design themes within BM portfolios may relate to financial performance.
2. Background and hypotheses
A growing research stream conceptualizes BMs as systems of interdependent activities through which firms create, deliver and capture value (Teece, 2010). Within this systemic view, Amit and Zott (2001) pioneered a framework that explains value creation through four BM design themes: novelty, efficiency, lock-in, and complementarities. These themes refer to “configurations of design elements, or the degree to which they are orchestrated and connected by distinct themes” (Zott and Amit, 2010, p. 221). In particular, novelty refers to the introduction of new ways of performing transactions and generating revenue; efficiency denotes the decrease of transaction costs; lock-in reflects mechanisms that contribute to the retention of customers and business partners; and complementarities refer to value-creating synergies generated across products, services, or activities. Although this framework was originally developed in the context of e-business, and still remains particularly relevant for small and medium-sized IT companies, it has also been widely used and validated across different industrial settings including manufacturing enterprises, services firms, and technology-intensive ventures.
A substantial body of literature has thus examined how Amit and Zott's four-theme framework (2001) relates to firm performance, mostly showing that specific BM themes or combinations of BM themes within a single BM lead to high performance (e.g. Balboni et al., 2019; Kulins et al., 2016; Pati et al., 2018). Yet, research has largely examined these themes within a single focal BM, leaving their configurational role across BM portfolios underexplored. This issue is especially relevant in software firms, where modular technologies and multiple revenue logics make BM portfolios common.
We therefore build on configuration theory to argue that novelty may operate as a core theme within a high-performing BM portfolio of software firms. However, we do not treat novelty as exerting an independent net effect, but rather conceptualize it as a core part of a set of configurations of design themes that can relate to high financial performance in multi-BM firms. We further suggest that specific configurations of novelty and efficiency, as well as novelty and efficiency with customer lock-in and product/service complementarities, can generate synergies that foster high performance in a BM portfolio. In the following sections, we develop these arguments and propose a set of related hypotheses.
2.1 Novelty as a core theme of BM portfolio performance
Novelty of a BM refers to the introduction of new ways of creating and capturing value, including offering existing products and services in entirely new ways (Zott and Amit, 2002, 2007). This design theme emphasizes value creation, as it offers unique ways of addressing customer needs and exploring untapped market opportunities (Zott and Amit, 2008, 2010). Prior research has consistently associated novelty-centered BM designs with enhancing customer loyalty, establishing barriers to entry and imitation, strengthening a firm's bargaining power, and imposing customer switching costs (Amit and Zott, 2001; Balboni et al., 2019; Kulins et al., 2016; Zott and Amit, 2007, 2008). As such, BM novelty is regarded as a key performance driver, particularly in dynamic and innovation-intensive environments (Chesbrough, 2010; Zott and Amit, 2007, 2008), such as technology-intensive software firms.
In multi-BM firms, the role of novelty can be even more pronounced. From a knowledge-based perspective, firms that emphasize novelty in their BM design develop stronger innovation routines and capabilities that enable the effective recombination and redeployment of organizational knowledge (Grant, 1996; Kogut and Zander, 1992). Because multi-BM firms operate multiple, distinct value architectures simultaneously, the primary managerial challenge lies in coordinating and integrating these architectures rather than in pursuing isolated innovations. BM novelty reflects a firm's capability to redesign and reconfigure such architectures. In this sense, novelty represents not merely innovation intensity, but a design-oriented capability that is core for managing multi-BM complexity. These firms are therefore better positioned to transfer, recombine and redeploy organizational knowledge, and thereby replicate and adapt innovative designs within their portfolio. This ability to share and recombine knowledge and resources across organizational units has long been linked to enhanced innovation outcomes and high performance in multi-business settings (Galunic and Rodan, 1998; Govindarajan and Fisher, 1990; Karim and Kaul, 2015; Xiao et al., 2022).
Novelty-oriented BM design is also viewed as a prerequisite for reinforcing a firm's innovation-based reputation and differentiation advantages across its portfolio, as it offers opportunities to move beyond individual models and enhance the perceived value of the entire portfolio (Aaker, 1991; Hurley and Hult, 1998), thereby generating self-reinforcing “virtuous value loops” through cumulative brand effects (Aversa et al., 2021; Casadesus-Masanell and Ricart, 2010).
Finally, as novelty may also introduce uncertainty (Aspara et al., 2010; Foss and Saebi, 2017), in multi-BM firms, experimentation with novel BMs occurs within a broader portfolio structure. Drawing on diversification logic, operating multiple BMs may distribute financial and operational exposure across distinct revenue streams, thereby attenuating the risks associated with any single novel BM initiative (Amit and Livnat, 1988; Markides and Williamson, 1994). Taken together, we hypothesize that.
Novelty is a core theme of BM design in high-performing multi-BM firms.
2.2 The combination of novelty and efficiency for BM portfolio performance
BM efficiency involves reorganizing activities to lower transaction costs for multiple stakeholders (Amit and Zott, 2001; Zott and Amit, 2002). Such efficiency gains can be rooted, for instance, in the increased speed and ease of transactions (Zott and Amit, 2002). Some studies view novelty and efficiency as substitutes rather than complements, suggesting their combination may lead to diseconomies of scope and suboptimal resource allocations (Leppänen et al., 2023; Zott and Amit, 2007). However, a BM portfolio perspective broadens the design space available to firms, allowing for varying degrees of both themes to coexist and interact across different activity systems.
This configurational flexibility may expand the range of value-creation and value-capture mechanisms available to the firm. From an organizational learning perspective, pursuing both exploratory (novelty-oriented) and exploitative (efficiency-oriented) activities can help companies reduce overreliance on a single dominant logic of value delivery, enabling them to remain agile and adaptable to changing market conditions (Leonard-Barton, 1992; Levinthal and March, 1993). Furthermore, given the diversity of customer needs, combining novelty and efficiency in the BM portfolio may enable firms to expand their market reach, target distinct customer segments, and enhance value appropriation beyond the limits of a single dominant BM design theme (Zott and Amit, 2007).
Since novelty and efficiency generate different value implications, firms operating BM portfolios are better able to capture the value of each theme, ultimately shaping overall performance. To illustrate, efficiency-oriented configurations may provide cost and operational benefits that support value capture, while novelty-oriented configurations may introduce innovative transaction mechanisms and new revenue logics that enhance value creation (Kulins et al., 2016; Pati et al., 2018; Zott and Amit, 2007). In this regard, a BM portfolio perspective responds to debates in existing research about whether novelty and efficiency function as substitutes or complements by suggesting that these design themes can enhance each other's value-creation potential when combined in coherent configurations within the firm's portfolio of activities.
The strategic relationship between eBay and PayPal (formerly owned by eBay) offers an example of how novelty- and efficiency-oriented themes can be combined to yield distinct value benefits within a firm's portfolio of activities. While eBay's marketplace model introduced novel peer-to-peer exchange mechanisms, PayPal supported transactional efficiency through secure and standardized payment infrastructure. This clearly shows how novelty and efficiency may coexist within a multi-BM firm and, when coherently aligned, can lead to performance gains. Therefore, we predict.
Novelty and efficiency BM design themes are jointly related to high performance in multi-BM firms.
2.3 Quadratic configurations emphasizing all BM design themes
Extending H2a, we posit that the customer lock-in and product/service complementarities BM design themes may further enhance performance when combined with novelty and efficiency within a BM portfolio. Customer lock-in refers to the extent to which a BM incorporates mechanisms that make customers more likely to continue transacting with the firm, rather than switching to a competitor. For example, in software firms, customer lock-in may arise when clients rely on stored data, customized integrations, or subscription-based support services that make switching to another provider costly and time-consuming (Amit and Zott, 2001). Further, product/service complementarities refer to the bundling or integration of market offerings to create synergies and additional value (Zott and Amit, 2002). To illustrate, a software firm may increase product/service complementarities by offering its core software together with implementation services, training, and technical support, so that the combined offering creates greater value for customers than each component would generate independently.
These two design themes are often viewed as mutually reinforcing. Customer lock-in can create a stable user base that increases the attractiveness of products and services, while complementarity-oriented designs may broaden the firm's product ecosystem and deepen customer loyalty (Amit and Zott, 2001; Hou et al., 2020). For instance, when customers' needs are addressed through complementary products or services within a firm's ecosystem, transaction volumes may increase, potentially improving efficiency and value capture (Kulins et al., 2016). Similarly, firms that prioritize product/service complementarities can strengthen customer retention by increasing the costs associated with switching to competing offerings, thus reinforcing customer lock-in and overall efficiency (Amit and Zott, 2015; Bruni and Comacchio, 2023).
Based on a BM portfolio perspective, the combination of customer lock-in and product/service complementarities with novelty and efficiency may expand the space through which value is created and captured. Rather than assuming additive or deterministic effects, we suggest that BM configurations emphasizing all four design themes may associate with high performance when coherently aligned within the firm's portfolio of activities. Examples such as IBM's BM portfolio showcase how customer lock-in and product/service complementarities can coexist with novelty and efficiency. IBM's integration of Red Hat combines open-source innovation with proprietary infrastructure and service capabilities, thus embedding clients within a broader ecosystem of offerings while leveraging operational efficiencies. We therefore hypothesize that.
Customer lock-in and product/service complementarities, when combined with novelty- and efficiency-oriented BM design themes, are related to high performance in multi-BM firms.
3. Data and methods
3.1 Sampling
To test our hypotheses, we employed a sample of 1,000 UK entrepreneurial software firms with available senior executive e-mails, drawn from Bureau van Dijk's Orbis database. At this stage, the BM status of these firms (i.e. whether they operate a single or multiple BMs) was unknown. We targeted senior executives (i.e. C-suite, Directors, Chairpersons, Presidents, etc.) as key informants, because these individuals are perceived as the most reliable and well-informed sources of information regarding firms' strategic issues (Hambrick, 1981). Out of these one thousand invitations, we obtained 124 completed and usable responses, yielding a response rate of 12.4%. This rate is consistent with prior web-based surveys targeting senior executives (e.g. Im and Rai, 2008; Jansen et al., 2009).
To identify multi-BM firms, we included a dedicated section in the questionnaire. Since this study focuses on firms operating multiple business models, we first needed to determine whether responding firms were single- or multi-BM organizations. Following previous research (Aversa et al., 2021; Sohl et al., 2020), firms were classified based on the number of business models they operated. To operationalize this classification, we followed the approach suggested by Xenakis and Manolopoulos (2026). Respondents were asked which of the eight BM types (i.e. patron, cloud liberator, proprietor, cloud regent, product steward, educator, consultant, and custodian) their organization operated. Consistent with prior quantitative studies (e.g. Sohl et al., 2020), we used dummy variables to capture the presence of each BM type. Moreover, to exclude firms generating substantial revenues from non-software activities from our sample, we retained only firms deriving more than 75% of their total revenues from software-related offerings. By applying both criteria, 17 firms (13.7%) were excluded from the analysis. Thus, our final sample comprises 107 multi-BM entrepreneurial software firms, which operate an average of four BMs (min = 2; max = 8; SD = 1.61).
To capture BM design themes in our sample of firms operating multiple BM types, we adapted multi-item measurement scales from Zott and Amit (2007, 2008) (see Appendix 1 and Section 3.3.2). To assess potential non-response bias, we followed Armstrong and Overton's (1977) procedure and compared early and late respondents across key variables, including the number of BMs (t = −1.61, p > 0.10), novelty (t = 0.62, p > 0.10), lock-in (t = −1.23, p > 0.10), complementarities (t = −0.09, p > 0.10), efficiency (t = −0.66, p > 0.10), and return on assets (ROA) as the performance indicator (t = 0.02, p > 0.10). No statistically significant differences were observed between the two groups, suggesting that non-response bias is unlikely to pose a serious concern. Among the 107 respondents, 44% were CEOs, managing directors, chairpersons, vice presidents, or owners/founders; 5.5% were other C-suite executives (e.g. CTOs); 48.5% held director-level positions; and 2% were partners.
3.2 Analysis
Our study adopts a set-theoretic fsQCA approach that allows for a thorough analysis of how configurations of causal conditions contribute to the observed outcome (Fiss, 2011). The key assumption of fsQCA is that outcomes rarely have any single cause (Greckhamer et al., 2008) and the interplay of different explanatory conditions is instead what triggers a particular outcome of interest (Rihoux and Ragin, 2009). Put otherwise, rather than treating explanatory variables as competing in the explanation of an outcome, fsQCA investigates how configurations of conditions generate a certain outcome (Woodside, 2013). It also stresses the concept of equifinality, that is, multiple equally effective configurations may result in the same outcome (Fiss, 2007). Thus, fsQCA seems particularly well-suited for our research, as it views cases as configurations of conditions; identifying which BM design theme configurations are sufficient for high (or low) performance. Moreover, this method is suitable for relatively small sample sizes (e.g. Fiss, 2011; Tóth et al., 2015).
A complete fsQCA involves two sequential and theoretically distinct analyses: an analysis of necessity and an analysis of sufficiency (Schneider and Wagemann, 2010). The analysis of necessity examines whether any causal condition must be present for the outcome to occur, while the analysis of sufficiency examines whether a condition or combination of conditions is sufficient to produce the outcome (Ragin, 2006; Schneider and Wagemann, 2012). Prior to both analyses, causal conditions and the outcome must be transformed into set membership values through a process known as calibration (Ragin, 2000).
3.3 Operationalization and calibration
3.3.1 Outcomes
In performance studies, ROA and return on sales (ROS) are the most commonly used financial indicators (Ahuja and Novelli, 2017). They have also been adopted in the nascent literature on multi-BM firms as key performance metrics (e.g. Sohl et al., 2020). Due to limited availability of sales figures, we were unable to calculate ROS for the majority of our sampled firms. Thus, we chose ROA as the outcome in our study; calculated as attributable profit divided by total assets (i.e. profit after tax, minority interests and dividends, attributable to ordinary shareholders). Consistent with the approach used in the majority of relevant studies (e.g. Linton and Kask, 2017; Tóth et al., 2015), the calibration of our outcomes relies on a sample-dependent anchor.
The process used involves variable transformation into calibrated sets concerning three substantively meaningful thresholds, i.e. full membership, full non-membership, and the crossover point, which is “the point of maximum ambiguity in the assessment of whether a case is more in or out of a set” (Ragin, 2008, p. 30). Here, we distinguish between two performance anchors (high and low). On the calibration rules, we followed Fiss (2011) and created two fuzzy measures for firm performance. The first fuzzy-set measure captures firms with high performance; coded as 0 if a firm showed average or below-average performance (ROA ≤5.74%; i.e. 50th percentile), and as 1 if the firm exhibited high performance (ROA ≥18.43%; i.e. the 75th percentile or higher). Our crossover point was set at the halfway mark of 12.09%. The second set measure relates to low performance (ROA of 0.0% or below = full membership, ROA of 18.43% = full non-membership, crossover at 50th percentile 5.74%).
3.3.2 Conditions
We adapted established measures from Zott and Amit (2007, 2008) to capture BM design themes. As some of the items were originally developed for e-business contexts, we drew on relevant literature (e.g. Balboni et al., 2019) to refine and adapt the scales. We further adjusted the phrasing of the items for applicability to multi-BM software firms, focusing on organizational rather than BM-level assessments (Rossiter, 2002). Senior executives rated 20 statements (see Appendix 1) on a seven-point Likert scale (1 = strongly disagree; 7 = strongly agree) to assess their organization's alignment with these themes over the past financial year. This provided one-year lagged explanatory measures relative to the outcome. Prior to the final survey, we pretested the questionnaire with four experts (two academics and two professionals) to ensure face validity and clarity, and refined the questionnaire based on their feedback (Churchill, 1979).
All survey-based constructs exhibit high scale reliability, with Cronbach's alpha values exceeding the suggested threshold of 0.70 (Nunnally, 1978), while none exceeds 0.95 that would indicate possible undesirable response patterns and inflate correlations among item error terms (Hair et al., 2019). We also assessed convergent and discriminant validity via Confirmatory Factor Analysis (CFA) and Partial Least Squares (PLS) modeling. All factor loadings exceed the minimum acceptable threshold of 0.40 (Hinkin, 1995). Results of the CFA analysis indicate an acceptable fit to the data (see Appendix 1). Specifically, the χ2 to degrees of freedom ratio (χ2/df = 1.84) is below the suggested cut-off point of 3.0 (Kline, 2004); Root Mean Square Error of Approximation (RMSEA = 0.08) is below the suggested cut-off point of 0.10 (Browne and Cudeck, 1992; Byrne, 1998; MacCallum et al., 1996), Standardized Root Mean Square Residual (SRMR = 0.09) is within the acceptable range, not exceeding the threshold of 0.10 (Henseler et al., 2014; Hu and Bentler, 1999); and the Comparative Fit Index (CFI = 0.89) suggests a good fit to the data (Hu and Bentler, 1999).
Following Zott and Amit (2007, 2008), we also conducted PLS, calculating the square roots of the Average Variance Extracted (AVE) for each construct, as well as construct correlations (see Appendix 2). Since in all cases the square roots of each construct's AVE is greater than the correlations with the other constructs, our underlying constructs demonstrate adequate discriminant validity (Fornell and Larcker, 1981).
We applied consistent calibration rules across all conditions (e.g. Linton and Kask, 2017; Palacios-Marqués et al., 2017). fsQCA also requires transforming causal conditions into fuzzy-set membership scores ranging from 0 to 1 by specifying three qualitative anchors: full membership, full non-membership, and the crossover point of maximum ambiguity. This calibration procedure helps minimize information loss while preserving meaningful set-theoretic distinctions (Ragin, 2000, 2008). Thus, four new relative scales were developed from the original ones, where the full membership and full non-membership were set to the 90th percentile and 10th percentile respectively, and the crossover point was set to the 50th percentile. Table 1 provides an overview of calibration rules applied to both outcome and conditions, while Appendix 3 reports the descriptive statistics and correlations for conditions and outcome.
Calibration rules
| Construct | Calibration rule | Membership score |
|---|---|---|
| Novelty (N) | If N > 5.8 | 1 (full membership) |
| If N < 2.75 | 0 (full non-membership) | |
| If N = 4.63 | 0.5 (crossover point) | |
| Lock-in (I) | If I > 6.17 | 1 (full membership) |
| If I < 3.43 | 0 (full non-membership) | |
| If I = 5.00 | 0.5 (crossover point) | |
| Complementarities (C) | If C > 6.20 | 1 (full membership) |
| If C < 3.72 | 0 (full non-membership) | |
| If C = 5.20 | 0.5 (crossover point) | |
| Efficiency (E) | If E > 6.48 | 1 (full membership) |
| If E < 4.20 | 0 (full non-membership) | |
| If E = 4.20 | 0.5 (crossover point) | |
| High performance (H) | If H > 18.43 | 1 (full membership) |
| If H < 5.74 | 0 (full non-membership) | |
| If H = 12.09 | 0.5 (crossover point) | |
| Low performance (L) | If L < 0 | 1 (full membership) |
| If L > 18.43 | 0 (full non-membership) | |
| If L = 5.74 | 0.5 (crossover point) |
Note(s): High Performance (Outcome): The 75th percentile is the threshold for full membership and the 50th percentile is the threshold for full non-membership. The average of these two is the crossover point. Low Performance (Outcome): The 50th percentile construct scores are defined as the crossover point, while 0.00% is the threshold for full membership and the 75th percentile for full non-membership. Novelty, Lock-in, Complementarities, Efficiency (Conditions): The 50th percentile construct scores are defined as the crossover point, while the 90th percentile is the threshold for full membership and the 10th percentile for non-membership
4. Findings
To conduct the fsQCA, we used the fsQCA 4.1 software package (Ragin and Davey, 2022). Following established methodological guidelines, we first conducted a necessity analysis to examine whether any causal condition is required for the outcome to occur. We then performed a sufficiency analysis to identify which individual conditions or combinations of conditions are sufficient to produce the outcome (Ragin, 2006).
4.1 Analysis of necessity
The analysis of necessity ascertains whether any of the causal conditions are necessary for producing the outcome. A condition is necessary when, each time the outcome occurs, the condition is also present (Ragin, 2006; Schneider and Wagemann, 2012). Necessity is evaluated through two metrics. First, the consistency score measures the degree to which the empirical cases conform to this subset relationship; the commonly accepted threshold is 0.90, meaning that any condition, in its presence or absence, featuring a consistency score above this value should be subject to closer scrutiny as a potentially necessary condition for the outcome to occur (Schneider et al., 2010; Torfing et al., 2020). Second, coverage scores are also considered, as they capture the relevance of a necessary condition: high values indicate substantive relevance, while low values suggest triviality (Schneider and Wagemann, 2012). A condition may pass the consistency threshold yet still be considered trivially necessary if it is present in almost all cases regardless of the outcome; a situation further examined through the Relevance of Necessity (RoN) parameter where required (Schneider and Wagemann, 2012).
Table 2 presents the consistency and coverage scores for all conditions (and their negations) tested against both high and low performance outcomes. The results reveal that no condition meets the 0.90 consistency threshold required to claim necessity for either outcome. Given that no condition approaches the threshold in either analysis, further consideration of coverage values or the RoN parameter is not warranted (Schneider and Wagemann, 2012). These findings indicate that no individual design theme constitutes a prerequisite for either outcome, which is consistent with the configurational logic underpinning fsQCA and with the equifinality principle (Fiss, 2007; Ragin, 2008).
Analysis of necessity
| Condition | Consistency | Coverage |
|---|---|---|
| Outcome: high performance | ||
| Novelty | 0.61 | 0.66 |
| ∼Novelty | 0.56 | 0.62 |
| Lock-in | 0.61 | 0.64 |
| ∼Lock-in | 0.57 | 0.65 |
| Complementarities | 0.59 | 0.62 |
| ∼Complementarities | 0.58 | 0.67 |
| Efficiency | 0.56 | 0.61 |
| ∼Efficiency | 0.61 | 0.68 |
| Outcome: low performance | ||
| Novelty | 0.56 | 0.56 |
| ∼Novelty | 0.57 | 0.59 |
| Lock-in | 0.59 | 0.58 |
| ∼Lock-in | 0.55 | 0.58 |
| Complementarities | 0.62 | 0.60 |
| ∼Complementarities | 0.51 | 0.55 |
| Efficiency | 0.61 | 0.62 |
| ∼Efficiency | 0.52 | 0.53 |
Note(s): The ∼ sign indicates absence of the condition
4.2 Analysis of sufficiency
Following the analysis of necessity, we performed an analysis of sufficiency to identify which configurations of BM design themes are sufficient for high performance. A configuration is considered sufficient when it consistently leads to the outcome, formally expressed as the configuration being a subset of the outcome (Ragin, 2006; Schneider and Wagemann, 2012). Through a process of Boolean minimization, the analysis produces a simplified equation, referred to as the minimal formula, specifying which configurations of causal conditions lead to the outcome (Ragin, 2000, 2008).
The analysis of sufficiency requires the construction of a truth table (Ragin, 2000, 2008), which displays all logically possible combinations of causal conditions and assigns the empirical cases to each configuration. With four causal conditions, the truth table consists of 24 (16) logically possible configurations, all of which are empirically observed in our sample. Table 3 presents the full truth tables for the high and low performance outcomes.
Truth tables for high and low performance outcomes
| Config | Novelty | Lock-in | Complementarity | Efficiency | N | High perf | Raw consist | PRI consist |
|---|---|---|---|---|---|---|---|---|
| Truth table for high performance | ||||||||
| 1 | 1 | 0 | 0 | 1 | 4 | 1 | 0.89 | 0.77 |
| 2 | 1 | 1 | 0 | 1 | 6 | 1 | 0.88 | 0.76 |
| 3 | 1 | 1 | 1 | 0 | 5 | 1 | 0.87 | 0.77 |
| 4 | 1 | 0 | 0 | 0 | 5 | 1 | 0.86 | 0.75 |
| 5 | 0 | 1 | 0 | 1 | 2a | 0 | 0.90 | 0.78 |
| 6 | 1 | 0 | 1 | 0 | 2a | 0 | 0.89 | 0.75 |
| 7 | 1 | 1 | 0 | 0 | 1a | 0 | 0.88 | 0.74 |
| 8 | 0 | 0 | 1 | 1 | 2a | 0 | 0.87 | 0.68 |
| 9 | 0 | 1 | 0 | 0 | 1a | 0 | 0.86 | 0.67 |
| 10 | 0 | 1 | 1 | 0 | 4 | 0 | 0.85 | 0.66 |
| 11 | 0 | 0 | 1 | 0 | 6 | 0 | 0.84 | 0.67 |
| 12 | 1 | 0 | 1 | 1 | 2a | 0 | 0.83 | 0.62 |
| 13 | 0 | 0 | 0 | 1 | 6 | 0 | 0.81 | 0.64 |
| 14 | 0 | 1 | 1 | 1 | 6 | 0 | 0.79 | 0.60 |
| 15 | 0 | 0 | 0 | 0 | 14 | 0 | 0.74 | 0.57 |
| 16 | 1 | 1 | 1 | 1 | 17 | 0 | 0.63 | 0.44 |
| Truth table for low performance | ||||||||
| 1 | 1 | 0 | 1 | 1 | 2a | 0 | 0.73 | 0.55 |
| 2 | 0 | 0 | 1 | 1 | 2a | 0 | 0.72 | 0.51 |
| 3 | 0 | 1 | 0 | 0 | 1a | 0 | 0.72 | 0.51 |
| 4 | 1 | 1 | 1 | 1 | 17 | 0 | 0.71 | 0.63 |
| 5 | 0 | 1 | 1 | 1 | 6 | 0 | 0.68 | 0.52 |
| 6 | 0 | 0 | 1 | 0 | 6 | 0 | 0.68 | 0.50 |
| 7 | 0 | 1 | 1 | 0 | 4 | 0 | 0.68 | 0.46 |
| 8 | 1 | 1 | 0 | 0 | 1a | 0 | 0.66 | 0.44 |
| 9 | 0 | 0 | 0 | 0 | 14 | 0 | 0.66 | 0.53 |
| 10 | 0 | 1 | 0 | 1 | 2a | 0 | 0.65 | 0.41 |
| 11 | 1 | 0 | 1 | 0 | 2a | 0 | 0.65 | 0.43 |
| 12 | 0 | 0 | 0 | 1 | 6 | 0 | 0.64 | 0.45 |
| 13 | 1 | 0 | 0 | 1 | 4 | 0 | 0.63 | 0.42 |
| 14 | 1 | 1 | 0 | 1 | 6 | 0 | 0.61 | 0.41 |
| 15 | 1 | 0 | 0 | 0 | 5 | 0 | 0.59 | 0.40 |
| 16 | 1 | 1 | 1 | 0 | 5 | 0 | 0.58 | 0.38 |
Note(s): The frequency cut-off point is 3 and the consistency cut-off point is 0.85. Shaded rows indicate configurations coded as sufficient for the outcome. Column A excluded from minimization as logical remainders (N < 3)
Two parameters guide the coding of truth table rows. The first is the frequency threshold, which sets the minimum number of cases required for a configuration to be included in the minimization process. Following Fiss (2011) and Ragin (2008), we set this threshold to 3, ensuring that configurations are supported by a meaningful number of empirical cases. The second parameter is the consistency threshold, which determines the minimum degree to which cases in a given configuration are a subset of the outcome. We set this threshold to 0.85, which is more stringent than the commonly cited minimum of 0.75 (Ragin, 2008; Fiss, 2011) and the frequently used value of 0.80. This choice is justified on both empirical and methodological grounds. Empirically, rather than setting the threshold arbitrarily, we followed the recommendation of Ragin (2008) to identify a meaningful discontinuity in the distribution of raw consistency scores in the truth table. Inspection of Table 3 reveals a natural break between the four configurations coded as sufficient (which record consistency scores between 0.86 and 0.89) and the remaining configurations, whose scores fall at or below 0.84, making 0.85 the natural cut-off point in the data. Methodologically, a more stringent threshold reduces the risk of incorrectly designating configurations as sufficient and is consistent with best practice recommendations for fsQCA in management research (Greckhamer et al., 2018; Schneider and Wagemann, 2012). Configurations meeting both the frequency and consistency criteria are coded as sufficient for the outcome; those falling below either threshold are coded as not sufficient and excluded from the minimization process.
In addition to raw consistency, we examined the Proportional Reduction in Inconsistency (PRI) score for each configuration, which guards against the simultaneous subset membership of a configuration in both the outcome and its negation (Schneider and Wagemann, 2012). As Table 3 shows, four configurations meet both the frequency threshold and the consistency threshold (≥0.85) and display acceptable PRI scores, and are therefore coded as sufficient for the outcome. All four share the presence of Novelty as a common element. Notably, the combination of all four design themes simultaneously records the lowest consistency score (0.63) and a PRI score of 0.44 despite being the largest single configuration in the sample (N = 17), suggesting that firms deploying all four BM design themes simultaneously do not achieve high performance.
The minimization process yields three possible solutions depending on how logical remainders are treated: a complex solution, which avoids using any remainders and is exclusively guided by the empirical information at hand; a parsimonious solution, which permits the use of any remainder that yields simpler configurations; and an intermediate solution, which uses only remainders consistent with theoretical expectations provided by the researcher (Ragin, 2009; Schneider and Wagemann, 2012). We report the complex solution as our primary result, as it makes no assumptions about unobserved BM configurations and is the most conservative and empirically grounded option available (Ragin, 2009; Schneider and Wagemann, 2012). This is consistent with published applications of fsQCA in strategic management (e.g. García-Castro et al., 2013), where the complex solution is reported as the primary result due to its empirical conservatism. The parsimonious solution was additionally computed to distinguish core from peripheral conditions following the Fiss (2011) notation: conditions appearing in both the complex and parsimonious solutions are designated as core, while those appearing only in the complex solution are designated as peripheral. The intermediate solution was not employed, as the complex solution already yields a parsimonious set of three configurations, leaving little complexity to reduce further (García-Castro et al., 2013; Ragin, 2009).
4.3 High-performing business model portfolio design configurations
Table 4 presents the results of the fuzzy-set analysis depicting high-performing BM design configurations. We followed the notation suggested by Fiss (2011), according to which filled circles designate the presence of a condition (in our case a particular design theme), whereas circles with a cross designate its absence. Large circles designate core conditions (those for which the evidence shows a strong causal relationship with the outcome of interest) while small circles designate peripheral conditions, for which the evidence of a causal relationship with the outcome is weaker. Accordingly, large-filled circles (●) designate the core presence of a condition, large circles with a cross (⊗) designate its core absence, small-filled circles (●) designate the peripheral presence of a condition, and small circles with a cross (⊗) designate its peripheral absence. Blank spaces designate “don't care” situations, where the condition may be either present or absent. Core and peripheral conditions are identified by cross-referencing the complex and parsimonious solutions: conditions appearing in both are designated as core, while those appearing only in the complex solution are designated as peripheral (Fiss, 2011).
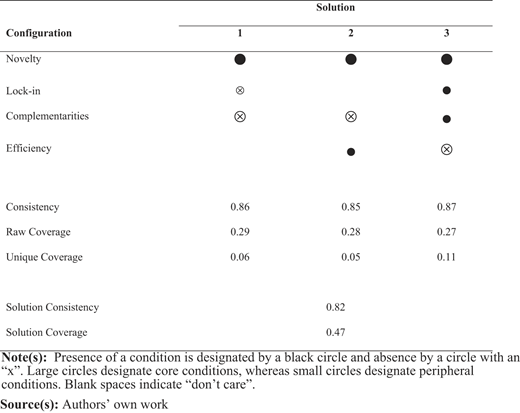
In line with prior research (e.g. Fiss, 2011), we grouped the solutions based on their core conditions. The fuzzy-set analysis yields three configurations with consistency scores ranging from 0.85 to 0.87 and an overall solution consistency of 0.82, exceeding the recommended threshold of 0.80 (Fiss, 2011). Solution coverage relates to the overall explanatory power of the three solutions; that is, how much of the outcome is explained by the identified configurations (Rihoux and Ragin, 2009). The three configurations account for 47% of the membership in the outcome, which is substantive (Fiss, 2011). It is important to note that solution coverage in fsQCA is conceptually distinct from R2 in regression analysis: it measures the proportion of fuzzy-set membership in the outcome accounted for by the identified configurations, not the proportion of cases explained (Ragin, 2006, 2008). Accordingly, the remaining 53% reflects additional configurational paths, consistent with the principle of equifinality, rather than unexplained cases (Fiss, 2007; Ragin, 2008). A coverage of 0.47 appears consistent with published fsQCA studies in leading management journals, several of which report solution coverage well below this figure (e.g. Fiss, 2011; García-Castro et al., 2013; García-Castro and Francoeur, 2016; Xie et al., 2021). Raw coverage measures the proportion of outcome memberships explained by each configuration, while unique coverage measures the proportion explained exclusively by that configuration.
Overall, the results in Table 4 support H1, as Novelty is present as a core condition in all three high-performing configurations. Configuration 1 demonstrates that novelty, in the absence of customer lock-in and product/service complementarities, is sufficient for high financial performance regardless of whether efficiency is present or absent. H2a is also supported, as BM designs combining novelty and efficiency contribute to high performance, as evidenced in Configuration 2. Contrary to our initial expectations, customer lock-in does not appear as a central condition in any high-performing configuration, while product/service complementarities are, on average, absent from high-performing multi-BM software firms. Moreover, there is no high-performing configuration that emphasizes a quadratic BM design combining all four BM design themes simultaneously. H2b is therefore not confirmed by the high-performance analysis; a finding further examined below.
4.4 Low-performing business model portfolio design configurations
We also sought to identify low-performing BM portfolio design configurations. Table 3 presents the full truth table for the negated outcome (low performance). As shown, no configuration in the low performance truth table meets the predefined consistency threshold of 0.85, and indeed no configuration exceeds the minimum recommended threshold of 0.75 (Ragin, 2006, 2008; Woodside, 2013), with the highest observed raw consistency score being 0.73. Accordingly, no sufficient configurations for low performance could be identified, and the minimization procedure yielded no solution.
In fsQCA, the conditions leading to the presence of an outcome are not necessarily the mirror image of those leading to its absence, a property known as causal asymmetry (Fiss, 2011; Ragin, 2008). The absence of sufficient configurations for low performance indicates that there is no single configurational recipe that reliably leads multi-BM firms to underperform; poor performance may instead emerge through a wide variety of paths not systematically captured within the present model. This asymmetric structure also bears on H2b: since no configuration combining all four design themes emerges as sufficient for either high or low performance, the hypothesis that Lock-in and Complementarities further enhance the effect of Novelty and Efficiency is rejected. We therefore conclude that high-performing BM portfolio design configurations have no low-performing mirror image, and that the emphasis on complex, quadratic BM designs does not constitute a reliable path to either high or low performance among multi-BM software firms.
4.5 Robustness tests
In fsQCA, there is no concept of a “control variable” apostrophe (Greckhamer et al., 2013, pp. 60–61), meaning that firm-specific characteristics potentially correlated with our core constructs and/or firm performance are not included in the analysis. This is an inherent limitation in QCA studies. To address this, we ran multiple fsQCA analyses on subsets of our dataset based on firm-level variables. Consistent with prior literature (Wei et al., 2014; Zott and Amit, 2007, 2008), we accounted for firm size by categorizing our sample into groups based on the number of employees (micro-, small-, and medium-sized firms). We then conducted separate analyses based on high and low firm performance, and the identified configurations remained unchanged. Additionally, we accounted for the number of BMs adopted by the multi-BM firms. We divided our dataset into two subsets based on the mean number of BMs and conducted separate analyses for high- and low-performing firms. Again, the identified configurations remained unchanged.
We also compared the fsQCA results with those from alternative analytical approaches. Given that our data are calibrated between 0 and 1, fractional response (logit) regression is the most suitable method. We analyzed the data in R, using the fractional response regression (frm function). Appendix 4 provides detailed estimation and results for high/low-performing BM portfolio design configurations. The fractional logistic regression results broadly support the fsQCA findings. Two of the three high-performing configurations yield statistically significant coefficients, while Configuration 2 (Novelty*∼Complementarities*Efficiency) does not reach conventional significance levels. This is expected as regression evaluates the net, independent effect of each term and cannot cleanly isolate the contribution of Configuration 2, which shares its core conditions with Configuration 1 and has low unique coverage (0.05). This reflects a well-documented divergence between net-effects regression and set-theoretic analysis, whereby regression penalizes a path that is largely overlapping with another, whereas fsQCA identifies it as a distinct sufficient configuration under the principle of equifinality (Ragin and Fiss, 2008; Vis, 2012). The fsQCA consistency score of Configuration 2 (0.85) confirms that it constitutes an equally valid sufficient path to the outcome by set-theoretic standards.
5. Discussion and conclusions
This study develops new arguments and offers evidence about how different configurations of business model design themes, within a firm's portfolio of BMs, contribute to financial success. We therefore extend current literature that has largely examined design themes in isolation (Fiss, 2011; Kulins et al., 2016) by theorizing and testing the potential synergies and complementarities that emerge when firms manage a portfolio of business models to realize performance benefits. Since the number of firms that operate multiple BMs has increased significantly (Lanzolla and Markides, 2021; Snihur and Markman, 2023), gaining a better understanding of how specific configurations of BM design themes shape organizational performance is much needed (Aversa et al., 2021). Hence, the work at hand offers important theoretical and practical implications.
First, our findings shed light on the role of novelty as a core theme across all high-performing configurations of BM design themes. Importantly, however, the configurations reveal that novelty operates under different structural conditions. In the first configuration, novelty alone is sufficient for high performance when combined with the absence of lock-in and complementarities, indicating that firms can benefit from pursuing novelty-centric portfolios of BMs without emphasizing other design themes. By contrast, the other two hypothesized configurations show novelty coexisting with additional themes, specifically efficiency and complementarities, suggesting that firms can also achieve performance gains by combining novelty with other BM design logics.
In this regard, our results extend prior work on single-BM designs that typically shows that novelty must be complemented by other design themes to generate high performance (e.g. Leppänen et al., 2023). Our approach shows that novelty may operate both as a core theme and as a constituent element of a combination of other BM themes to generate financial performance. This implies that firms operating multiple BMs can leverage key resources and capabilities developed across their BM portfolio, thereby reducing the uncertainty and implementation risks often associated with novel business activities (Markides and Williamson, 1994; Aspara et al., 2010; Foss and Saebi, 2017). Similarly, from a dynamic capabilities perspective (Teece, 2007, 2018), this may suggest that firms can recombine accumulated knowledge and resources across BMs to support and scale innovation.
Further, our findings identify a configuration in which novelty and efficiency jointly contribute to high performance within a firm's BM portfolio, while complementarities are absent. This challenges prior research that often presents these design themes as substitutes because of the tensions between experimentation and cost optimization and the risk of diseconomies of scope when firms pursue both simultaneously (Zott and Amit, 2007). Drawing on configuration theory, our results show that, in the context of entrepreneurial software firms that operate portfolios of BMs, novelty and efficiency can complement (rather than substitute) each other in generating performance gains. Although our empirical tests cannot directly specify the underlying mechanisms that enable this complementarity, one plausible explanation is that firms operating multiple BMs may differentiate their BMs across diverse markets, customer segments, or product domains (Lavie et al., 2011; Markides, 2013). Such domain separation could reduce the strain and resource conflicts that may arise when firms seek to embrace seemingly competing strategic logics in concert (Gupta et al., 2006), allowing some BMs to emphasize efficiency while others adopt more exploratory, novelty-oriented approaches. In this sense, BM portfolios can provide a context that enables firms to balance efficiency and novelty by mitigating related tensions. This resonates with research on organizational ambidexterity that suggests that firms can reconcile competing logics through structural differentiation or separation (Kauppila, 2010; O'Reilly and Tushman, 2013).
Our results also show that configurations of all four BM design themes do not relate with high performance. From a configuration perspective, this implies that pursuing the highest possible design complexity in BM portfolios of software firms can introduce trade-offs that may hurt performance. Diseconomies of scope can provide an explanation for this finding, as the coordination costs and managerial challenges related with managing multiple strategic logics may outweigh their potential benefits (Panzar and Willig, 1981). Managing BMs that simultaneously emphasize novelty, efficiency, complementarities, and lock-in can increase complexity, give rise to competing resource demands, and increase organization costs (Levinthal and Wu, 2010; Ocasio and Joseph, 2018). For example, lock-in strategies frequently involve customized offerings designed to increase customer loyalty (Feitzinger and Lee, 1997; Guo et al., 2017), which may in turn contradict with the standardization and process optimization that relate with efficiency-oriented designs (Zott and Amit, 2002). Similarly, complementarities that depend on integrating products or services to satisfy diverse customer needs may introduce operational complexity that undermines efficiency goals (Zott and Amit, 2007). Taken together, these insights suggest that high performance in BM portfolios may depend on selecting specific combinations that balance strategic benefits against organizational complexity rather than on maximizing the number of design themes.
Our findings further illustrate that the drivers of performance in multi-BM firms cannot be adequately understood by examining BM design themes separately. Rather, high performance results from the interaction of multiple BM themes. In theoretical terms, this reflects conjunctural causation (Ragin, 2008), whereby conditions exert causal influence only in combination with other conditions. Aligned with this rationale, our analysis identifies specific configurations that relate high performance, demonstrating the principle of equifinality (Fiss, 2007, 2011); that is, different combinations of design themes can lead to similar outcomes. Importantly, the role of any individual design theme varies based on the configuration in which it appears, operating as core in one combination, peripheral in another, or absent altogether. This implies that the performance implications of BM design themes are inherently context-dependent. In this sense, our findings reinforce Amit and Zott's (2001) original argument that design themes are interdependent rather than mutually exclusive, suggesting that their explanatory power lies in their complementarity rather than in their independent effects. By demonstrating how design themes combine across a firm's BM portfolio to generate financial performance, our work highlights the value of configuration theory (Meyer et al., 1993) for advancing BM research.
5.1 Limitations and future research directions
Despite its contributions, this study has several limitations that suggest promising directions for future research. First, our findings derive from a specific industry context, namely software firms. While multi-BM firms have been observed across a variety of sectors, including airlines, pharmaceuticals, and retail (e.g. Sabatier et al., 2010; Snihur and Tarzijan, 2018; Sohl et al., 2020), the configurations identified in this study may be shaped by characteristics of the software industry. Future research could extend our analysis to other industries in order to examine whether similar configurational patterns emerge, thereby helping to assess the generalizability of our findings.
Second, our sample is composed of entrepreneurial software firms, which may be well aligned with the software industry's structure, but raises concerns that the findings may be specific to this firm type. Thus, future research could investigate a more diverse sample in terms of firm size. Third, our methodological approach presents inherent challenges in controlling for firm-specific characteristics. While our tests helped mitigate this concern, future research could employ multiple statistical methods to further validate the study's findings.
Third, the sample collection procedure, which included a time-lag between the dependent and independent variables, and the method used to test the hypotheses do not eliminate the possibility of reverse causality (see also Aversa et al., 2015). It remains possible that high-performing firms may enhance their novelty, or that low performance could drive firms to diversify their portfolio designs, rather than the reverse. Future studies can test the direction of these complex relationships more thoroughly, using longitudinal data.
Finally, our study relies on a single respondent from each entrepreneurial firm, specifically senior executives, to provide the primary data. While these respondents are often considered the most reliable and informed individuals regarding a firm's strategic focus (Hambrick, 1981), scholars such as Bowman and Ambrosini (1997) argue that single respondents, regardless of their role, may not offer the most reliable insight into the BM themes within an organization. Therefore, our results should be interpreted with caution.
Appendix 1
Measurement model details
| Explanatory measures | Loadings | Cronbach's alpha | CR |
|---|---|---|---|
| Novelty | 0.829 | 0.830 | |
| 1. We offer new combinations of products, services, and information | 0.558 | ||
| 2. We give access to an unprecedented variety and number of participants, products or service offerings | 0.537 | ||
| 3. We link participants to transactions in novel ways | 0.689 | ||
| 4. The way we conduct transactions is novel compared to the traditional way of doing business | 0.696 | ||
| 5. The way we generate revenue is novel compared to the traditional way of doing business (e.g. subscription fees vs license fees) | 0.605 | ||
| 6. We create new sources of revenues | 0.676 | ||
| 7. We adopt new ideas and methods to conduct business | 0.748 | ||
| Lock-in | 0.777 | 0.814 | |
| 1. We strongly promote security and reliability | 0.505 | ||
| 2. The concept of “virtual community” apostrophe plays an important role in our business | 0.522 | ||
| 3. There are important direct network externalities; participants benefit from increasing number of similar participants | 0.881 | ||
| 4. There are important indirect network externalities; participants from one group benefit from increasing participants from another group | 0.901 | ||
| Complementarities | 0.784 | 0.786 | |
| 1. Customers have access to a wide range of complementary product and/or service offerings from our organisation | 0.64 | ||
| 2. Cross-selling of product and/or service offerings is important | 0.694 | ||
| 3. There are strong complementarities in resources and capabilities (inputs) in our product and/or service offerings | 0.793 | ||
| 4. There are strong vertical complementarities in terms of our product/service offerings (e.g. support, training services, etc.) | 0.576 | ||
| 5. There are strong horizontal complementarities in product and/or service offerings (i.e. among our products/services, one stop shopping) | 0.578 | ||
| Efficiency | 0.734 | 0.736 | |
| 1. Transaction costs for participants are reduced | 0.761 | ||
| 2. Transactions are simple from the user's point of view | 0.591 | ||
| 3. Other costs for participants are reduced (e.g. total cost of ownership, up-front investments, infrastructure costs, technological uncertainty, etc.) | 0.635 | ||
| 4. We enable fast transaction speeds | 0.507 |
Note(s): Model fit indexes: χ2 = 301.903; df = 164; χ2/df = 1.84; RMSEA = 0.08; SRMR = 0.09; CFI = 0.891
Appendix 2
Discriminant validity – Fornell-Larcker criterion
| Novelty | Lock-in | Complementarities | Efficiency | |
|---|---|---|---|---|
| Novelty | 0.648 | 0.463 | 0.518 | 0.468 |
| Lock-in | 0.463 | 0.747 | 0.524 | 0.312 |
| Complementarities | 0.518 | 0.524 | 0.651 | 0.280 |
| Efficiency | 0.468 | 0.312 | 0.280 | 0.628 |
Note(s): The off-diagonal values are the correlations between the latent constructs and diagonal (indicated by the italic data) are the square roots of the AVEs
Appendix 3
Descriptive statistics and correlations
| Mean | SD | 1 | 2 | 3 | 4 | 5 | 6 | |
|---|---|---|---|---|---|---|---|---|
| 1. Novelty | 0.51 | 0.33 | 1 | |||||
| 2. Lock-in | 0.52 | 0.35 | 0.51*** | 1 | ||||
| 3. Complementarities | 0.58 | 0.35 | 0.40*** | 0.57*** | 1 | |||
| 4. Efficiency | 0.51 | 0.35 | 0.37*** | 0.39*** | 0.23* | 1 | ||
| 5. High performance | 0.55 | 0.36 | 0.08 | 0.006 | −0.10 | −0.15 | 1 | |
| 6. Low performance | 0.51 | 0.42 | −0.07 | −0.008 | 0.10 | 0.15 | −0.99*** | 1 |
Note(s): Significance levels: ***’ p < 0.001 ‘**’ p < 0.01 ‘*’ p < 0.05 ‘†’ p < 0.1
Appendix 4
Logit regression models, with financial performance as dependent variable
| Variables | Dependent variable |
|---|---|
| High firm performance | |
| Constant | −0.39* |
| (0.21) | |
| Novelty ∼ Lock-in ∼ Complementarities | 2.51** |
| (1.16) | |
| Novelty ∼ Complementarities * Efficiency | 1.11 |
| (1.15) | |
| Novelty * Lock-in * Complementarities ∼ Efficiency | 3.50*** |
| (1.07) | |
| Observations | 107 |
| R2 | 0.121 |
- Financial Performance is measured in terms of ROA. ROA is calibrated with the log-odds method and takes values that range between zero and one. Table 1 shows the calibration rules
- A solution (configuration) is modelled as an interaction. The absence of a condition (∼X) is modelled as 1 – X (not X), where X ∈ [0,1]
- Robust standard errors are reported in parentheses
Significance levels: ***’ p < 0.001 ‘**’ p < 0.01 ‘*’ p < 0.05 ‘†’ p < 0.1

