This research presents machine learning models for predicting international tourist arrivals in Indonesia during the COVID-19 pandemic using multisource Internet data.
To develop the prediction models, this research utilizes multisource Internet data from TripAdvisor travel forum and Google Trends. Temporal factors, posts and comments, search queries index and previous tourist arrivals records are set as predictors. Four sets of predictors and three distinct data compositions were utilized for training the machine learning models, namely artificial neural networks (ANNs), support vector regression (SVR) and random forest (RF). To evaluate the models, this research uses three accuracy metrics, namely root mean square error (RMSE), mean absolute error (MAE) and mean absolute percentage error (MAPE).
Prediction models trained using multisource Internet data predictors have better accuracy than those trained using single-source Internet data or other predictors. In addition, using more training sets that cover the phenomenon of interest, such as COVID-19, will enhance the prediction model's learning process and accuracy. The experiments show that the RF models have better prediction accuracy than the ANN and SVR models.
First, this study pioneers the practice of a multisource Internet data approach in predicting tourist arrivals amid the unprecedented COVID-19 pandemic. Second, the use of multisource Internet data to improve prediction performance is validated with real empirical data. Finally, this is one of the few papers to provide perspectives on the current dynamics of Indonesia's tourism demand.
1. Introduction
The increasing use of web-based platforms stimulates the growing availability of structured and unstructured data (Li et al., 2021). Search engines (Bangwayo-Skeete and Skeete, 2015), online forums (Fronzetti Colladon et al., 2019) and photo sharing apps (Miah et al., 2017) are just a handful of applications that contribute to the increasing availability of online data. The availability of online data has attracted academics and practitioners to extract business values from it. The tourism and hospitality industries are not an exception. Tourists have used various online platforms, such as social networks, microblogs, online booking, online reviews and online forums (Li et al., 2021), for their traveling purposes. The data emission from this online platform provides valuable customer behavior information (Bangwayo-Skeete and Skeete, 2015; Li et al., 2017). Forecasting models have been one of the most popular use cases that can be improved by utilizing this big Internet data (Song et al., 2019).
Literature on tourism demand forecasting is extensive (Li et al., 2021). Most studies have been focusing on predicting international tourist flow using various quantitative methods (Song et al., 2019), including time series (Ma et al., 2016; Park et al., 2017), econometric (Padhi and Pati, 2017), and artificial intelligence (AI) (Lv et al., 2018; Sun et al., 2019). In this big data era, AI-based approaches have increased popularity (Song et al., 2019) and have been widely used for tourism demand forecasting due to their ability to deal with nonlinear data (Law et al., 2019; Sun et al., 2019; Huang and Hao, 2020). The artificial neural network (ANN), support vector regression (SVR), and random forest (RF) are among the most frequently used AI-based models (Sun et al., 2019; Song et al., 2019; Abellana et al., 2020; Huang and Hao, 2020; Li et al., 2020).
While the use of historical statistics records for forecasting purposes has already matured, forecasting models using Internet data have received increasing attention (Li and Law, 2020; Li et al., 2021). Previous studies have utilized Internet data from different sources, such as search engines (Dergiades et al., 2018; Li et al., 2020), web traffic (Yang et al., 2014; Gunter and Önder, 2016) and social media (Miah et al., 2017; Starosta et al., 2019), for forecasting purposes. Search engine and web traffic data provide structured time-series data, while social media generate unstructured data. Most previous studies focused on utilizing single-source Internet data with notable forecasting accuracy improvements (Bangwayo-Skeete and Skeete, 2015; Park et al., 2017).
Although many studies have explored the use of Internet data to develop more accurate forecasting models, the ones that attempt to utilize combinations of several types of Internet data remain limited. Since single-source Internet data cannot comprehensively reflect tourists' attention, interests and interactions (Fronzetti Colladon et al., 2019; Li et al., 2021), multisource Internet data can offer a solution to address this drawback. Moreover, numerous issues and challenges are present in integrating different data sources and verifying empirical applications of multisource Internet data (Li et al., 2021). Correspondingly, this research study aims to fill the gap by developing tourist arrivals forecasts using multisource and multi-categories of Internet data based on well-investigated machine learning models, namely ANN, SVR and RF. As a case study, this study opts to predict international tourist arrivals in Indonesia. Furthermore, this study corresponds to the current global tourism trend that has been affected by the travel restrictions amid the COVID-19 pandemic. In the face of an unprecedented pandemic, the applicability of Internet data and the developed machine learning solution must be reexamined. Thus, the main research question of this study is how to develop machine learning models using multisource Internet data that leads to more accurate tourist arrivals prediction during the COVID-19 pandemic.
The structure of this paper is written as follows. Section 1 provides brief background, research gap and research question. Section 2 presents a literature review on extant tourism forecasting methods and tourism demand forecasting using Internet data. The research method is explained in Section 3. Section 4 presents the case study context. Section 5 provides results and discussion. The last section provides the conclusion, implications, current limitations and future research.
2. Literature review
Existing quantitative methods for tourism forecasting can be classified into three categories: time series, econometric and AI (Song et al., 2019; Li et al., 2021). Time series models provide simplicity by employing a lag of Internet data as explanatory variables (Li et al., 2021). This model can provide accurate predictions, notably for short-term forecasting horizons (Gunter and Önder, 2016; Park et al., 2017). The most commonly used time series models include autoregressive, autoregressive integrated moving average and seasonal autoregressive integrated moving average (Song et al., 2019; Li et al., 2021). The econometric models are concerned with the causality of various explanatory variables (Zhou-grundy and Turner, 2015; Dergiades et al., 2018). The previous studies demonstrated that econometric models can improve accuracy in more extended time horizons (Bangwayo-Skeete and Skeete, 2015; Gunter and Önder, 2016). However, all variables included in these models should be stationary to avoid spurious results (Huang et al., 2017; Dergiades et al., 2018; Song et al., 2019). Autoregressive distributed lag model, time-varying parameter and vector autoregression are among the most popular econometric models (Song et al., 2019; Li et al., 2021).
Unlike econometric models, AI-based models can describe nonlinear data without a prior understanding of the correlations between input and output variables (Song et al., 2019). These models rely on built-in feature engineering, which becomes the distinct advantage when dealing with large datasets (Law et al., 2019). This black box nature is often chastised for its lack of theoretical underpinning, poor interpretations of analytical outcomes and questionable explanatory value of input variables (Song et al., 2019; Li et al., 2021). However, AI-based approaches have been widely used because their nonlinear features can enhance forecasting performance (Law et al., 2019; Sun et al., 2019; Huang and Hao, 2020). The ANN is the most frequently used AI-based model, which can deal with almost any nonlinearity (Sun et al., 2019; Song et al., 2019). SVR is also frequently used in tourism demand forecasting due to its ability to model nonlinear data (Abellana et al., 2020; Huang and Hao, 2020; Li et al., 2020). Besides these two models, the RF also has grown in popularity due to its reliability and practical application in various fields (Khaidem et al., 2016; Tyralis and Papacharalampous, 2017; Li et al., 2020).
Previous studies have investigated three categories of Internet data to predict tourism demand: search engine, web traffic and social media. Google Trends (Bangwayo-Skeete and Skeete, 2015) and Baidu (Huang et al., 2017) are examples of search query data generated from search engines. Baidu performed better for tourism forecasting in China due to its market share advantage than Google in the region. However, Google performed better for international tourism forecasting contexts (Yang et al., 2015). Google Analytics account provides web traffic data from a particular website (Yang et al., 2014). Social media data can be obtained from photo-sharing applications (Miah et al., 2017), online forums (Fronzetti Colladon et al., 2019) and news articles (Starosta et al., 2019).
In the context of forecasting using search engine data, Google Trends have been used to predict tourist demand both at the country level (Park et al., 2017) and at the tourist destination level, such as tourist arrivals to five London museums (Volchek et al., 2019) and US National Parks (Clark et al., 2019). Besides Google Trends, several studies with forecasting context in China have utilized the Baidu index (Huang et al., 2017). Highly correlated query data are a challenge in utilizing search engine data. Therefore, Li et al. (2017) construct a composite search index to overcome highly correlated search query data (Li et al., 2017). Moreover, the corrected aggregate search volume index or adjusted index for different search languages and search platforms is preferable to the nonadjusted index (Dergiades et al., 2018). Prior studies demonstrated that incorporating search engine data from Google Trends and Baidu can improve forecasting accuracy.
Other researchers have explored the use of web traffic data of destination marketing organizations to predict hotel demand (Yang et al., 2014) and tourist arrivals to Vienna (Gunter and Önder, 2016). Both studies obtained web traffic data by using a Google Analytics account. Google Analytics provides two significant types of web traffic data: visitors and visits. The findings showed that web traffic data can improve the error reduction (Yang et al., 2014) and improve vector autoregression models' performance in a more extended time horizon (Gunter and Önder, 2016).
In terms of social media data, Miah et al. (2017) used geotagged photos uploaded by tourists to Flickr, a social media for photo-sharing, to predict tourism demand in Melbourne (Miah et al., 2017). Another study classified the user reviews in social media into positive and negative sentiments (Starosta et al., 2019). In contrast to search engines and web traffic data, these user-generated social media data are commonly found in unstructured data. Processing textual and image data from social media require advanced data preprocessing techniques. In general, using single-source Internet data to forecast tourist demand has been explored extensively.
While using a single category of Internet data has been well studied, only a few studies explored the use of different categories of Internet data (see Table 1). In this stream, some studies combined Google Trends and the Baidu index to predict tourist arrivals at the city level, such as Hong Kong (Huang and Hao, 2020), Hainan (Yang et al., 2015) and Beijing (Lv et al., 2018; Sun et al., 2019). The results indicated that the forecasting performance of the models using combined search engine data outperformed the ones using individual search engine data. A study combined online reviews from TripAdvisor and Google Trends to predict international airport arrivals to major European capital cities (Fronzetti Colladon et al., 2019). Other researchers utilized Facebook likes data and Google Trends to predict tourist arrivals to Austrian cities (Gunter et al., 2019). At the destination level, online reviews from two platforms, namely Ctrip and Qunar, are combined with the Baidu index to predict tourist arrivals to Mount Siguniang China (Li et al., 2020). The findings showed that better accuracy can be obtained by combining user-generated reviews from several online platforms.
To the best of our knowledge, developing tourism demand forecasting models using multisource Internet data, particularly with different categories of Internet data, is hard to find. Moreover, the applicability of using Internet data and the performance of existing machine learning forecasting models must be reexamined under an unprecedented COVID-19 pandemic context. This study fills the gap by utilizing two categories of Internet data, namely search engine (Google Trends) and social media (TripAdvisor travel forum), to develop prediction models that can accurately predict international tourist arrivals in the pandemic context. In addition, this study evaluates the prediction models under different combinations of Internet data and training dataset compositions.
3. Methodology
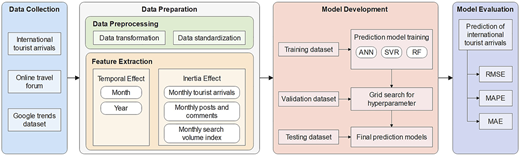
Figure 1 portrays the research framework of this study consisting of four main steps, namely (1) data collection, (2) data preparation, (3) model development and (4) model evaluation. First, we collected the data from the Indonesian Statistical Bureau (locally known as Badan Pusat Statistik or BPS), TripAdvisor travel forum and Google's search engine. In the second step, we conduct data preprocessing followed by feature extraction to obtain valuable and representative information from the dataset. The third step is the forecasting models development phase, followed by model evaluation at the fourth step.
Table 2 shows the specification of the prediction models, namely the predictors and predicted variables. We use four variables: temporal factors, TripAdvisor, Google Trends and international tourist arrivals. In total, we use four different sets of predictors and predicted variables that will be adopted in developing the prediction models using ANN, SVR and RF. We vary the predictors to verify that the proposed multisource Internet data can improve the prediction accuracy. Model evaluation based on root mean square error (RMSE), mean absolute error (MAE) and mean absolute percentage error (MAPE) was used to examine out-of-sample prediction accuracy. In order to ensure the robustness of the prediction models using multisource Internet data, we constructed the models using three distinct data compositions with different lengths of training, validation and testing dataset. While different settings of data splits can affect the model's forecasting performance (Yang et al., 2014), it is important to determine which data split setting will lead to the highest prediction accuracy.
3.1 Artificial neural networks
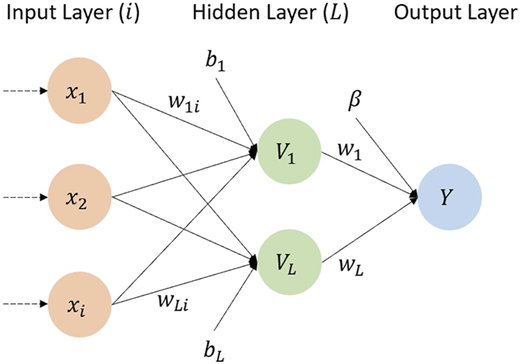
A feed-forward neural network consists of one or more input layers, one or more hidden layers and one output layer where each neuron in one layer conveys information to all neurons in the subsequent layer (Höpken et al., 2020). In this study, the ANN model consists of an input layer with three neurons that represent the predictor variables, namely the previous tourist arrivals , the number of posts and comments and search volume index , and an output layer representing the predicted variable, namely international tourist arrivals or . The output of hidden neurons ( and the international tourist arrivals () can be written in Eq. (1) and (2):
where is the input weight, is the input neurons, is the hidden layer threshold, is the output weight, is the output of hidden neurons, is the output layer threshold, is the activation function and is the output neuron (international tourist arrivals). Figure 2 shows the structure of the feed-forward neural network.
3.2 Support vector regression
Support vector machine (SVM) is a machine learning algorithm that maps data in high-dimensional feature space through a nonlinear mapping function (Li et al., 2020). SVM classifies training data vectors into two segments that are represented in Eq. (3).
where is the training data vectors ( with the previous tourist arrivals, the number of posts and comments, search volume index), is the number of training data and is the input space dimension represented by the number of predictor variables. The training data vectors classified by a hyperplane which satisfy the following equations:
where is the weight vector, is the mapping of input space () to high-dimensional space (), is a constant and is the incentive loss function.
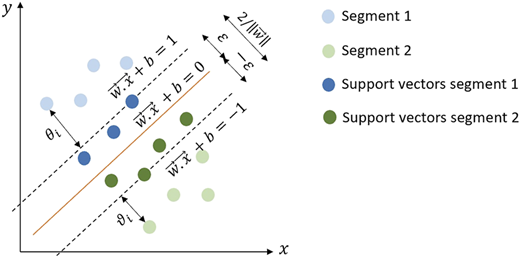
In Figure 3, we draw two parallel lines for one segment and for the other segment. In SVR, the model seeks a hyperplane to fit the given training data points with the fitting function by minimizing the regularized risk function , where is the regularization parameter, and are distances from actual value to the boundary values of . Thus, the nonlinear mapping function can be generated by applying the Lagrange multiplier (Yao et al., 2021),
where is the prediction of tourist arrivals, is the training data vectors ( with the previous tourist arrivals, the number of posts and comments, search volume index), and are Lagrange coefficients, is the Kernel function and is the constant.
3.3 Random forest
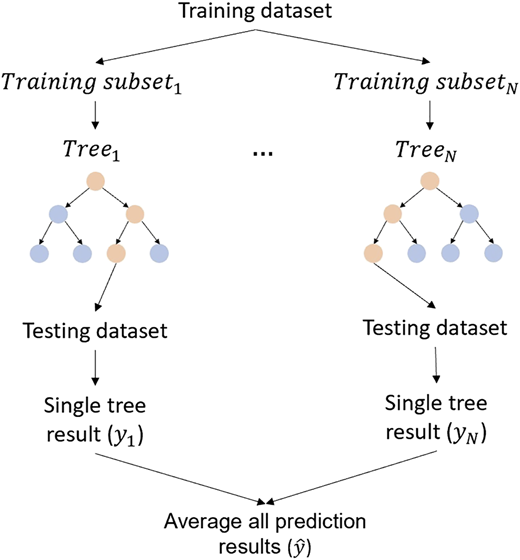
A RF has grown in popularity due to its high reliability and practical application in various fields (Khaidem et al., 2016; Tyralis and Papacharalampous, 2017; Li et al., 2020). This model combines the classification and regression tree and bagging method to improve the accuracy (Breiman, 2001). Figure 4 portrays the process of RF.
First, training subsets are randomly selected from the training dataset. Second, trees are randomly generated and trained by using the training subsets. The parent node splits into two daughter nodes, and the information impurity due to this split can be written by
where is the Gini impurity measure in node , is the population proportion of the left daughter node and is the population proportion of the right daughter node .
Third, each tree predicts the testing dataset, and the prediction results generated by all trees are averaged to obtain the final output of tourist arrivals prediction. The final output of RF is as follows:
where is the final output, is the number of trees and is the result of a single tree.
4. Case study
4.1 Data collection
As a case study, we analyze international tourist arrivals to Indonesia during the COVID-19 pandemic. First, we collected tourism data from the Indonesian Statistical Bureau Indonesia or BPS from January 2017 until June 2021. Next, we collect the data from a global online tourism platform, TripAdvisor. Table 3 shows the data sample of the Indonesia travel forum in TripAdvisor. The dynamic interactions within the online forums can be seen from the number of posts and comments that vary every day and covers diverse topics (Fronzetti Colladon et al., 2019). More than 43,000 posts were obtained, with 243,000 comments from users.
Table 4 shows the selected Google Trends keywords used in this study. The keywords are categorized into three topics: main entry point, international travel requirement and tourism planning. The search volume index represents search interest with values ranging from 0 to 100, a value of 100 as the search keyword's peak popularity.
Table 5 summarizes the descriptive statistics of the datasets. The statistics consist of monthly international tourist arrivals, daily posts and comments in the Indonesia travel forum, and the monthly search volume index of the selected keywords.
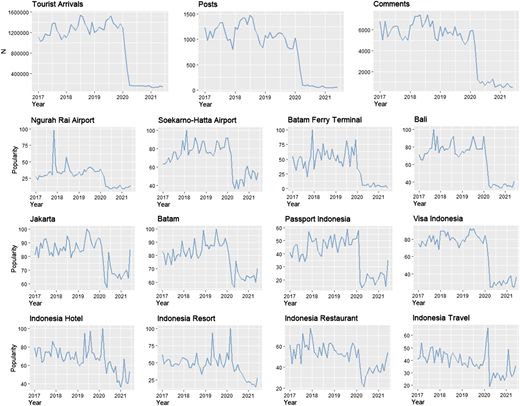
Figure 5 portrays all variables utilized for developing the prediction models. The international tourist arrivals have been experiencing significant declines since February 2020 due to the government's travel restrictions amid COVID-19. During the outbreak, the interaction in travel forums and the popularity of selected search keywords also decreased.
4.2 Data preparation
This phase consists of data preprocessing and feature extraction. In the data preprocessing, we transform all data into monthly data. We performed a three-month moving average for Google Trends data that smoothed out popularity trends to filter noise. In the last data preprocessing step, we perform data standardization using Eq. (8).
where is the original value, is the mean and σ is the standard deviation.
For processing time series data using the machine learning method, we extract two temporal features in this study: month and year. These variables are converted into dummy variables that aim to prevent information duplication. The second feature is the inertia variable or lag feature, which describes the value of the data in the previous month. We extract the inertia variable for all data categories, including tourist arrivals, search volume index, number of posts and comments.
4.3 Model development
We split the entire dataset into three segments: training, validation and testing datasets. We decompose the training datasets into three partitions (see Figure 6), namely (1) January 2017–April 2020 (the period when COVID-19 starts to gain popularity and infect Indonesian citizens), (2) January 2017–August 2020 (the period when the government implemented international travel restrictions) and (3) January 2017–December 2020 (the period when the government extend the international travel restrictions and implement wide-scale social restrictions).
The model parameters are optimized through a hyperparameter grid search (Lijuan and Guohua, 2016; Bi et al., 2020). First, we optimized the learning rate and the number of hidden layers for the ANN model. Second, three parameters, namely the regularization parameter (), Kernel and epsilon (), are optimized for the SVR model. Lastly, grid search for the RF model is performed by considering the number of variables randomly sampled at each split (Mtry), the number of trees (N trees) and the maximum nodes. Table 6 shows the results of the hyperparameters optimization.
4.4 Model evaluation
Evaluation of model performance is an inseparable step in developing prediction models. The difference between the predicted and actual values refers to the prediction error (Li et al., 2017). We evaluate the prediction performance using two scale-dependent errors, namely RMSE and MAE, and a percentage error, namely MAPE, which can be calculated using Eq. (9)–(11).
where is the actual, and is the predicted value of tourist arrivals.
5. Results and discussion
Tables 7 and 8 summarize the accuracy of all prediction models in terms of RMSE and MAE. From a total of 36 models, the prediction models utilizing multisource Internet data perform consistently better than the other models using single or even no Internet data predictors. The superiority of the multisource Internet data is also consistent across different data compositions. This finding indicates the robustness of using the multisource Internet data approach. Furthermore, all prediction models trained using data composition 3 yielded the best RMSE and MAE compared to those trained using data compositions 1 and 2. The RMSE and MAE significantly improve when we incorporate more data within the outbreak.
In line with the RMSE and MAE results, Table 9 shows that the prediction models trained using data composition 3 have the lowest MAPE compared to those using other data compositions. These findings indicate that the prediction models trained using sufficient data covered unexpected events, such as the COVID-19, will positively influence the prediction accuracy of the developed models. As noted by the previous study, researchers must develop forecasting models that can account for unforeseen events (Qiu et al., 2021). Overall, the RF model incorporating all predictors trained using data composition 3 has the highest prediction accuracy.
Discussing the impact of different predictors sets on prediction accuracy, prediction models trained using multisource Internet data perform better in predicting tourist arrivals than those trained using single-source Internet data and previous tourist arrivals. The ANN 4 and RF 4 models that use a complete set of predictors consistently outperformed the other three models. However, using a complete set of predictors in the SVR models leads to the best RMSE and MAE, but not for MAPE. By utilizing data composition 3, SVR 2 model has a slightly better MAPE than SVR 4 model. The SVR 2 model using data composition 3 has greater prediction error variations but a better average of percentage errors than the SVR 4 model.
Evaluating the accuracy of the models utilizing single-source Internet data, Google Trends data resulted in better forecasts than online forum data for ANN and RF models. In contrast, online forum data yielded better forecasts than Google Trends data in the SVR model. The training complexity of Google Trends data might be higher than online forum data due to the greater number of attributes. In addition, the training complexity of SVM is indeed high (Cervantes et al., 2007). Despite the good theoretic foundations and accuracy, SVM does not perform well when the dataset contains more noise (Sarker, 2021). However, no single method can outperform other methods in all forecasting contexts (Li et al., 2020), and not all Internet data variables will improve the accuracy (Yang et al., 2015).
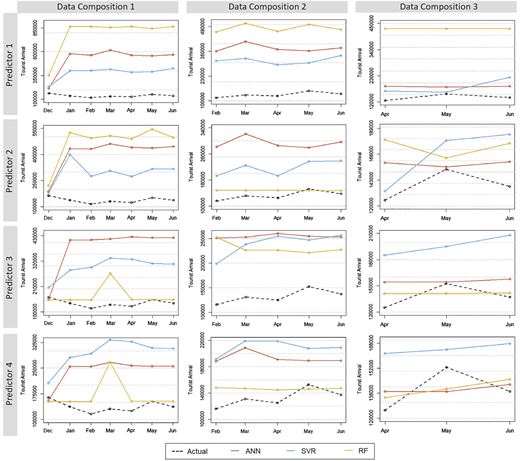
Figure 7 visually portrays the models' prediction results compared to the actual record of the international tourist arrivals in Indonesia. The training set of data composition 1 covers only two months of the pandemic (March to April 2020), resulting in a premature model's learning process leading to inaccurate forecasts with many overestimation cases. By utilizing data composition 2, the prediction results of the RF model improve when using predictors sets 2 and 4. However, the prediction results of this model have not captured the dynamics of tourist arrivals. Meanwhile, the results significantly improved when we applied data composition 3 and predictor set 4 for ANN and RF models. At the same time, the SVR model with data composition 3 cannot produce good predictions if we append Google Trends data due to increasing model complexity. In general, the prediction accuracy improves when we increase the training dataset covering the COVID-19 period and utilize a complete set of predictors.
Predicting tourist arrivals during the COVID-19 period is a nontrivial task. In nonroutine circumstances, we cannot rely only on standard historical statistical records to develop accurate forecasts. Nevertheless, alternative data are available. Search engine and online forum data are user-generated data that can be acquired publicly. This study has demonstrated that multisource Internet data can significantly improve the prediction accuracy of tourist arrivals under travel restrictions during the pandemic. This study confirms the usefulness of multisource Internet data for increasing the accuracy of tourist arrival predictions.
6. Conclusion and future works
This research presents machine learning models to predict international tourist arrivals in Indonesia during the COVID-19 using multisource Internet data, namely the TripAdvisor travel forum and Google Trends. The results show the positive impact of combining multisource Internet data to improve forecasting performance. Prediction models utilizing a combination of predictors from an online travel forum and a search engine have better accuracy than those using the predictor from a single source of Internet data, either the online travel forum only or search queries only. Moreover, our models have better performance than the prediction model that only uses historical tourist arrivals statistical records.
In developing the model, we decompose the training datasets into three partitions, namely (1) January 2017–April 2020 (the period when COVID-19 starts to gain popularity and infect Indonesian citizens), (2) January 2017–August 2020 (the period when the government implemented international travel restrictions) and (3) January 2017–December 2020 (the period when the government extended the international travel restrictions and implemented wide-scale social restrictions). The result indicates that the prediction model using the third training set performs best. These results are consistent across all investigated prediction models. Note that this third training set has the most extensive coverage of the pandemic situation. Thus, using more training sets covering the phenomenon of interest, such as COVID-19, will improve the prediction model's learning process and accuracy. In conclusion, the complete set of predictors and the third data composition applied to the RF model yielded the best prediction performance compared to ANN and SVR models.
Compared to the previous studies using the search query and online forum to predict tourist arrivals (Fronzetti Colladon et al., 2019; Sun et al., 2019; Huang and Hao, 2020), this study offers three contributions. First, this study pioneers the practice of a multisource Internet data approach in predicting tourist arrivals amid the COVID-19 pandemic. Second, this study has validated the use of multisource Internet data to improve prediction performance. Third, this is one of the few papers to provide perspectives on the current state of Indonesia's tourism demand.
In terms of managerial implications, the presented forecasting models can help tourism decision-making in many contexts, such as pricing strategies, allocating resources, planning tourism infrastructures and developing emergency plans (Li et al., 2018; Sun et al., 2019). The accurate forecasts reinforce the foresight capabilities of tourism decision-makers and policymakers, which can help the government to make better corresponding decisions in unexpected situations, such as the COVID-19 pandemic. Moreover, the fast-growing Internet data allows managers for in-depth analysis of visitor activities, interests and interactions, as well as their influence on tourism demand forecasting. The Internet data usage in tourism demand analysis offers several advantages, including timeliness, low cost (since it is open to the public) and good predictive power. Lastly, Internet data may help overcome survey data consumers' sample size constraints (Yang et al., 2015).
Not without limitations, this study opens for further research opportunities. First, this study only focuses on international tourist arrivals in Indonesia. The selected keywords are limited and solely represent this country's public interests and attention. Thus, further studies can investigate other search queries and travel forums relevant to their specific contexts. Furthermore, future studies can explore the application of multisource Internet data for different countries or destinations. Second, this study only uses two data variables extracted from an online forum. Other variables extracted from online forums, such as the sentiment index, which provides an overview of public response, can also be incorporated. In addition, more external factors can be further examined as input for the prediction model. Other data sources, such as Facebook, Twitter and other online forums, can be explored to enrich the training data during prediction model development.
Funding: This research received no specific grant from any funding agency in the public, commercial, or not-for-profit sectors.
Declaration of competing interest: Authors declare that there is no conflict of interest due to the publication of this paper.