I agree absolutely with Professor Grace when he says that the subsea forces on a pipe are worst for a pipeline parallel to the wave front (zero degree angle). I have found that even angles of 30–45° cause large forces on a pipeline.
I would like to ask the author why the inshore steel sheet piles were not extracted completely, thereby saving a potentially difficult underwater cutting job and also prevent any possible future protrusion through the nearshore seabed.
When designing treated effluent outfalls and cooling water intakes and outlets, I always research the pipe material options early on. Potential practical pipe choices nowadays are concrete (precast or prestressed pipe or box), high-density polyethylene, glass-reinforced plastic, steel or reinforced steel cylinder pipes. Medium-density polyethylene in particular has increased in popularity over the last two decades. Was there a review of various pipe materials before choosing RCP and, then, why was it chosen? I was a little surprised at the choice and wondered if another more flexible, easy-to-handle pipe material could have been selected.
It was interesting to note that the storms of November 1982 coincided with those experienced at Libya's Ras Lanuf harbour construction where damage was done to a nearly completed breakwater, of which I was the consultant's supervising breakwater engineer at the time. As a UK commercial diving engineer with many year's experience, I was delighted to read that the Monteray Region Water Pollution Control Agency's in-house diving engineers were used on the project.
Regarding the author's query on whether more natural rock settlement or marine growth cementing would have reduced the rock armouring damage, I doubt that it would have made the slightest difference. I have not seen cementing together of rock by marine organisms such that any interlocking or inter-rock friction is increased. It usually comes down to the size and quality of rock placed.
The lack of diver access in the outfall is not good practice. The length between access manholes should be no greater than 150 m. Having dived inside pipelines, it is comforting to know the worst-scenario swim length is no more than 75 m each way; even that is a long way with all the gear divers have to carry. Unfortunately the designers (and their clients) of outfalls and other pipelines requiring internal access are often not thinking of the huge difficulties and dangers later involved by deciding to eliminate or reduce access points on cost or other grounds.
The 730 m length of diver's umbilical during the pipeline's internal inspection was indeed extraordinary. So much so that I would like to know how the inspection passed a simple diving operations risk assessment and became approved. The longest umbilical that I have ever dived with in an internal pipeline inspection was an arduous 175 m dive but that was inside a 2·4 m diameter pipe, not a 1·2-1·5 m size pipe. The biggest problem which I had was hauling the umbilical (comprising main air, pnemo, communications line and safety rope) all the way there and controlling its take-up on the return. It was one of my most exhausting dives ever because the weight and friction were high.
In my practical experience the minimum diameter for a fully kitted diver to fit through a vertical access manhole is 900 mm and not 724 mm. It is a tight squeeze and not safe.
Could you please tell me why sacrificial anodes were needed on a stainless steel plate for the duckbill valve pipe attachment?
Sakrete (or concrete bagwork in the UK) is not suitable for filling the voids of rock-armoured pipelines (or in fact any rock or precast concrete armouring). The bags inevitably break up in that extreme environment. The US National Oceanographic and Atmosphere Administration objections would be the least of one's problems. Manually placed rock, although slow, would be suitable. However, never skimp on rock sizes, always over-design. The theory never matches the reality under water.
I agree with Professor Grace in respect of access for divers/remotely-operated vehicles but would suggest close spacings for manholes.
I agree with not placing pipelines parallel to wave fronts.
It is essential to plan ahead with underwater marine works as far as possible and do not start on site in late good-weather season.
Rock cover to pipe diffusers is fine but perhaps the openings (ports) could come up vertically in the crown into the riser pipes instead and then flow out horizontally through duckbill valves.
Pipeline stability is best when the line is buried as much as possible.
Author's reply
The author appreciates the interest shown by the discusser, as well as his support on certain topics, and attempts below to answer his questions and comment on his assertions. It should be clearly understood that the author's paper was largely technical and environmental ‘reportage’; he was not directly involved in any design, construction, or maintenance decisions.
Results from the author's many years of ocean experiments involving wave forces on fully exposed pipes suggest that the peak horizontal wave load per unit length (fMAX) depends on (cosθ)1·471 where θ is the angle between the pipe and the wave front. When θ = 45°, for example, fMAX is 60% of the θ = 0° case, certainly a significant proportion as the discusser suggests.
The discusser's query about sheet pile extraction is a good one. In fact the tops of the cut-off sheet piles for the San Francisco outfall, mentioned in the paper, have become exposed and are causing problems for beachgoers in the area. Usual US practice, at least for segmented pipes, is not to extract the sheet piles because such action could possibly affect joint integrity as some nearby backfill is drawn upwards and/or shifts laterally.
There is no question that reinforced concrete is the favoured material for large outfalls in the United States. The biggest reason is 'self weight’. The discusser's term ‘easier to handle’ is an interesting one. The author considers that if a pipe can be installed with ease, then natural forces can later remove it with ease. The concrete-collared Green Point HDPE outfall off Cape Town, South Africa, destroyed twice, is a case in point.
It is interesting that November 1982 produced a Mediterranean Sea storm that affected a Libyan breakwater. Whether this event was also due to the El Niño phenomenon is unknown to the author.
The discusser is clearly an experienced work and inspection diver, shifting from project site to project site. The author has logged roughly 3000 work and inspection dives, over three decades, and has often revisited old sites, including rock-armoured outfalls. It is only after two or more years of existence in the marine environment that substantial colonisation of rock surfaces and edges can be observed, but it does happen in time, and it does have a tendency to provide some binding to an array of rocks. The discusser's time on specific jobs may not have been long enough to observe this transition.
The author notes the discusser's personal preference for 150 m maximum manhole spacing and agrees that common design practice, particularly in the USA, produces distances that are excessive, sometimes up to the entire length of the outfall.
During the large-excursion inside-the-pipe work on the Monterey Bay outfall, it is the author's understanding that a second diver was always in attendance at the bottom of the junction structure so as to feed hose to the outgoing work diver and pull it back upon his/her return. The author understands further that floats were used to assist the pipe divers in transit by supporting the buoyant weight of tools and seals.
Apparently the diameter of the vertical diver access pipe, at the design stage, was 900 mm. The author does not know who changed this dimension and for what reason. Since this was a rapid-fire project, use may simply have been made of a pipe already ‘in the yard’.
It is the author's personal experience that certain types of stainless steel pit quickly and severely in the marine environment. The designer of the duckbill valve ensembles may have had this type of problem in mind when specifying the incorporation of sacrificial anodes.
Apparently the author did not make it clear that the bags of Sakrete were to act, when hydrated, as essential rocks. The author has done exactly this, in some cases, to provide bulk quickly, but agrees with the discusser that such ‘rocks’ can easily disintegrate. There was no intent to try and fill voids with the Sakrete; the aim was to place something, to further protect the diffuser, before the immediate onslaught of winter storms.
The discusser may be interested to know that the author has developed the following equation for determining the incipiently unstable (basalt) rock diameter d for a long-period ocean design wave
Here H is the wave height and h is the still water depth.
The author agrees with the discusser that outfall burial is best. But when seabeds are hard (as off Wollongong, Australia) and blasting is forbidden on environmental grounds, then one is forced to accept a suboptimal exposed pipe. This is where the outfall designer truly earns his or her pay.
The author is congratulated and thanked for an interesting and valuable case history of this project.
The paper describes storm damage costing millions of dollars, the unusual large numbers of storms during the damage period and the substantial amount of spectral energy linked to long wave periods, with typically about 50% of the total energy applying to periods longer than 16 s. Comparison is then made between a 'standard’ wave period of 14 s and a substantially longer period of 19 s.
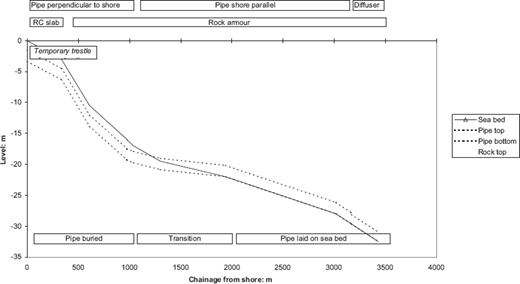
Figure 3 illustrates the longitudinal profile and some key features inferred from the paper. Opportunity to verify this and other assumptions made in this contribution has not been possible.
It is assumed that most of the rock denuded from the outfall was in the shore parallel section, starting from a water depth of about 16 m where pipe begins to emerge from the trench, and deeper where the rock is above or partly above sea bed. Cross-sections of the rock armour are not given but the rock size and sandy sea bed material are assumed to comprise a layer of graded rock up to or slightly below pipe crown, overlying smaller filter stone laid on the sand.
The 11·9 m significant wave height and the 15·3 m water depth referred to in the paper are taken here with a rock density of 2600 kg/m3 and water density 1026 kg/m3. Assuming a rock slope of 1 in 2·5 and internal angle of friction of 45, then for the wave orbital velocities quoted in the paper, sizes for embedded rock can be calculated as shown in Table 5.
These are similar to the values of D50 and W50 inferred from Table 4 of the paper. The difference of about 20% in the velocities as quoted results in an increase of about three times in rock weight but 40% in rock diameter and layer thickness.
For comparison, using Airy waves, the orbital velocities for the same wave height, water depth and wave periods (11·9 m, 15·3 m, 14 s and 19 s), are much closer, at 4·45 m/s and 4·61 m/s. The velocity is about 4% greater for the longer period wave, the corresponding rock weight would be about 24% greater and the rock size and layer thickness about 10% greater. Airy waves then, for the same height, would be less sensitive to wave period. However, the breaking wave height, according to BS 6349: Part 131 and Goda,32 would be slightly smaller for the short period wave and slightly larger for the longer period wave, giving velocities of 4·3 m/s and 4·7 m/s. The rock size and layer thickness would in these four cases be the same or slightly greater than those obtained using the velocity for the longer period wave in the paper.
Alternative methods for calculating wave-induced bottom velocity, for example Soulsby and Smallman,33 and for rock size and the choice of mean or peak period, the joint probability of wave, current and tide level return periods and the acceptable level of damage, collectively give a range of rock sizes. This is inherent in this field of applied science: skill and caution are required.
Rock size is also sensitive to the slope at which it is placed and to the internal angle of friction, as Table 6 shows using a velocity of 4·3 m/s.
An alternative approach, using Van der Meer equations for submerged rock as published in CIRIA/CUR34 and CUR,35 for water depth 15·3 m, Hs 11·9 m, rock 1 m above sea bed, slope 1 in 2·5, damage S = 2, gives the rock sizes shown in Table 7.
The rock size and layer thickness for the shorter period in this case is similar to that obtained using Airy waves as above. Rock weight for the longer period waves is about 40% larger: rock size and layer thickness are about 10% greater than for the shorter period.
Taking a typical spectrum, the peak period, Tp, for a mean period, Tm, of 14 s is about 18 s. With variables in the van der Meer equations based on mean period, there is thus reasonable agreement in this case in rock size arrived at two approaches: (a) using Airy waves and (b) van der Meer submerged rock.
Published data on submerged rock for pipelines are few and in standards or established manuals there is no agreed technique for sizing rock armour for pipe trenches. To have in effect a prototype history presents an opportunity to benchmark performance.
Can the author please elaborate on data for the tests mentioned in paper, the methods used on this project for deriving rock size from wave orbital velocity? Can the author also discuss further the amount and extent of damage of the two original rock armour sizes, related to water depth and waves, and the storms and performance of the rock armour since repair?
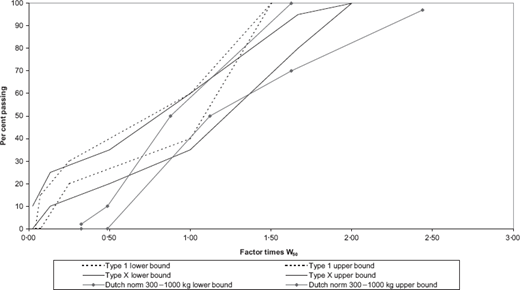
Figure 4 shows the grading of the two rock sizes, Type 1 and Type X. These are wide gradings rather than 'single size’. For comparison, the figure also shows the grading for rip-rap as given by Dutch norm NEN 518036. The lower bound value of rip-rap given by PIANC37 and the CIRIA38 grading for rip-rap are broadly similar in shape to the Dutch norm. The grading in the Dutch norm is also included in the CIRIA/CUR rock manual.4 The PIANC grading has W50 on the lower bound line and therefore gives a slightly more conservative result. Type 1 and Type X compare with the CIRIA/CUR grading, but contain a higher proportion of smaller rock.
Can the author please comment on the grading chosen and the risk of losing fines from the matrix and whether on this project there was any evidence of loss of small sizes while larger rock particles in the matrix remained in place. Can the author also please elaborate on the placing techniques adopted and any precautions to avoid segregation.
Author's reply
The author declined to reply to this discussion.