


This study aims to analyse the impact of different types of brand hate on consumer-based brand equity (CBBE), with particular reference to the Millennial generation.
A quantitative study was conducted to answer the research questions. The conceptual model and the research hypotheses were developed to test the impact of different types of brand hate on consumer-based brand equity. Specifically, brand hate was studied, dividing it into active and passive forms. CBBE was observed to comprise three sequential phases: Brand Building Block, Brand Understanding Block and Brand Relationship Block. To test this model, an online survey was conducted among 821 respondents and a structural equation model (SEM) was used to test the research hypotheses.
The results show that active brand hate negatively affects CBBE, while passive brand hate positively affects CBBE. Specifically, active brand hate has a substantial negative impact on the relationship block and a weaker negative effect on the building block. In contrast, passive brand hate, unlike active brand hate, has a higher positive impact on the relationship block.
This study is the first to investigate the impact of active and passive brand hate on CBBE, providing advanced insights into brand hate and starting a new line of research based on the separate analysis of different types of hate, on the one hand and the three sequential blocks of CBBE, on the other. This research extends the brand hate framework by introducing intensity and behavioural activation as critical differentiators.
1. Introduction
Different consumers can have different opinions and emotions about products or brands. Some love brands, others are indifferent, and others have negative attitudes toward them (Aro and Suomi, 2024; Khan and Lee, 2014). It can also happen that people love certain aspects of something and hate others at the same time, experience alternations of positive and negative feelings (Zarantonello et al., 2018), or that a love relationship can subsequently transform into hate (Sakulsinlapakorn and Zhang, 2019). Consequently, many brands simultaneously have both lovers and haters (Ramírez et al., 2019, 2024).
Brand hate – which is the strongest and most detrimental negative emotion that consumers can feel towards a brand – has not yet received the same attention that scholars have given to brand love (Brandão and Popoli, 2022; Kumar et al., 2023; Rauschnabel et al., 2024; Zarantonello et al., 2016; Zhang and Laroche, 2020). Despite growing scholarly attention to understanding negative emotions, the literature still appears to be fragmented and asks for more comprehensive studies to conceptualise brand hate and the behaviours that result from it (Aziz and Rahman, 2022; Hashim and Kasana, 2019; Kumar et al., 2023; Mushtag et al., 2024; Taqi et al., 2024; Walter et al., 2023; Veloutsou and Guzmàn, 2017; Zhang and Laroche, 2020). Furthermore, according to Ajina et al. (2025), these studies should also be conducted by distinguishing between generational cohorts.
Given this need for further investigation, this work aims to provide an advance in the knowledge of the impact of brand hate on brand equity and, in particular, on consumer-based brand equity (CBBE), which, among the various conceptualisations, represents the most commonly adopted (Veloutsou et al., 2020) and is rich in managerial implications for the definition of marketing strategies and tactics (Keller, 1993, 2003).
According to Keller (1993), customer-based brand equity is “the differential effect of brand knowledge on consumer response to the brand's marketing”. It occurs “when the consumer is familiar with the brand and holds some favourable, strong, and unique brand associations in memory” (p. 1).
Furthermore, according to the most recent literature, the CBBE should be theorised as a process rather than a construct (Chatzipanagiotou et al., 2019) and, in particular, as a process that includes three sub-systems, namely the “Brand Building Block (BBB)” focused on defining the brand's identity and its positioning in the minds of consumers; the “Brand Understanding Block (BUB)” focused on brand awareness and brand-generated associations; and the “Brand Relationship Block (BRB) focused on the elements that characterise the consumer-brand relationship” (Chatzipanagiotou et al., 2016).
Based on these premises, this study aims to investigate the impact of brand hate on the three specific blocks, introducing, as a further originality, the distinction between active and passive hate to obtain a more detailed picture of the link between brand hate and CBBE. Therefore, this study aims to fill a gap in the literature and managerial practices by detailing both the concept of brand hate, breaking it down into active and passive, and the concept of CBBE, considering it as a process consisting of distinct phases.
This detailed analysis of both brand hate and brand equity also allows us to identify distinct managerial implications based on the type of consumer behaviour driven by the intensity of hate, thereby providing valuable insights for managing the consumer-brand relationship.
A further originality of the work is the analysis of consumer behaviour, with particular reference to the generation known as “Millennials”, also called “Generation Y”, individuals born between 1981 and 1996.
This generation is relevant to this study for several reasons: (1) it is perceived as more emotional and less loyal than others (Bilgihan, 2016), and brand equity is a crucial precursor of loyalty; (2) it is known to have a unique attitude towards brands and marketing (Lazarevic, 2012); (3) it is very digital and disruptive. According to Mangold and Smith (2012), we are dealing with a highly online generation that considers computers and cell phones essential tools in their daily lives. For these reasons, we wanted to understand and measure a disruptive generation's extreme feelings and behaviours in its thinking and reactions, investigating them across three continents (America, Asia, and Europe).
The research questions to be answered are:
Do active and passive brand hate have the same impact on CBBE?
What are the effects on the three blocks of the CBBE?
A quantitative methodology was used to answer these research questions, and an online survey was used as the data collection method. Firstly, to carry out the study, SPSS was used for data coding. Subsequently, the research hypotheses were tested using the partial least squares-structural equation modelling (PLS-SEM). This approach can be applied to multiple situations and is equivalent to multiple regression analysis, which aims to explain the variance in the dependent variables and, at the same time, evaluate the quality of the data (Hair et al., 2011). To run the PLS-SEM, Smart PLS 3.0 was used.
The results answer the first research question by showing that active brand hate negatively affects CBBE, whereas passive brand hate positively affects CBBE. As for the second research question, the results allow us to distinguish the effects of active and passive brand hate across the three blocks of CBBB. In detail, results show that active and passive brand hate have a higher impact on the Brand Relationship Block and a lower impact on the Brand Building Block. From a managerial perspective, this study can help brands and companies manage the dark side of the brand-consumer relationship. Understanding these kinds of feelings can help firms recognise, respond to, and even prevent brand hate, creating specific marketing policies that can remove or reduce hate towards the brand, as well as fostering active participation in spreading positive feelings about the brand in the market.
2. Theoretical background and research design
2.1 Consumer-based brand equity (CBBE)
In today's marketplace, a company's success is attributable to its brand's power, that is, the level of awareness, the strength of associations, and overall brand attitudes (Keller, 2003; Oh et al., 2020).
In the literature, brand equity has been measured across three levels: the customer level, company or firm level, and financial market level (Baalbaki and Guzmán, 2016). Among these, the most used one is consumer-based brand equity (CBBE), defined by Keller (1993) as “the differential effect of brand knowledge on consumer response to the marketing of the brand” and occurs “when the consumer is familiar with the brand and holds some favourable, strong, and unique brand associations in memory” (p. 1). Similarly, Christodoulides and de Chernatony (2010) define CBBE as “a set of perceptions, attitudes, knowledge, and behaviours on the part of consumers that results in increased utility and allows a brand to earn greater volume or greater margins than it could without the brand name” (p. 48).
Most studies consider CBBE a multifaceted and multidimensional construct, as noted by Buil et al. (2013). However, Chatzipanagiotou et al. (2016) proposed a more holistic vision of CBBE, arguing that it should be theorised as a process rather than a construct. In their work, Chatzipanagiotou et al. (2016) consider CBBE as a complex overall process that “includes separate development stages under which a sub-system of closely interrelated concepts lies, and empirically demonstrates the building blocks and various combinations that result in high CBBE” (p. 5479). The authors identified three sub-systems: the Brand Building Block, Brand Understanding Block, and Brand Relationship Block.
The Brand Building Block. The process starts with brand-building activities, where the main goal is creating a brand position in consumers' minds (Chatzipanagiotou et al., 2016). This block includes functional-related brand elements (brand quality, competitive advantage, leadership) and experiential-related (personality, heritage, and nostalgic elements) that serve as structurally interrelated components of the brand's initial building (Chatzipanagiotou et al., 2016, 2019; Veloutsou et al., 2020).
The Brand Understanding Block. The Brand Understanding Block consists of brand awareness, associations, reputation, and self-connection (Chatzipanagiotou et al., 2016, 2019; Veloutsou et al., 2020). Therefore, it connects to the previously quoted definition provided by Keller (1993) of customer-based brand equity. In this way, it's crucial to understand the content and structure of brand knowledge, as they influence what comes to mind when a consumer thinks about a brand (Keller, 1993).
The Brand Relationship Block. The components of the Brand Relationship Block are partner quality, intimacy, trust, and relevance. This block includes this kind of node to capture the dissimilar aspects of consumers' overall relationship with the brand (Chatzipanagiotou et al., 2016, 2019).
This breakdown of brand equity into process phases opens up a new field of inquiry in brand management studies. Therefore, our study addresses a previously unexplored topic in the literature: the analysis of how brand hate influences the three specific building blocks. Furthermore, this study's originality lies in its analysis of the distinction between active and passive hate and their different impacts on each of the three components of CBBE. This disaggregation of both brand hate and CBBE into their respective components has important conceptual and managerial implications.
2.2 Brand hate
Brand hate is the strongest negative emotion that a consumer can experience towards a brand (Fetscherin, 2019; Pinto and Brandão, 2021; Zarantonello et al., 2016) due to an intense feeling of anger or disgust (Alba and Lutz, 2013; Dessart et al., 2020; Kucuk, 2019) or even repulsion (Dessart and Cova, 2021). Similarly, Hegner et al. (2017) designate brand hate as a “more intense emotional response that consumers can have toward the brand than brand dislike” (p. 14). Some authors note that the concept of brand hate is multidimensional. For instance, Sternberg (2003) believes that brand hate is based on three components: the negation of intimacy (disgust), passion (anger/fear), and commitment (devaluation/diminution) and that seven types of hate arise from their combination: “cool hate”, “hot hate”, “cold hate”, “boiling hate”, “simmering hate”, “seething hate “and “burning hate”. These different types of hate generate distinct consumer behaviours, depending on the intensity of the feeling and the consumer's willingness to express it, including investing time and energy in concrete actions to combat brands. Therefore, even for hate, it is possible to think of a gradation that depends on many factors, such as the intensity of the emotions and the consolidated relationship between the brand and the consumer (Banerjee and Goel, 2020; Bayarassou et al., 2025).
Regarding the antecedents, the literature offers a consensus on the reasons behind hate, which can be traced to emotional, ideological, and cultural factors, linked to the experience of consuming goods or services, and which are sometimes also relevant independently of actual consumption (Junior Ladeira et al., 2026). It is crucial to consider the antecedents of brand hate because controlling and eliminating the reasons that lead to it eliminates brand hate (Brandão and Popoli, 2022; Dessart and Cova, 2021; Kucuk, 2021).
Furthermore, many studies have addressed the transition from positive feelings of love to negative feelings of hate (Johnson et al., 2011; Zarantonello et al., 2018), but have not devoted the same attention to the reverse phenomenon, that is, the transition – and sometimes the reversion – from negative to positive feelings, due to the consumer's willingness to “forgive” in response to concrete corrective actions implemented by the brand (Fetscherin and Sampedro, 2019; Donovan et al., 2012). From a managerial perspective, this further reinforces the need for brands to identify the causes of hate, the intensity of the negative feeling, and the resulting behaviours, and, consequently, to assess the feasibility of appropriate and differentiated corrective actions in each case.
Generally speaking, Bryson et al. (2013) argue that an essential outcome of brand hate is “the purposeful and deliberate intention to avoid or reject a brand, or even to act out behaviours that demonstrate this rejection, such as voicing negative feelings, blogging, protesting in public, boycotting, or even sabotage of company property” (p. 395). In other words, hate leads consumers to adopt different behaviours and strategies, such as “attack strategies”, “avoidance strategies”, or “approach strategies” to deal with it (Hegner et al., 2017; Zarantonello et al., 2016). Some avoid hated brands; others express anger or annoyance when communicating and interacting on social media or posting on hate websites (Zarantonello et al., 2016); others try to destroy the brand image and reputation through even more incisive and harmful activities.
Very relevant to the objectives of this study is the distinction between “passive behaviour” and “active behaviour” made by Henger et al. (2017), which forms the conceptual basis for the separate analysis of the impact of the two types of hate on brand equity. In detail, Hegner et al. (2017) distinguish the simple “brand avoidance” from other stronger reactions that imply a more active behaviour against the hated brand, which can be demonstrated through “brand retaliation” (Hegner et al., 2017), “negative word of mouth” (Hegner et al., 2017), and “willingness to make financial sacrifices to hurt the brand” (Fetscherin, 2019).
Regarding the underpinning feelings, active brand hate includes anger, contempt, and disgust; passive brand hate includes fear, disappointment, shame, and dehumanisation (Zarantonello et al., 2016). Passive brand hate is known as “attitudinal brand hate”, and active brand hate is “behavioural brand hate” (Kucuk, 2018; Zarantonello et al., 2016).
A first type of active behavioural outcome is negative word of mouth, when an individual speaks or writes negatively about a brand to inform others about their bad experience (Hegner et al., 2017; Kurtoğlu et al., 2025). It is recognised that customer dissatisfaction influences post-purchase actions, such as complaining behaviour and negative word of mouth, which is feedback voiced with others (Nyer and Gopinath, 2005). In this regard, the literature has distinguished two types of negative word of mouth: private and public complaining (Christodoulides et al., 2012; Fetscherin, 2019; Hegner et al., 2017; Nyer and Gopinath, 2005). Private complaints occur when consumers share their thoughts and feelings with people close to them (family or friends) to alert them to potential negative experiences with a brand and to protect them from them (Fetscherin, 2019). On the other hand, public complaining addresses primary audiences and can be expressed through online posts on blogs, social media, or websites (Hegner et al., 2017; Villarroel Ordenes et al., 2019).
Another type of active behavioural outcome is brand retaliation, an act of revenge, meaning that haters aim to do something harmful to the brand. Brand retaliation is a construct with different steps; it can be simultaneous or complemented by the negative word of mouth and the online spread of these complaints (Pinto and Brandão, 2021). The main goal is to hurt brands in order to “get even” (Bechwati and Morrin, 2003; Hegner et al., 2017). Finally, active behaviour includes participating in the increasingly widespread anti-brand communities to share negative judgements and accusations against a brand and to engage in anti-branding activities (Brandão and Popoli, 2022; Kucuk, 2018).
Based on this theoretical framework regarding active brand hate, a first set of research hypotheses we formulate for this investigation concerns the impact of active brand hate on each of the components of CBBE, therefore.
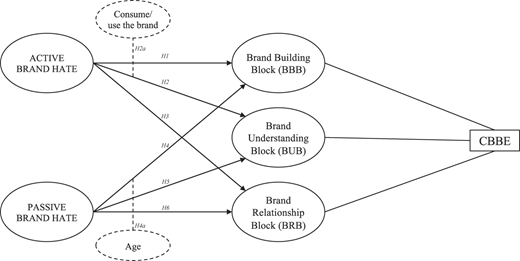
Active brand hate has a negative and significant impact on the Brand Building Block.
Active brand hate has a negative and significant impact on the Brand Understanding Block.
Active brand hate has a negative and significant impact on the Brand Relationship Block.
A second set of research hypotheses concerns the impact of passive brand hate on brand equity, that is, whether and to what extent a lower intensity of negative feelings toward the brand affects its value. In these cases, consumer behaviour is limited to the manifestation of brand avoidance, which, according to Hegner et al. (2017), “is expressed by consumers turning their back on the specific brand and, therefore, avoiding the brand by either switching to a competitor or not consuming the brand at all” (p. 15).
According to emotional regulation theory (Gross, 2014), consumers activate a process of cognitive and emotional reinterpretation in relation to their consumer experience. Specifically, in situations characterised by frustration or service failure, consumers activate an emotional regulation process to maintain an emotional balance consistent with their identity, goals, and relationship with the brand (Bagozzi et al., 2017). Consumers often reinterpret the event that generated dissatisfaction or betrayal, reducing its intensity or attributing blame to external factors, in order to preserve the continuity of the relationship (Fournier, 1998) and avoid an irreversible breakdown. Therefore, passive brand hate represents a low-arousal, non-retaliatory negative orientation characterised by emotional distance rather than active hostility.
This positive consumer attitude is a prerequisite for the brand to regain trust, legitimacy, and relational value through a process known as “brand redemption” (Gregoire et al., 2009). Furthermore, as a form of low-intensity behavioural negativity that does not disrupt the relationship (Fournier, 1998), passive hate can strengthen brand salience (Keller, 1993), brand discourse (Godes and Mayzlin, 2004; Berger and Milkman, 2012; ul Hassan et al., 2026), and cultural branding (Holt, 2004), which are factors that fuel brand knowledge (Ahluwalia et al., 2000), “even in the presence of negative affect, conflict, and ambivalence” (Fournier, 1998, p. 363).
Therefore, to investigate whether or not passive hate could trigger a process of brand reinterpretation (Holt, 2004) and produce positive effects on the CBBE, the following research hypotheses are formulated which, similarly to the case of active hate, refer to each of the components of the CBBE, therefore.
Passive brand hate has a positive and significant impact on the Brand Building Block.
Passive brand hate has a positive and significant impact on the Brand Understanding Block.
Passive brand hate has a positive and significant impact on the Brand Relationship Block.
A third group of research hypotheses concerns the identification of variables that may moderate the relationship between active/passive hate and CBBE. A first variable that could play a moderating role is whether the consumer has had a prior relationship with the brand through consumption or use (Rasouli et al., 2025). This circumstance could, in fact, influence the associations the consumer forms with the brand, the reputation they attribute to it, their self-confidence, and anything else that comes to mind when they think of a brand (Keller, 1993). These aspects, particularly significant when the consumer harbours a strongly negative feeling toward the brand, relate specifically to the Brand Understanding Block component. Therefore, the resulting research hypothesis is the following.
The strength of the association between active brand hate and Brand Understanding Block differs across previous consumer experience groups (vs no consumption or no use).
A second variable we believe could moderate is consumer age, which could significantly shape the brand's positioning in the consumer's mind, i.e. in relation to the Brand Building Block component. Therefore, the resulting research hypothesis is the following.
The strength of the association between passive brand hate and Brand Building Block differs across younger (vs older) consumer age groups.
Accordingly, a new conceptual model based on the following research hypotheses was developed (Figure 1).
3. Methodology
3.1 Procedure
A quantitative research methodology approach was conducted through an online questionnaire. The survey was divided into five sections. Initially, the respondents were free to think of a brand they had negative feelings toward, similar to previous studies such as Curina et al. (2020), Fetscherin (2019), Hegner et al. (2017), and Zarantonello et al. (2016). This section was relevant for introducing respondents' knowledge of others' profiles, such as asking whether they had ever loved that brand and whether they had ever consumed it or were still consuming it, in line with previous studies (Brandão et al., 2023; Rodrigues et al., 2021). The second section is related to active and passive brand hate feelings; the third section is related to consumer-based brand equity; the fourth section is the most relevant reasons to have those emotions towards brands and behaviours that demonstrate hate; finally, the fifth section emphasises demographics (gender, age, and nationality).
The constructs were developed based on previously validated scales (Table 1). A seven-point Likert scale ranging from (1) = strongly disagree to (7) = strongly agree was used to measure each item. The authors use three items to measure anger. Four items were used to measure contempt and disgust. Active brand hate was measured with seven items. A scale from Zarantonello et al. (2016) that includes the emotions of fear, disappointment, shame, and dehumanisation was also used to measure passive brand hate. In total, passive brand hate was measured with eleven items. The CBBE was measured through a scale proposed by Veloutsou et al. (2020), adapted from Chatzipanagiotou et al. (2016, 2019). The scale comprises thirty-eight items. In detail, all the items of the brand blocks are in the Appendix. A pre-test was conducted before the survey.
Measurement scales of the study
| Scales | Authors |
|---|---|
| Active brand hate | Zarantonello et al. (2016) |
| Anger | |
| Item 1: I fell anger towards this brand | |
| Item 2: This brand makes me feel enraged | |
| Item 3: I feel furious at this brand | |
| Contempt and disgust | |
| Item 1: I feel disgusted by this brand | |
| Item 2: I have a feeling of revulsion to this brand | |
| Item 3: I feel contempt for this brand | |
| Item 4: I have a feeling of loathing to this brand | |
| Passive brand hate | |
| Fear | |
| Item 1: I feel anxious when I think about this brand | |
| Item 2: I feel fearful when I think about this brand | |
| Item 3: I feel threatened when I think about this brand | |
| Item 4: I feel worried when I think about this brand | |
| Disappointment | |
| Item 1: I feel disappointed when I think about this brand | |
| Item 2: I feel displeased when I think about this brand | |
| Item 3: I feel disenchanted when I think about this brand | |
| Shame | |
| Item 1: I feel ashamed by what this brand does | |
| Item 2: I have a feeling of embarrassment when I think about this brand | |
| Dehumanisation | |
| Item 1: I have a feeling of dehumanisation when I think about this brand | |
| Item 2: I have a feeling of depersonalisation when I think about this brand | |
| Brand building blocks items | Veloutsou et al. (2020) adapted from Chatzipanagiotou et al. (2016, 2019) |
| This is a brand whose history is important | |
| This brand has a long history | |
| This brand has been around for a long time | |
| This brand has a strong personality | |
| This brand has a distinct personality | |
| I can describe this brand with adjectives I would use to describe a person | |
| This brand reminds me of things I have done or places I have been | |
| This brand reminds me of a certain period of my life | |
| This brand is good quality | |
| This brand has excellent features | |
| Compared to other brands in its category, this brand is of very high quality | |
| This brand is a leading brand in its category | |
| This brand is leading its category | |
| This brand tends to outperform its competitors | |
| This brand has a clear advantage over competitive brands | |
| There is a distinct benefit from using this brand over other brands | |
| This brand is superior to other brands in its category | |
| I have heard of this brand | |
| I am quite familiar with this brand | |
| I can recognize this brand among other brands | |
| This brand has strong associations | |
| This brand has favourable associations | |
| It is clear what this brand stands for | |
| This brand is highly regarded | |
| This brand has status | |
| This brand has a good reputation | |
| This brand and I have lots in common | |
| This brand reminds me of who I am | |
| This brand has always been good to me | |
| This brand treats me as important and valuable customer/user | |
| I really empathize with this brand | |
| It feels like I know this brand for a long time | |
| This brand delivers what it promises | |
| This brand's product claims are believable | |
| This brand has a name you can trust | |
| This brand is relevant to my family and/or close friends | |
| This brand fits my lifestyle | |
| This brand has personal relevance to me |
3.2 Sample
A sample of 930 surveys was initially reported. However, to ensure high data quality, we applied a screening process that removed responses that failed embedded attention checks, showed evidence of non-attentive responding through response-time analysis, or demonstrated unvarying response patterns. After using these filters, 109 responses were deemed unreliable and excluded, yielding a final dataset of 821 participants. For instance, some participants mentioned brands they love rather than those they have negative feelings about, or brands that don't exist (i.e. “no idea”, “yes”, “loved”, “I don't know”).
The respondents' demographic data were analysed using SPSS. A total of 821 (N = 821) valid answers were acquired. The sample demographic profile shows that most participants were male (N = 431, 52.5%). Considering age, the results indicate that just over half of the respondents were in the 20–30 age group (N. 425, 51.8%), followed by the 31–40 age group (N. 396, 48.2%). A high proportion of participants were American (N. 261, 31.8%), followed by Indian (N. 181, 22%) and Portuguese (N. 120, 14.6%). The remaining participants have other nationalities (Table 2).
Sample characterisation
| Category | n | (%) |
|---|---|---|
| Male | 431 | 52.5 |
| Female | 390 | 47.5 |
| Age (in years) | ||
| 20–30 | 425 | 51.8 |
| 31–40 | 396 | 48.2 |
| Nationality | ||
| American | 261 | 31.8 |
| Portuguese | 181 | 22 |
| Indian | 120 | 14.6 |
| Other | 259 | 31.6 |
| 821 | 100 | |
A demographic distribution comparison between the respondents and the target population was conducted to assess potential sample bias. The results indicated a close alignment, suggesting that the sample is representative.
The most hated brands identified were Nike (9.4%), Apple (5.5%), Coca-Cola (3.7%), Puma (3.4%), Adidas (3%), and Gucci (2.3%). Approximately 45.4% of the brands were mentioned only once or twice. In Table 3, all the brands that were mentioned at least three times are listed. It is important to note that 62.2% of the participants already loved the brand, and 82.7% had consumed or used it. Hence, 17.3% of the respondents reported hate feelings towards a brand without having consumed or used it.
Hated brands
| Frequency | Percentage | Valid percentage | |
|---|---|---|---|
| Nike | 77 | 9.4 | 9.4 |
| Apple | 45 | 5.5 | 5.5 |
| Coca-cola | 30 | 3.7 | 3.7 |
| Puma | 28 | 3.4 | 3.4 |
| Adidas | 25 | 3 | 3 |
| Gucci | 19 | 2.3 | 2.3 |
| Zara | 15 | 1.8 | 1.8 |
| Nestlé | 14 | 1.7 | 1.7 |
| Amazon | 13 | 1.6 | 1.6 |
| 13 | 1.6 | 1.6 | |
| SHEIN | 12 | 1.5 | 1.5 |
| Samsung | 10 | 1.2 | 1.2 |
| H&M | 9 | 1.1 | 1.1 |
| Johnson&Johnson | 8 | 1 | 1 |
| Walmart | 8 | 1 | 1 |
| Xiaomi | 8 | 1 | 1 |
| Reebok | 7 | 0.9 | 0.9 |
| Bershka | 6 | 0.7 | 0.7 |
| Louis Vuitton | 6 | 0.7 | 0.7 |
| Pepsi | 6 | 0.7 | 0.7 |
| Sony | 6 | 0.7 | 0.7 |
| Tesla | 6 | 0.7 | 0.7 |
| Victoria's Secret | 6 | 0.7 | 0.7 |
| Chanel | 5 | 0.6 | 0.6 |
| Chick-fil-A | 5 | 0.6 | 0.6 |
| Colgate | 5 | 0.6 | 0.6 |
| Levi's | 5 | 0.6 | 0.6 |
| McDonald's | 5 | 0.6 | 0.6 |
| Dell | 4 | 0.5 | 0.5 |
| Lenovo | 4 | 0.5 | 0.5 |
| Primark | 4 | 0.5 | 0.5 |
| Tommy Hilfiger | 4 | 0.5 | 0.5 |
| Dove | 3 | 0.4 | 0.4 |
| Forever 21 | 3 | 0.4 | 0.4 |
| Fila | 3 | 0.4 | 0.4 |
| LUX | 3 | 0.4 | 0.4 |
| MAC | 3 | 0.4 | 0.4 |
| Mango | 3 | 0.4 | 0.4 |
| Pantene | 3 | 0.4 | 0.4 |
| TAP | 3 | 0.4 | 0.4 |
| Tylenol | 3 | 0.4 | 0.4 |
| L'Oreál | 3 | 0.4 | 0.4 |
| Other | 373 | 45.4 | 45.4 |
| Total | 821 | 100 | 100 |
3.3 Structural equation modelling
The research hypotheses were tested using PLS-SEM in SmartPLS 4.0, as the research examines a theoretical framework from a predictive perspective and includes multiple constructs and indicators (Hair et al., 2019). We started with the reliability and validity tests (Hair et al., 2019). To assess the potential impact of multicollinearity among predictor variables, this research used variance inflation factors (VIFs) for all independent variables in the model.
4. Results
4.1 Reliability and validity of the measures
All items with loadings below 0.5 were eliminated (Bagozzi and Yi, 1988). The loadings for active brand-hate items ranged from 0.731 to 0.905 (Table 4). In the case of Passive brand hate, the items eliminated are related to the feeling of disappointment. The loadings ranged from 0.641 to 0.871 (Table 4).
Reliability and convergent validity of the measures
| Composite | Item | Standardised loading | CR | AVE | ⍺ |
|---|---|---|---|---|---|
| Active Brand Hate | 0.927 | 0.646 | 0.927 | ||
| I feel anger towards this brand | 0.731 | ||||
| This brand makes me feel enraged | 0.851 | ||||
| I feel furious at this brand | 0.905 | ||||
| I feel disgusted by this brand | 0.748 | ||||
| I have a feeling of revulsion to this brand | 0.741 | ||||
| I feel contempt for this brand | 0.774 | ||||
| I have a feeling of loathing for this brand | 0.857 | ||||
| Passive Brand Hate | 0.904 | 0.544 | 0.905 | ||
| I feel anxious when I think about this brand | 0.760 | ||||
| I feel fearful when I think about this brand | 0.812 | ||||
| I feel threatened when I think about this brand | 0.871 | ||||
| I feel worried when I think about this brand | 0.717 | ||||
| I feel ashamed of what this brand does | 0.641 | ||||
| I have a feeling of embarrassment when I think about this brand | 0.705 | ||||
| I have a feeling of dehumanisation when I think about this brand | 0.667 | ||||
| I have a feeling of depersonalisation when I think about this brand | 0.702 | ||||
| Brand Building Block | 0.933 | 0.521 | 0.933 | ||
| This brand has a strong personality | 0.585 | ||||
| This brand reminds me of things I have done or places I have been | 0.745 | ||||
| This brand reminds me of a certain period of my life | 0.642 | ||||
| This is a brand whose history is important | 0.598 | ||||
| This brand has a clear advantage over competitive brands | 0.657 | ||||
| There is a distinct benefit from using this brand over other brands | 0.821 | ||||
| This brand is superior to other brands in its category | 0.832 | ||||
| This brand is a leading brand in its category | 0.622 | ||||
| This brand is leading its category | 0.635 | ||||
| This brand tends to outperform its competitors | 0.655 | ||||
| This brand is good quality | 0.835 | ||||
| This brand has excellent features | 0.852 | ||||
| Compared to other brands in its category, this brand is of very high quality | 0.817 | ||||
| Brand Understanding Block | 0.864 | 0.517 | 0.868 | ||
| This brand has favourable associations | 0.701 | ||||
| This brand is highly regarded | 0.650 | ||||
| This brand has status | 0.602 | ||||
| This brand has a good reputation | 0.678 | ||||
| This brand and I have lots in common | 0.821 | ||||
| This brand reminds me of who I am | 0.832 | ||||
| Brand Relationship Block | 0.943 | 0.626 | 0.943 | ||
| This brand delivers what it promises | 0.825 | ||||
| This brand's product claims are believable | 0.800 | ||||
| This brand has a name you can trust | 0.790 | ||||
| This brand is relevant to my family and/or close friends | 0.764 | ||||
| This brand fits my lifestyle | 0.800 | ||||
| This brand has personal relevance to me | 0.790 | ||||
| I really empathise with this brand | 0.808 | ||||
| It feels like I know this brand for a long time | 0.680 | ||||
| This brand has always been good to me | 0.830 | ||||
| This brand treats me as an important and valuable customer/user | 0.812 |
Note(s): CR: Composite reliability; AVE: Average variance extracted; ⍺: Cronbach's alpha
Two items from the Brand Personality and brand Heritage blocks were removed from the Brand Building block. The loadings ranged from 0.585 to 0.852 (Table 4). The Brand Understanding Block comprises brand awareness, brand associations, brand reputation, and self-brand connection. All items from brand awareness and two items for brand associations were removed. Thus, loadings ranged from 0.602 to 0.832. Finally, the Brand Relationship Block maintained all the items proposed by Veloutsou et al. (2020), adapted from Chatzipanagiotou et al. (2016, 2019) (Table 4).
Hence, the results in Table 4 revealed that reliability was accomplished. Cronbach's alpha (⍺) values ranged from 0.868 to 0.943, all above 0.7, which is recommended (Hair et al., 2013). Furthermore, Composite Reliability (CR) values range from 0.864 to 0.943, which exceed the recommended values of 0.6/0.7 (Hair et al., 2019). Lastly, AVE was used to check the convergent validity. The AVE value should be 0.5 (Hair et al., 2011). For instance, values higher than 0.5 are adequate (Hair et al., 2011). Convergent validity was achieved since AVE values of constructs ranged from 0.517 to 0.646, and all of them were greater than 0.5. The Heterotrait-Monotrait Ratio (HTMT) was also used to assess discriminant validity.
Table 5 shows that the HTMT values are below 0.90, as recommended by Gold et al. (2001), thereby verifying the model's discriminant validity.
Heterotrait-monotrait ratio (HTMT)
| Active brand hate | BBB | BRB | BUB | Passive brand hate | |
|---|---|---|---|---|---|
| Active Brand Hate | |||||
| Brand Building Block | 0.147 | ||||
| Brand Relationship Block | 0.112 | 0.816 | |||
| Brand Understanding Block | 0.097 | 0.891 | 0.893 | ||
| Passive Brand Hate | 0.725 | 0.288 | 0.304 | 0.223 |
Moreover, the results showed that all VIF values were below the commonly accepted threshold of 5 (Hair et al., 2019), indicating no multicollinearity issues.
4.2 Hypotheses testing
The results reveal that all the hypotheses are supported (Table 6). Results indicate a significant but negative relationship between active brand hate and the blocks. By contrast, passive brand hate on brand blocks is significant and positive. In detail, the results revealed that active brand hate has a significant, negative impact on the Building Block (β = −0.153, t = 2.426, p = 0.015). Hence, H1 was supported. H2 was supported ( = −0.237, t = 3.727, p < 0.001). Active brand hate also negatively and significantly impacts the Relationship Block ( = −0.323, t = 5.551, p < 0.001). H3 was supported. Conversely, passive brand hate has a positive and significant impact on CBBE. Table 6 shows that H4 is supported ( = 0.404, t = 6.483, p < 0.001). Hence, H5 ( = 0.420, t = 6.754, p < 0.001) and H6 ( = 0.550, t = 9.571, p < 0.001) were supported.
Hypotheses testing
| Hypotheses | Loading | p-value | Conclusion |
|---|---|---|---|
| H1 Active brand hate → Brand Building Block (−) | −0.153 | p < 0.05 | Accepted |
| H2 Active brand hate → Brand Understanding Block (−) | −0.237 | p < 0.001 | Accepted |
| H3 Active brand hate → Brand Relationship Block (−) | −0.323 | p < 0.001 | Accepted |
| H4 Passive brand hate → Brand Building Block (+) | 0.404 | p < 0.001 | Accepted |
| H5 Passive brand hate → Brand Understanding Block (+) | 0.420 | p < 0.001 | Accepted |
| H6 Passive brand hate → Brand Relationship Block (+) | 0.550 | p < 0.001 | Accepted |
| H4a Moderating effect → Brand Building Block (−) | −0.103 | p < 0.1 | Accepted |
| H2a Moderating effect → Brand Understanding Block (+) | 0.082 | p < 0.1 | Accepted |
The moderating effects of age and consumption/use (i.e. having ever consumed the brand) were tested. H4a is supported ( = −0.103, p < 0.1). It shows that age moderates the relationship between passive brand hate and building blocks. Age attenuates the impact on the CBBE. The older the age, the smaller the effect. According to this result, respondents aged 31–40 tend to affect the Brand Building block negatively. The results showed that H2a was supported (β = 0.082, p < 0.1), indicating that consuming/using the brand, or having ever consumed or used it, moderates the relationship between active brand hate and the Brand Understanding Block. In this case, greater brand consumption/use would strengthen the negative relationship between active brand hate and the Brand Building Block.
4.3 Multi-group analysis
In this study, two multi-group analyses were performed. Firstly, the data were divided into the two most frequently mentioned brands in the survey (Nike and Apple) to examine whether there were differences in the path coefficients between the two groups. The estimated difference between groups is clearly shown in Table 7. The results show differences among path coefficients across the two brands. For Nike and Apple, significant differences were found for the relationship between active brand hate and the Building Block (p < 0.1) and between active brand hate and the Relationship Block (p < 0.1). For Nike haters, there was a strong positive relationship between active brand hate and the Building Block (0.515, p < 0.001).
Results multi-group analysis – brands
| Main hypotheses | Path estimates nike | Path estimates apple | Estimate difference (Nike-Apple) |
|---|---|---|---|
| H1: Active brand hate – BBB | 0.515*** | −0.171 ns | 0.686* |
| H2: Active brand hate – BUB | 0.089 ns | −0.386* | 0.475 ns |
| H3: Active brand hate – BRB | 0.028 ns | −0.453* | 0.481* |
| H4: Passive brand hate – BBB | 0.167 ns | 0.509** | −0.342 ns |
| H5: Passive brand hate – BUB | 0.368 ns | 0.615* | −0.247 ns |
| H6: Passive brand hate – BRB | 0.498*** | 0.725** | −0.227 ns |
| H4a: Moderating effect- BBB | −0.250 ns | −0.399 ns | 0.149 ns |
| H2a: Moderating effect- BUB | 0.150 ns | 0.047 ns | 0.103 ns |
Note(s): 2,000 bootstrap samples; *p < 0.1; **p < 0.05; ***p < 0.001; ns: not significant
In contrast, for Apple haters, the relationship was non-significant but negative (-0.171, p > 0.05). Regarding active brand hate and the Relationship Block, there was a strong negative relationship for Apple haters (gamma = −0.453, p < 0.1), whereas for Nike haters, the relationship was positive but non-significant. It is essential to note that for respondents who chose Apple as their hated brand, the emotions associated with active brand hate harm brand blocks, whereas those who chose Nike do not. These differences may be because Apple is frequently mentioned in brand-hate studies, such as those by Hegner et al. (2017), Kucuk (2019), and Rodrigues et al. (2021), as the most hated brand. In their study, Rodrigues et al. (2021) consider that Apple is not indifferent to people, but the consumer-brand relationship depends on positive or negative memories.
According to Ramírez et al. (2019), many brands simultaneously have a significant group of lovers and haters. Strong brands have many people who dislike or even avoid the brand (Veloutsou et al., 2020). Curina et al. (2021) concluded that technology brands experience high levels of brand hate, leading consumers to adopt both active and passive reactions. On the other hand, brands in the clothing and accessories sector have an intermediate/low level of brand hate, which leads to distancing behaviours. However, consumers may give the brand a second chance and forgive it (Curina et al., 2021). In this case, Nike has a non-negative impact on the CBBE, but Apple has an adverse effect.
To ensure the validity of the constructs across cultural contexts, this research conducted measurement invariance testing using the MICOM procedure (Henseler et al., 2016). Configural and compositional invariance were established for all constructs. Full measurement invariance was established across the three cultural groups (America, Asia, and Europe) for some of the constructs, confirming their comparability (Table 8).
Results of measurement invariance testing (MICOM)
| Constructs | Configural invariance | Compositional invariance (Permutation p-value) | Equal mean assessment | Equal variance assessment | Full measurement invariance established |
|---|---|---|---|---|---|
| Active Brand Hate | Yes | Yes (p = 0.731) | Not rejected | Not rejected | Yes |
| Passive Brand Hate | Yes | Yes (p = 0.716) | Not rejected | Not rejected | Yes |
| BBB | Yes | Yes (p = 0.732) | Not rejected | Not rejected | Yes |
| BUB | Yes | Yes (p = 0.648) | Not rejected | Rejected (H3/H4 significant differences) | Partial |
| BRB | Yes | Yes (p = 0.589) | Not rejected | Rejected (H5/H6 significant differences) | Partial |
| Moderating Effects | Yes | Yes (p = 0.702) | Not rejected | Not rejected | Yes |
The full/partial invariance across nationalities requirement was achieved, so cross-group structural comparisons are appropriate. Therefore, the data were divided into the three most frequently mentioned nationalities in the study (American, Portuguese, and Indian) to examine whether path coefficients differed across the three groups (Table 9).
Results multi-group analysis – Nationalities
| Main hypotheses | Path estimates American | Path estimates Indian | Path estimates Portuguese | Estimate difference (American-Indian) | Estimate difference (American-Portuguese) | Estimate difference (Indian-Portuguese) |
|---|---|---|---|---|---|---|
| H1: Active brand hate – BBB | 0.015 ns | 0.012 ns | −0.273 ns | 0.003 ns | 0.288 ns | 0.285 ns |
| H2: Passive brand hate – BBB | 0.382*** | 0.092 ns | 0.342 ns | 0.290 ns | 0.040 ns | −0.250 ns |
| H3: Active brand hate – BUB | −0.141 ns | 0.022 ns | −0.426 ** | −0.163 ns | 0.285 ns | 0.448 ns |
| H4: Passive brand hate – BUB | 0.435*** | 0.005 ns | 0.068 ns | 0.430** | 0.367* | −0.063 ns |
| H5: Active brand hate – BRB | −0.257** | −0.111 ns | −0.405** | −0.146 ns | 0.148 ns | 0.294 ns |
| H6: Passive brand hate – BRB | 0.604*** | 0.124 ns | 0.159 ns | 0.480** | 0.445** | −0.035 ns |
| H2a: Moderating effect- BBB | 0.021 ns | −0.155 ns | −0.186 ns | 0.176 ns | 0.207 ns | 0.031 ns |
| H3a: Moderating effect- BUB | 0.086 ns | 0.206 ns | 0.117 ns | −0.12 ns | −0.031 ns | 0.089 ns |
Note(s): 5,000 bootstrap samples; *p < 0.1; **p < 0.05; ***p < 0.001; ns: not significant
The results suggest some significant differences between path coefficients across the three nationalities. Among Americans and Indians, significant differences were found in the relationship between passive brand hate and the Understanding Block (p < 0.05) and passive brand hate and the Relationship Block (p < 0.05). For Indians, passive brand hate has no significant impact on the Understanding Block, whereas for Americans, passive brand hate has a considerable significant influence on the Understanding Block ( = 0.435, p < 0.001). The same goes for the Relationship Block. Passive brand hate significantly impacts the Relationship Block for Americans ( = 0.604, p < 0.001), whereas for Indians it's non-significant. Then, among Americans, a significant negative relationship was found between active brand hate and the Relationship Block ( = −0.257, p < 0.05). However, for Indians, active brand hate has a negative but non-significant impact on the Relationship Block. For Portuguese, there was also a strong negative relationship between active brand hate and the Relationship Block ( = −0.405, p < 0.05). It is important to note that, among Portuguese respondents, the relationship between active brand hate and brand blocks is negative. There were also significant differences between Americans and Portuguese consumers regarding the relationships between passive brand hate and the Understanding Block (p < 0.1) and passive brand hate and the Relationship Block (p < 0.05). The relationship between passive brand hate and the Understanding Block is non-significant among Portuguese consumers; however, it is significant among American consumers ( = 0.435, p < 0.001). The same occurs in the relationship between passive brand hate and the Relationship Block. For Portuguese, the relationship is non-significant ( = 0.159, p > 0.05), but it is pretty significant for Americans ( = 0.604, p < 0.001). Finally, there were no significant differences between the Indian and Portuguese groups.
4.3.1 Cultural contingencies in brand hate and CBBE
The multi-group analysis indicates that while the measurement structure of the constructs is invariant across national contexts, the structural relationships linking brand hate to consumer-based brand equity (CBBE) are culturally contingent. Results show that passive brand hate exerts a more substantial positive impact on CBBE among American consumers than among Portuguese and Indian consumers. In contrast, when Portuguese consumers experience active brand hate, this hostility translates into a significant adverse effect on CBBE, particularly within the Understanding Block and the Relationship Block. These asymmetries suggest that cross-context robustness resides at the construct level, but not necessarily at the level of behavioural or evaluative outcomes.
This pattern can be interpreted through the lens of culturally embedded norms governing emotional expression and marketplace agency. In more individualistic and lower power-distance environments, consumers may perceive greater legitimacy in expressing dissatisfaction through overt marketplace responses. Thus, passive hostility may be more readily converted into evaluative recalibration processes that reshape brand equity perceptions. Conversely, in contexts where relational norms and social harmony are more salient, active hostility may be more consequential once triggered, producing sharper negative shifts in brand meaning and relational attachment.
These findings align with prior research suggesting that the CBBE formation process may differ among consumers holding dissimilar negative brand dispositions (Veloutsou et al., 2020). The present results extend this insight by demonstrating that such differences are not only dispositional but also culturally structured. Culture shapes how negative affect is interpreted, regulated, and translated into brand-related cognitions. As Jakubanecs et al. (2019) argue, culture is central to its members' interpretive frameworks, influencing both the prevalence and expression of emotions. Accordingly, identical levels of brand hate may generate divergent equity outcomes depending on culturally conditioned display rules, norms of confrontation, and expectations regarding consumer–brand relationships.
Importantly, the distinction between passive and active brand hate becomes theoretically meaningful in this cross-national context. Passive brand hate appears more sensitive to cultural modulation, with its impact varying in magnitude across countries. Active brand hate, by contrast, may represent a more intense affective state that, once activated, produces pronounced equity erosion in specific cultural environments. Thus, cultural context functions as a boundary condition in the brand hate–CBBE relationship: the emotional construct itself remains structurally comparable, but its evaluative consequences are contingent on national context.
4.4 t-test independent samples
Additionally, the effects of the moderating variables were tested using the independent-samples t-test. The assumption of normality underlying the independent samples t-test was assessed. Given the large sample sizes in all groups (N > 30), the t-test is robust to minor deviations from normality under the Central Limit Theorem. In addition, inspection of the descriptive statistics indicated no extreme skewness or kurtosis, supporting the approximate normality of the data. Therefore, the usual assumption for the t-test was considered met. Results showed a significant difference in the scores for respondents who already hurt the brand (M = 4.54; SD = 1.17) and respondents who have not hurt the brand (M = 4.11; SD = 1.36) conditions (Table 10); t (541,591) = −4.572; p = 0.000 (Table 11).
Group statistics on anti-brand behaviour
| Have you ever engaged in any behaviour to demonstrate brand hatred? | N | Mean (M) | Std. Deviation (SD) |
|---|---|---|---|
| No | 572 | 4.11 | 1.36 |
| Yes | 249 | 4.54 | 1.17 |
t-test anti-brand behaviour (total brand hate)
| df | t | p-value | Mean difference | |
|---|---|---|---|---|
| Total brand hate | 541,591 | −4,572 | 0.000 | −0.427 |
As p-value <0.05, and the mean difference was negative (−0.427) (Table 11), individuals who have already adopted anti-brand behaviour have, on average, higher brand hate.
The same method was then used for total CBBE. Since the p-value <0.05, and the difference was positive (0.196) (Table 12), the consumers who have not had anti-brand behaviour have, on average, higher CBBEs.
t-test anti-brand behaviour (total brand hate)
| df | t | p-value | Mean difference | |
|---|---|---|---|---|
| Total CBBE | 522,186 | 2.24 | 0.026 | 0.196 |
An Independent-sample t-test was also performed for brand lovers and non-lovers concerning total CBBE. There was a significant difference in the scores for lovers (M = 4.45; SD = 1.11) and non-lovers (M = 3.43; SD = 1.08) conditions (Table 13); t (664,377) = −12.90; p < 0.000 (Table 14). The mean difference is negative (−1.015) (Table 14). Thus, individuals who have loved the brand have, on average, a higher CBBE.
Group statistics lovers/non-lovers
| Have you ever loved the brand? | N | Mean (M) | Std. Deviation (SD) |
|---|---|---|---|
| No | 310 | 3.43 | 1.08 |
| Yes | 511 | 4.45 | 1.11 |
t-test lovers/non-lovers (total CBBE)
| df | t | p-value | Mean difference | |
|---|---|---|---|---|
| Total CBBE | 664,377 | −12.90 | 0.000 | −1,015 |
Finally, Tables 15 and 16 show a significant difference in the scores for consumers/users (M = 4.21; SD = 1.19) and non-consumers/non-users (M = 3.40; SD = 1.06); t(819) = −7.50; p = 0.000. The mean difference was negative (−0.806) (Table 16). Therefore, individuals who have consumed/used the brand have, on average, a higher CBBE.
4.5 Nonlinear and moderation robustness analyses
To address potential functional-form misspecification, we conducted additional robustness analyses testing whether the relationship between passive brand hate and the CBBE blocks departs from linearity or depends on other affective dimensions. Consistent with our multi-group framework, quadratic and interaction specifications were estimated separately for the American (N = 265), Indian (N = 184), and Portuguese (N = 122) subsamples. Composite scores were constructed from the validated item sets for BBB, BUB, and BRB, and predictors were mean-centred within each country prior to computing higher-order terms.
To assess curvilinear effects, we added a squared term for passive brand hate to the baseline linear model. Nonlinear effects are not general across contexts. In the American subsample, the quadratic term is marginally significant for the Brand Understanding Block (BUB) (β = 0.052, p = 0.086), but not for BBB or BRB. In the Indian subsample, no significant curvilinear effects emerge for any CBBE block. In contrast, in the Portuguese subsample, the quadratic term is positive and statistically significant for BUB (β = 0.081, p = 0.040; ΔR2 = 0.033, p = 0.040), indicating a U-shaped association between passive hate and brand understanding. No significant curvature is observed for BBB or BRB in this group.
To examine conditional effects, we estimated moderation models including active brand hate as an interacting variable. In the American subsample, the Passive × Active interaction is not significant for BBB or BUB and only marginally significant for BRB (β = 0.077, p = 0.090). In the Indian subsample, interaction effects are uniformly non-significant. In contrast, for Portuguese respondents, the interaction term is positive and statistically significant for BUB (β = 0.077, p = 0.042; ΔR2 = 0.065, p = 0.015), indicating that the association between passive hate and brand understanding strengthens when active hate is simultaneously elevated. Interaction effects are not significant for BBB or BRB (Table 17).
Nonlinear and moderation robustness analyses by nationalities
| Panel A. Quadratic effects (Passive brand hate2) | ||||||
|---|---|---|---|---|---|---|
| Country | Outcome | β (passive2) | SE | p-value | ΔR2 | ΔR2 p-value |
| American (N = 265) | BBB | 0.022 | 0.031 | 0.475 | 0.002 | 0.475 |
| BUB | 0.052 | 0.030 | 0.086 | 0.011 | 0.086 | |
| BRB | 0.069 | 0.044 | 0.115 | 0.009 | 0.115 | |
| Indian (N = 184) | BBB | 0.020 | 0.038 | 0.593 | 0.002 | 0.593 |
| BUB | 0.010 | 0.040 | 0.796 | 0.000 | 0.796 | |
| BRB | −0.022 | 0.050 | 0.662 | 0.001 | 0.662 | |
| Portuguese (N = 122) | BBB | 0.074 | 0.048 | 0.121 | 0.020 | 0.121 |
| BUB | 0.081 | 0.039 | 0.040 | 0.033 | 0.040 | |
| BRB | 0.077 | 0.061 | 0.207 | 0.013 | 0.207 | |
| Panel B. Moderation effects (passive × active brand hate) | ||||||
|---|---|---|---|---|---|---|
| Country | Outcome | β (interaction) | SE | p-value | ΔR2 | ΔR2 p-value |
| American (N = 265) | BBB | 0.028 | 0.033 | 0.391 | 0.005 | 0.503 |
| BUB | 0.052 | 0.032 | 0.102 | 0.011 | 0.205 | |
| BRB | 0.077 | 0.045 | 0.090 | 0.021 | 0.051 | |
| Indian (N = 184) | BBB | 0.025 | 0.043 | 0.558 | 0.007 | 0.523 |
| BUB | −0.002 | 0.045 | 0.972 | 0.002 | 0.837 | |
| BRB | −0.038 | 0.056 | 0.503 | 0.003 | 0.740 | |
| Portuguese (N = 122) | BBB | 0.065 | 0.046 | 0.158 | 0.046 | 0.056 |
| BUB | 0.077 | 0.038 | 0.042 | 0.065 | 0.015 | |
| BRB | 0.045 | 0.060 | 0.457 | 0.005 | 0.755 | |
Note(s): ● Predictors were mean-centred within country before computing quadratic and interaction terms
● Controls include gender and age
● ΔR2 reflects incremental variance explained relative to the linear baseline model
● Significant effects (p < 0.05) are shown in italic
● All coefficients are unstandardised
Collectively, these analyses indicate that the passive brand hate–CBBE relationship is predominantly linear across national contexts. Nonlinear and moderated patterns are limited in scope and concentrated in the Portuguese subsample, particularly within the brand understanding dimension. The overall pattern does not suggest systematic functional misspecification of the original model. Rather, it reinforces the structural robustness of the main findings while identifying a culturally bounded boundary condition in how passive hostility translates into brand meaning and understanding.
5. Discussion
The results of this study highlight that different types of hate generate distinct behaviours that have different impacts on each of the three components of the CBBE.
Regarding the detailed analysis of the relationships between the different types of hate and the various dimensions of CBBE, the results show that active brand hate harms consumer-based brand equity (H1, H2, and H3). In contrast, passive brand hate has a positive impact (H4, H5, and H6). The outcomes supported the research hypotheses, in which active brand hate negatively impacts the Building Block ( = −0.153, p < 0.05), the Understanding Block ( = −0.237, p < 0.001), and the Relationship Block ( = −0.323, p < 0.000). Active brand hate was found to have a higher impact on the Relationship Block and a lower impact on the Building Block. A combination of low scores in brand trust, relevance, intimacy, and partner quality can explain low scores in the Relationship Block and, consequently, CBBE. This study is consistent with previous studies suggesting that low scores on the Building Block, Understanding Block, and Relationship Block contribute to the CBBE deconstruction process (Veloutsou et al., 2020).
Active brand hate is associated with direct actions, in which consumers seek to hurt and punish the brand by “getting even” (Bechwati and Morrin, 2003; Hegner et al., 2017). For instance, a desire for revenge is associated with punishments (Grégoire et al., 2009). One way for brands and managers to deal with attack situations is to review policies and processes that generate active brand hate (Kucuk, 2021). In cases of severe hate, consumers are unwilling to accept an apology or to receive monetary compensation. In this regard, brands should change their business and philosophy (e.g. adopt more ethical and responsible business practices) (Kucuk, 2021). Therefore, brands can quickly stop the spread of negative WOM by haters (Odoom et al., 2024). Another way for brands to deal with attack strategies is to proactively and promptly report consumer complaints (Zarantonello et al., 2016).
Regarding the passive brand hate, the findings suggest that it positively impacts Building Block ( = 0.404, p < 0.001), Understanding Block ( = 0.420, p < 0.001), and Relationship Block ( = 0.550, p < 0.001). As in the case of active hate, the block that appears to be most conditioned among the three is the Relationship Block; however, whereas in active hate the impact is negative, in passive hate it is positive. This study is consistent with previous studies suggesting that high scores on the Building Block, Understanding Block, and Relationship Block contribute to the CBBE restoration process (Veloutsou et al., 2020). However, the positive impact of brand hate on CBBE apparently contradicts previous studies that show a significant negative relationship between brand hate and brand equity (Husnain et al., 2020, 2021). Still, for an important reason: these studies measured total brand hate and did not distinguish between active and passive, as in our study.
Passive hate is characterised by low arousal, regulated dissatisfaction, and low behavioural activation (dislike, irritation, emotional distance), without retaliatory intentions. Therefore, it does not signal a breakdown in the relationship, but rather its symbolic renegotiation, consistent with brand relationship theory, according to which negative emotions can coexist with still-active and meaningful relational bonds (Fournier, 1998; Fournier and Alvarez, 2013). Consequently, it creates the conditions for the company to intervene through recovery actions perceived as credible and effective, with incremental effects on customer-based brand equity. The brand redemption literature shows that managerial responses such as public acknowledgement of the mistake, a genuine apology, transparent explanation of the causes, concrete corrective actions, and dialogic stakeholder engagement can not only repair reputational damage but also strengthen trust and the perception of the brand's competence and integrity (Smith et al., 1999; Coombs, 2007). In the presence of passive hate, such interventions are particularly effective because the consumer maintains a sufficient level of attention and cognitive openness toward the brand, a necessary condition for the recovery message to be received and processed.
Several studies also demonstrate that appropriate responses to corporate transgressions can activate consumer forgiveness processes, understood as a reduction in negative emotions and renewed relational availability, with positive effects on brand attitude, attachment, and future intentions (Xie and Peng, 2009; Tsarenko and Tojib, 2015). As effectively highlighted by Tsarenko and Tojib (2015, p. 385), consumer forgiveness is “a motivational transformation in which negative emotions are reduced and the relationship with the firm is re-evaluated.”
According to Kucuk (2021), if this apology is made public, it can generate positive WOM and show that the brand treats its consumers well. Coombs (2007, p. 170) emphasises that “apologies and corrective action are central to post-crisis reputation repair”. Therefore, companies must actively consider complaints from consumers or other stakeholders and, as highlighted by Campbell and Price (2021), respond by “finding ways to influence firm and societal outcomes positively” (p. 517). Furthermore, consumers also evaluate how companies respond to negative events, such as a product recall (Hsu and Lawrence, 2016) or scandalous market practices, thereby strengthening the consumer-brand relationship.
From a CBBE perspective, these dynamics contribute to increasing the favourability of brand associations, trust, and perceived quality, enriching the affective and evaluative dimensions of brand equity that passive hate alone tends to leave ambivalent. In this sense, passive hate can be interpreted as a transitory phase that opens up a space for managerial intervention: if properly managed through recovery strategies and responsive communication, it can trigger a process of reconciliation and forgiveness capable of producing an overall increase in customer-based brand equity, greater than that observed in the absence of conflict.
Companies can now also take advantage of the ways social media enables brands to understand consumers' reactions to marketing and brand crisis quickly (Mosley et al., 2024). Another way brands can address this behaviour is to organise promotions and incentives to offset the losses incurred when someone hates a brand (Zarantonello et al., 2016). The fact that passive hate does not negatively impact CBBE can also be explained by the possibility that some consumers, even though they dislike or hate certain brands, may continue to purchase them (Demirbag-Kaplan et al., 2015). This ability to react to negative consumer feelings must also include differentiated actions and programs in key market segments; as Keller (2021) states, “Successful brand marketers going forward will be those who can find integrative branding solutions that balance and blend multiplicity and heterogeneity” (p. 527). These results are consistent with previous studies, which show that hate intensity varies across individuals depending on factors such as the strength of emotions and the relationship between the brand and the consumer (Banerjee and Goel, 2020).
Furthermore, the results show that the individuals who have already adopted an anti-brand behaviour have, on average, higher brand hate, which is consistent with the fact that active brand hate (behavioural brand hate) is confrontational and is associated with punishing the brand directly (Kucuk, 2018; Zarantonello et al., 2016). Additionally, on average, consumers who have not displayed anti-brand behaviour have higher CBBE.
Moreover, the findings confirm previous studies that attitudinal brand hate is a non-confrontational, passive attitude (Zarantonello et al., 2016). The study also found that consumers/users have, on average, higher CBBEs than non-consumers. It is consistent with Rodrigues et al. (2021), who reveal that non-users manifest a higher degree of brand hate.
An interesting finding in this study is that 17.3% of respondents expressed brand hate feelings despite never having consumed or used the focal brand. This indicates that negative brand perceptions and intense emotional reactions, such as hate, can form independently of direct product experience. Instead, such attitudes may emerge from symbolic associations, cultural narratives, or secondary data (e.g. electronic and word-of-mouth sources, social media coverage). This result extends the current understanding of consumer-based brand equity by highlighting that negative affect toward a brand may undermine brand equity even without direct consumption.
Finally, it was found that age attenuates the impact on the CBBE. The older the age, the smaller the effect. Based on this knowledge, respondents aged 31–40 tend to have less impact on the Building Block. Furthermore, greater brand consumption/use would strengthen the negative relationship between active brand hate and the Building Block.
We can therefore conclude that all the study's research hypotheses were validated (Table 18).
Results of research hypotheses
| Hypotheses | Conclusion |
|---|---|
| H1 Active brand hate → Brand Building Block | Accepted |
| H2 Active brand hate → Brand Understanding Block | Accepted |
| H3 Active brand hate → Brand Relationship Block | Accepted |
| H4 Passive brand hate → Brand Building Block | Accepted |
| H5 Passive brand hate → Brand Understanding Block | Accepted |
| H6 Passive brand hate → Brand Relationship Block | Accepted |
| H4a Moderating Effect → Brand Building Block | Accepted |
| H2a Moderating Effect → Brand Understanding Block | Accepted |
These findings have important theoretical and implications. In the literature, brand hate has always been considered a destructive factor for brand equity and something to be defended against. However, this consideration is generally applied to all forms of hate without examining their nature or the different behavioural reactions they elicit. On the contrary, a more in-depth investigation of the various forms of hate and the behaviours adopted by consumers can reveal them as significant opportunities for brands to increase their value. Based on this study's results, the positive impact of passive hate on CBBE confirms that it can be considered a strategic opportunity for brand innovation and repositioning. Indeed, silent avoidance, manifested as passive hate, can prompt corrective actions that ultimately increase CBBE, primarily by influencing the Brand Relationship Block. On the other hand, active hate negatively impacts all components of CBBE due to highly destructive actions by haters that impact the brand's identity and positioning in consumers” minds (the Brand Building Block), the brand's cognitive and value associations (the Brand Understanding Block), and relational dynamics based on opposition and the desire for destruction (the Brand Relationship Block).
From a managerial perspective, this work clearly highlights that managers must be aware that different levels of negative feelings consumers may experience towards the brand determine distinct behaviours (Francioni et al., 2025; Bhalla et al., 2025) and that, consequently, different consumer behaviours pave the way for distinct managerial practices for managing the consumer-brand relationship. The distinction between active and passive hate is therefore crucial to guiding a firm's response: while active hate requires crisis management, reputation repair, and stakeholder engagement strategies to limit the damage caused by active haters, passive hate requires monitoring and prevention tools (churn analysis, loyalty programs, sentiment analysis) to interpret hidden signals of disaffection and act before the silent avoidance of passive hate turns into the destructive actions typical of active hate.
For international brand managers, these results underscore that negative affect toward brands cannot be interpreted uniformly across markets. The same hostility signal may imply relational recalibration in one context but reputational deterioration in another. Managing brand equity in global markets, therefore, requires sensitivity not only to the intensity of brand hate but also to culturally embedded norms that shape its translation into brand meaning and relationship judgements.
The differentiation between passive and active brand hate suggests that negative affect toward a brand is not inherently homogeneous in its strategic implications. Instead, the managerial relevance of brand hate depends on its level of emotional activation and the extent to which it translates into behavioural disengagement or retaliatory action. Drawing on this distinction, and consistent with our empirical findings, we propose an Active–Passive Hate Response Matrix (Figure 2) that integrates emotional activation intensity with consumer engagement patterns.
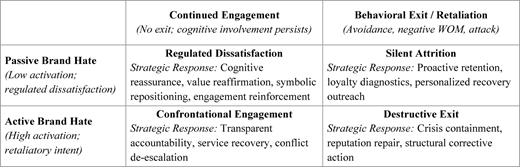
Active–passive hate response matrix: aligning emotional activation and consumer engagement with strategic response
Active–passive hate response matrix: aligning emotional activation and consumer engagement with strategic response
The matrix provides a diagnostic framework that enables managers to calibrate response strategies based on whether negative affect reflects regulated dissatisfaction that coexists with continued engagement, or escalated hostility that manifests in avoidance and retaliation. Importantly, our results indicate that passive brand hate located in the low-activation/continued-engagement quadrant may sustain or even reinforce specific consumer-based brand equity blocks. In contrast, active forms of hate require substantially different intervention logic.
6. Conclusion
Nowadays consumers share more negative experiences with peers than positive ones (Fetscherin, 2019; Hegner et al., 2017). Consumer anger and hate are prevalent on digital platforms (Kucuk, 2019), and these emotions can be destructive, leading to punitive reactions (Zhang and Laroche, 2020) and negatively impacting intangible brand value (Banerjee and Goel, 2020). Therefore, it is crucial to understand the influence of negativity on market value (Kucuk, 2018). According to Zhang and Laroche (2020), studying negative brand emotions can help prevent losses, deliver higher-quality service, and improve consumer satisfaction.
According to Zhang and Laroche (2020), understanding the antecedents of negative feelings provides companies with essential information to improve the quality of their offerings and customer satisfaction. Similarly, Zarantonello et al. (2016) highlighted that knowing why consumers hate the brand can help companies not only address brand hate but also prevent it. Many scholars argue that brand hate should not be seen as harmful but rather as a situation the firm can address through effective marketing strategies (Fetscherin, 2019; Foroudi et al., 2018; Kucuk, 2021).
This study answers the call for more research on the dark side of brands. It fills a gap in the literature to investigate the impact of different types of brand hate on consumer-based brand equity (CBBE), with particular reference to the Millennial generation. A quantitative study was conducted to answer two research questions:
Do active and passive brand hate have the same impact on CBBE?
What are the effects on the three blocks of the CBBE?
A quantitative methodology was applied to test a new conceptual model and research hypotheses through a partial least squares SEM (PLS-SEM) approach. A research model was proposed to empirically test a series of hypotheses regarding the relationships between the different types of hate and the various dimensions of CBBE.
The key findings confirm that brand hate is not a monolithic phenomenon, demonstrating that its distinct forms – active and passive – can influence CBBE in opposite directions. Specifically, active hate significantly compromises CBBE across all dimensions, whereas passive hate has a positive impact. In both cases, the most affected block is the Brand Relationship Block; in the case of passive hate, this is a successful consequence of the managerial practices in response to negative sentiments that have not (or have not yet) led to concrete actions against the brand.
The findings suggest that managers should move beyond treating brand hate as a homogeneous and uniformly destructive construct. Our results indicate that passive brand hate – characterised by low emotional activation and the absence of retaliatory intent –can coexist with continued consumer engagement and, in certain contexts, may even reinforce specific consumer-based brand equity blocks. Consequently, managers should avoid defaulting to crisis-management responses when confronted with mild dissatisfaction. Low-activation negativity may function as a diagnostic signal of ongoing involvement rather than imminent defection. In such situations, strategies centred on cognitive reassurance, transparent communication, value reaffirmation, and symbolic repositioning can stabilise brand meaning, strengthen associative structures, and preserve relational continuity.
By contrast, active brand hate – marked by high arousal and retaliatory orientation – requires escalation to formal recovery mechanisms, including visible accountability, public remediation, and structural corrective action. The proposed Active–Passive Hate Response Matrix therefore offers a strategic decision framework that enables managers to calibrate intervention intensity to emotional activation levels. By differentiating between regulated dissatisfaction and high-risk hostility, firms can prevent overreaction in low-threat situations and underreaction when reputational damage is imminent.
7. Theoretical contribution and future research
This work contributes to the literature on customer-based brand equity by introducing a relational and processual interpretation of negative emotions, distinguishing them by intensity and behavioural implications. Specifically, analysing active and passive brand hate separately allows us to identify the different cognitive, emotional, and behavioural processes that arise from them, avoiding generalising their negative impact on CBBE.
This study, in fact, highlights the significant contribution to the literature on brand hate and the consumer-brand relationship regarding the potentially positive effect that passive hate can have on CBBE. First, this study extends Keller's (1993) model by showing how brand salience and the strength of associations can also be fuelled by forms of antagonistic attention, as long as they are not accompanied by destructive behaviours.
Second, this study engages with the literature on brand relationships by proposing passive hate as an intermediate relational state, characterised by emotional ambivalence and bond persistence, which eludes the traditional dichotomy between positive attitudes and relationship dissolution. Finally, integrating contributions on brand hate (Zarantonello et al., 2016; Hegner et al., 2017) and cultural branding (Holt, 2004), this study clarifies how critical and oppositional narratives can strengthen the symbolic and cultural dimensions of CBBE, suggesting that brand equity is not only the result of favourable evaluations, but also of the brand's discursive density and cultural centrality.
From this point of view, passive hate increases cognitive engagement (via emotional regulation), strengthening memory structures and identity processing, which, in turn, enhances specific CBBE blocks. This does not contradict brand hate theory, but it refines it by introducing regulatory intensity and behavioural activation thresholds. This research claims that when negative affect is low-intensity and regulated, it does not activate destructive pathways.
The study has limitations that future research can address. First, this study focuses on all types of brands and does not categorise them. Furthermore, the scope of this research was to validate a general theoretical model of brand hate rather than to compare sentiments towards specific brands. Our decision to let respondents self-select a brand was aligned with this aim and supports the model's broad applicability. A necessary consequence of this design is that the findings cannot be used to conclude that there are brand-specific differences, which remains a valuable direction for future studies. Therefore, future research could investigate the impact of different kinds of brand hate on CBBE regarding specific goods or services, such as sustainable brands.
Second, this research focuses on the millennial generation. Hence, it would be crucial to understand the differences in brand-hate behaviour across generations. Finally, since the consumer's feeling of hate may be another factor on which the type of behaviour the consumer adopts towards the brand may depend, an important direction for future research could be to examine whether a link exists between active/passive hate and the reasons for hate.
Appendix
Detailed scale items
| Items |
|---|
| This is a brand whose history is important |
| This brand has a long history |
| This brand has been around for a long time |
| This brand has a strong personality |
| This brand has a distinct personality |
| I can describe this brand with adjectives I would use to describe a person |
| This brand reminds me of things I have done or places I have been |
| This brand reminds me of a certain period of my life |
| This brand is good quality |
| This brand has excellent features |
| Compared to other brands in its category, this brand is of very high quality |
| This brand is a leading brand in its category |
| This brand is leading its category |
| This brand tends to outperform its competitors |
| This brand has a clear advantage over competitive brands |
| There is a distinct benefit from using this brand over other brands |
| This brand is superior to other brands in its category |
| I have heard of this brand |
| I am quite familiar with this brand |
| I can recognise this brand among other brands |
| This brand has strong associations |
| This brand has favourable associations |
| It is clear what this brand stands for |
| This brand is highly regarded |
| This brand has status |
| This brand has a good reputation |
| This brand and I have lots in common |
| This brand reminds me of who I am |
| This brand has always been good to me |
| This brand treats me as important and valuable customer/user |
| I really empathise with this brand |
| It feels like I know this brand for a long time |
| This brand delivers what it promises |
| This brand's product claims are believable |
| This brand has a name you can trust |
| This brand is relevant to my family and/or close friends |
| This brand fits my lifestyle |
| This brand has personal relevance to me |

