

Purpose
This paper aims to present a deep understanding of how social media affects organisations’ sustainability performance, using environmental, social and governance (ESG) factors. Particularly, this paper assumes the existence of a causal relationship between organisations’ sustainability performance and the use of their social media profile (i.e. Twitter).
Design/methodology/approach
The authors used a multivariate regression with an explorative approach. Using Thomson Reuters Eikon, the authors composed a sample of 115 public EU companies with a headquarter in Europe operating in the “energy” and “utilities” sectors. The authors collected ESG-related, financial and Twitter-related data covering the period 2016–2019.
Findings
The study findings emphasise the existence of a statistically significant and positive relationship between social media profiles (i.e. Twitter) and companies’ sustainability performance. Findings show that ESG-oriented companies use their Twitter profile more as a tool for achieving a higher level of legitimation rather than for managing their sustainability strategy and related performance. Therefore, social media contribute more to the construction of companies’ CSR identity than the management of analytic aspects of sustainability performance. The longevity of companies’ profiles is the variable mostly showing a causal relationship not only with the general measure of companies’ sustainability performance but also with its pillars and sub-pillars.
Originality/value
This research is original in showing academics, practitioners and policymakers results on the impact of different modalities of interaction (retweets, replies, likes and quotes) between organisations and stakeholders by using social media on sustainability performance.
1. Introduction
In recent years, digital transformation radically changed the way public and private organisations operate (Lombardi et al., 2020; Nambisan, 2017; Rippa and Secundo, 2018; Schimperna et al., 2020; Lombardi et al., 2021a), fostering them to adopt new technologies (e.g. social media, mobile, business analytics, Internet of Things, Big data, Advanced Manufacturing/Industry 4.0/5.0, digital-to-physical-transfer, cloud and cyber-solutions, artificial intelligence) to gain significant benefits (Fischer and Reuber, 2011; Greenstein et al., 2013; Fitzgerald et al., 2014; Lardo et al., 2017; Nambisan et al., 2017). Among new technologies, social media, such as Twitter, Facebook or YouTube have become increasingly important because of the creation, sharing and exchange of information with countless counterparts (Leonardi and Vaast, 2017). One of the main benefits related to social media is the enhancement and communication of CSR practices and related sustainable performances (O'Leary et al., 2004; Abbas et al., 2019), which might lead to a competitive advantage (Gaganis et al., 2019) as well as the improvement of the environmental accounting.
In the current scenario, sustainability issues and sustainable development are widely discussed, especially in the light of the current and future generations and organisations’ growth (Nam, 2015; Simoni et al., 2020). Particularly, sustainable development focused on the balance of companies’ common priorities of development and the interests of sectoral, regional and national development (Lavrinenko et al., 2019). Environmental, social and governance (ESG) issues are the leading concerns of sustainable development. Issues related to the environment mainly refer to natural resources’ consumption and pollution, while factors related to work and workplace concerns and their impact on community and society are part of social issues. Governance issues are composed of concerns related to management and the board of directors (Sharma et al., 2020). The ESG factors are used for measuring and comparing sustainable companies’ performance (Tripathi and Bhandari, 2014; Watson, 2015; Boiral and Henri, 2015). They are also an important pillar of corporate social responsibility (CSR), supporting sustainable strategies (Eccles et al., 2013).
This paper aims to investigate social media as new technologies able to redefine interactions between multiple groups of actors (Jaakkola and Alexander, 2014; Larivière et al., 2017) and sustainability performance (Boiral and Henri, 2015; Dissanayake, 2020). Even if the role of social media in this relationship has been already studied by some scholars (Abbas et al., 2019; Ramanadhan et al., 2013; Reilly and Hynan, 2014), this paper adopts a more analytical perspective on social media focusing on one of them, i.e. Twitter, and operationalising its use by looking both at the number of followers and also at the interaction that companies and followers can have through social media. In this way, our purpose is to understand if and which use of social media affects organisations’ sustainability performance. Additionally, this paper adopts a specific and well-diffused definition of sustainability performance, that is, the ESG. Therefore, this analysis may contribute to answering several calls for research, including the Meditari special issue “The Digital Transformation of Performance Measurement: Outlining a Research Agenda for New Challenges in Sustainable Organizations” which included the following question: “Which is the impact digital technologies could have on social accounting, environment accounting towards the sustainability perspectives?”
We applied a quantitative method using multivariate regression with an explorative approach to test for causality against empirical evidence (Collis and Hussey, 2014). We used Thomson Reuters Eikon (2021) to compose our sample: 115 public EU companies with a headquarter in Europe operating in the “energy” and “utilities” sectors, which are relevant sectors to investigate sustainability performance. We collected data between the 2016 and 2019 years assuming ESG aspects [e.g. ESG-Combined Score (ESG_C); three ESG Pillar Scores – Environmental Pillar Score (EPS), Social Pillar Score (SPS) and Governance Pillar Score (GPS)]. Twitter-related data were also gathered for the same period. We focused on the existence of a causal connection between organisations’ sustainability performance and their use of social media through their active social media profile (Twitter profile).
Our findings emphasise the existence of a statistically significant and positive relationship between social media profiles (i.e. Twitter) and companies’ sustainability performance. The theoretical and practical contributions of this paper are directed towards the enhancement of social media and CSR literature showing that the use of social media affects companies’ approach to sustainability mainly as a tool for reaching a higher level of legitimisation, and sustainability performance is a complex and composite result deriving from the effects exercised by some drivers, one among which is social media. Additionally, the companies’ size and financial solidity are positively related to companies’ sustainability performance. From a practical point of view, in using social media, managers need to take into consideration a possible difference between the existence of a social media profile as a whole and its possible different uses. In particular, managers must govern not only the existence of a social media but also to manage differently the various possibility of interacting with stakeholders through a social media.
This paper is organised as follows. After this introduction, Section 2 presents the review of the literature. Section 3 provides the methodology and methods adopted. Section 4 illustrates the findings of the study. The last section, i.e. Section 5, outlines the discussion and implications for theory and practice drawing conclusions from the research.
2. Literature review
2.1 Sustainability and sustainability performance
Over the past two decades, attention has considerably intensified around sustainability issues (Simoni et al., 2020). Depletion of natural resources, climate change, corporate scandals and bad working conditions are just a few examples of environmental, social and ethical concerns (Money and Schepers, 2007; Conca et al., 2021; Lombardi et al., 2021b). Several stakeholders, such as investors, employees, consumers, suppliers, public powers and non-governmental organisations, are increasingly requesting companies to develop and strengthen CSR practices (Kolk and van Tulder, 2010; Duque-Grisales and Aguilera-Caracuel, 2019). CSR and sustainability are so closely linked that they are often considered equivalent concepts (Rameshwar et al., 2020). According to Van Marrewijk (2003), they refer to the introduction of social and environmental issues in business activities, also considering stakeholders’ point of view. In this scenario, companies must adopt new management models based on both the search for profit and the accomplishment of society and stakeholders’ expectations, in a long-term manner (Martínez et al., 2016; Fortunati et al., 2020).
In 2001, CSR was defined “as a concept whereby companies integrate social and environmental concerns in their business operations and in their interaction with their stakeholders on the voluntary basis” (European Commission Green Paper, 2001). In 2011, the previous concept of voluntary basis was overcome, broadening CSR practices also to the respect of legal obligations. Additionally, CSR was defined as “the responsibility of enterprises for their impacts on society” (EU, 2011), aligning with the aim of including social, environmental and ethical concerns into their business strategy, without forgetting the collaboration with stakeholders (Fortunati et al., 2020). Among CSR practices, ESG issues are becoming increasingly important:
The factors related to environment include emissions, water usage, water pollution, wastes, usage of renewable and non-renewable resources, etc. Issues such as workplace diversity, health and safety, labour strikes, child labour, impact of operations on community and society, etc., are the part of social factor. Governance includes all the issues related to management and board such as board diversity, board meetings, attendance, agenda issues, corruption, etc. (Sharma et al., 2020).
ESG factors implementation is characterised by the following three phases: reframing the company’s identity; codifying the new identity; and building a supportive organisational culture (Eccles et al., 2012). The ESG factors are valuable tools for measuring and comparing sustainable companies’ performance (Tripathi and Bhandari, 2014; Watson, 2015; Boiral and Henri, 2015) and ESG score is regarded as an important pillar of CSR, to improve sustainable strategies (Eccles et al., 2013). Sustainability key performance indicators (KPIs) are specific indicators used to fix business strategies and assess economic, social and environmental performance against set objectives (Dissanayake, 2020). Several sustainability projects, with relevant impact on the overall organisation, require significant investments. Thus, companies need to know their performance to maximise strategic efficiency (Mazzi et al., 2012). Additionally, sustainability performance management is in an early stage and sustainability KPIs become valuable tools to uncover the key areas of impact and the potential opportunities for companies (Dissanayake, 2020).
Sustainability KPIs should be adapted over time relying on key areas of impact for the company. Many KPIs on sustainability evolve faster than basic indicators, such as raw materials usage, water usage and greenhouse gas emissions. The introduction and the adaptation of sustainability KPIs allow management to make informed decisions (Dissanayake, 2020). Several studies found a positive relation between ESG practices and non-financial performance (e.g. reduction in materials and energy’s use and improvement of process efficiency) (Aras and Crowther, 2008; Chouaibi et al., 2021). Conversely, the relationship between ESG performance and financial performance provided unclear results (Duque-Grisales and Aguilera-Caracuel, 2019; Chouaibi et al., 2021), even if a few studies showed a positive association (Lo and Sheu, 2007; Filbeck et al., 2009; Eccles et al., 2014; Cahan et al., 2015; Fatemi et al., 2015; Rodriguez-Fernandez, 2016).
The inadequacies of the traditional financial disclosure led to the need for ESG issues information (Maama, 2020). According to Weber (2014), the institutional theory, accountability and stakeholder management characterise ESG issues disclosure. The institutional theory refers to the institutional pressure on ESG practices. Accountability relies on companies’ responsibility towards their stakeholders, leading to ESG issues reporting. Finally, stakeholder management bases on the relation between the ESG issues reporting, financial performance and the importance for stakeholders (Weber, 2014). The increasing trend to provide disclosure on ESG factors leads to the need for more uniform guidelines, among which the Global Reporting Initiatives and the United Nations Global Compact represent two well-known global initiatives (Lokuwaduge and Heenetigala, 2017).
2.2 Digital transformation, social media and sustainability
The advent of new technologies is deeply affecting companies, forcing them to adapt and innovate their business processes (Krumeich et al., 2014; Schimperna et al., 2020), means of production and ways to generate value (Pavlou and El Sawy, 2010; Karimi and Walter, 2015; Berghaus and Back, 2016; Marrone and Hazelton, 2019). “Digitalisation is opening up fascinating innovation opportunities for innovators, creators and organisations” (Yoo et al., 2010; Nambisan, 2017; Ramaswamy and Ozcan, 2018) (Lombardi and Secundo, 2021) operating in all economic fields (Hossnofsky and Junge, 2019; Kohnová et al., 2019; Lombardi et al., 2021a). The availability of digital technologies, the extent of data availability and the existence of computer power are crucial elements in exploiting these new opportunities (Secundo et al., 2020; Lombardi et al., 2020).
Social media have completely redefined previous interactions, creating a more complex system, characterised by interactions between multiple groups of actors, among which companies, customers or general stakeholders (Ramanadhan et al., 2013; Jaakkola and Alexander, 2014; Larivière et al., 2017). In this scenario, social media, such as Twitter, Facebook or YouTube, have become increasingly important digital technologies because of the possibility for anyone to create, share and exchange information with countless counterparts (Leonardi and Vaast, 2017). Additionally, social media’s worldwide impact is strengthened by an active global social media population of 4.14 billion users, which account for over half of the world’s population (https://www.statista.com/statistics/617136/digital-population-worldwide/).
Strong social capital and networks make easier the identification of new business opportunities (De Carolis and Saparito, 2006). Thus, social media can be reasonably considered valuable tools for entrepreneurship, because of their capability to create interactions and communications useful to identify changes and opportunities in business creation, develop new ideas for starting a business, reach target customers, know customers’ views and feedback and recruit employees (Park et al., 2017). No less significant is the use for crowdfunding, information search, networking, ecosystem creation (Argyris and Ransbotham, 2016; Drummond et al., 2018; Estrin et al., 2018) and communication and development of CSR/sustainability initiatives (Signitzer and Prexl, 2007; Reilly, 2009; Reilly and Weirup, 2012; Abbas et al., 2019).
The latter benefit is relevant because social media use allows the enhancement of CSR practices and related sustainable performances (O’Leary et al., 2004). These practices become essential when a company decides to introduce social media use into its marketing strategy, leading to an increase in customers’ engagement and sustainable performance (Abbas et al., 2019). Indeed, social media use allows the improvement of sustainable performance, obtaining the following main benefits: increase in decision-making efficiency, revenue generation, cost reduction (especially in terms of marketing costs), improvement of innovative business processes, company image and customers’ relationships (Teo and Choo, 2001; Molla and Heeks, 2007; Parveen et al., 2016).
Thus, social media use can effectively improve sustainable performance, leading also to a competitive advantage (Gaganis et al., 2019). Communication of sustainable performance through social media differs across industries and companies in terms of:
the kind of sustainability initiatives disclosed;
metrics used; and
social media selected for the communication.
Additionally, the nature of a company affects the inclination towards sustainability practices and their communication through social media. Indeed, green companies are more active in developing and communicating sustainable initiatives through social media than not green ones (Reilly and Hynan, 2014). Thus, this article represents a relevant and interesting research field that is still under-researched. We aim to deepen the current literature, understanding social media management role as a driver for sustainability and answering the following research question:
RQ1: How does social media use affect organisations’ sustainability performance?
3. Methodology
We used a quantitative methodology to answer our research question. We found that the statistical and our regression analysis is “… perhaps the most widely applied data analysis technique for measuring linear relationships between two or more variables. Correlation tells us whether a relationship exists between two variables, as well as the overall strength of the relationship.” (Hair et al., 2020, p. 395). Additionally, researchers need “[…] a technique like regression analysis, which enables them to predict the future with an assessed level of accuracy” (Hair et al., 2020, p. 396). The following section presents the sampling method, variables and the regression model.
3.1 Sampling method and variables
The literature gap and the related research question have been investigated adopting an explorative approach to test for causality against empirical evidence (Collis and Hussey, 2014). Using a quantitative method (i.e. a multivariate regression), the empirical analysis carried out aims at investigating the existence of a causal connection between organisations’ sustainability performance and their use of social media. The first step of the analysis has been the selection of the sample to analyse. In this regard, the reference population was identified using Thomson Reuters Eikon (2021).
Thomson Reuters is one of the most important companies in the field of economic and financial information. It also has one of the largest collections of ESG content (Thomson Reuters, 2017); hence, the use of Thomson Reuters’ Eikon platform lends itself to the collection of a large amount of data related to financial, economic and sustainability aspects. Using filters during the process of data gathering, all public companies with a headquarter in Europe and operating in the “energy” and “utilities” sectors have been retrieved.
These two economic sectors have been selected because of the relevance of their sustainability performance, specifically, in terms of their impact on the environment when regarding the energy sector and stakeholder expectations of public service provision as regards the utility sector (Cantele et al., 2018; Slacik and Greiling, 2020). The number of companies identified through Thomson Reuters resulted in 819 companies. However, as the analysis focuses on the relationship between sustainability performance and social media use, only the companies in the Thomson Reuters dataset that report a sustainability score and that have an active social media profile, i.e. a Twitter profile, have been included in the sample. This latter selection criterion has been undertaken manually for each company for which a sustainability score has been found. According to these two further prerequisites, 115 public EU companies have resulted eligible for the analysis.
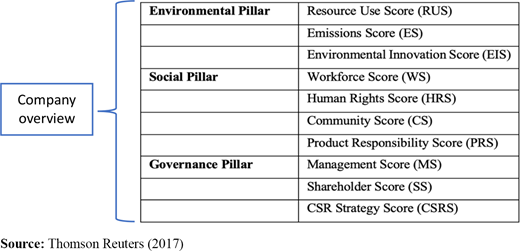
Once the sample has been built, some relevant variables covering the years 2016–2019 have been collected through Thomson Reuters Eikon. The first group of variables are scores related to ESG aspects, i.e. the ESG_C and the three EPS, SPS and GPS. Based on corporate data and an accurate content analysis process, the platform allows the retrieving of ten additional categories, which measure ESG performance for each pillar (see Figure 1). These measures have also been retrieved to be used in the analysis.
The second group of variables relate specifically to the social media dimension. Twitter – a microblogging application – has been selected as the social media to investigate concerning to organisations’ sustainability performance. Twitter has been chosen because the idea behind this social media is to exchange short messages to create “awareness” (Kaplan and Haenlein, 2010), which, even if often defined as ephemeral, concentrates predominantly on the conversational dimension of communication (Kietzmann et al., 2011). The virtue of analysing the social, environmental and economic disclosure of companies through Twitter has been widely acknowledged and endorsed in previous studies (Chae and Park, 2018; Suárez-Rico et al., 2018). Twitter is well suited in communicating to the world, in less than 140 words, corporate news and ideas while other platforms such as Facebook are more suitable for constructing stronger and longer relationships between organisations and their followers and among followers themselves (Ruggiero et al., 2021). A dummy variable (TW) has been introduced in the analysis to collect the data about the existence of the organisations in the sample of an active profile on Twitter. This dummy has been used to highlight whether the presence of a Twitter account impacts organisations’ sustainability performance. Because Thomson Reuters Eikon does not provide information on social media use, tweets for all the 115 companies in the sample have been extracted for the four years of analysis via Postman, a collaboration platform suggested by Twitter for API (application programming interface), with prior authorisation of Twitter. Based on these data, four variables have been defined: R_T, RE_T, L_T and Q_T. For each company, these variables, respectively, are the yearly ratio between the total number of retweets, replies, likes and quotes and the total number of tweets published on a company profile. In Twitter, a retweet corresponds to the repost or forwarding of a tweet, i.e. the message posted on the timeline, while replies represent the number of responses given to each tweet. Likes on Twitter, instead, are used by Twitter users to declare their appreciation for a specific Tweet. The tweets’ quote occurs when a retweet happens with the addition of a comment.
A last group of variables has been selected and used as control variables. These variables regard organisations’ financial performance and have also been retrieved from Thomson Reuters Eikon. In particular, the effect of organisations’ size [log(TA)], profitability (return on assets (ROA) and return on equity (ROE)) and a more market-related indicator such as book value per share (BV_S) have been controlled for in the multivariate regression. The size has been measured as the logarithm of total assets. A further control variable has been added to the model, namely, MTW, which corresponds to the number of months since when the organisations in the sample have a Twitter account. This information has been gathered directly from the organisations’ Twitter profile.
3.2 Regression models
Each variable used in the analysis has been tested for normality to ensure the existence of the assumptions underlying correlation and regression analysis. The variables not normally distributed have been transformed using their [i.e. log(TA)]. The regression analysis of the data collected has been carried out by using two models. The first model (M1) has been developed to investigate whether the existence of a Twitter account impacts organisations’ sustainability performance:
A second model has been developed to empirically test the causality between sustainability indexes and the Twitter-related variables. This model is changed according to the choice of the sustainability-related independent variable to be investigated. The analysis starts with the more broadly index, the ESG_C, as the independent variable and then proceed to explore each pillar (EPS, SPS, GPS) and the inherent sub-pillars [resource use score (RUS), Emissions score (ES), environmental innovation score (EIS), workforce score (WS), human rights score (HRS), community score (CS), product responsibility score (PRS), management score (MS), shareholder score (SS), CSR strategy score (CSRS)] as presented in Figure 1:
4. Empirical results
This section reports the results of the empirical analysis. Section 4.1 provides a general overview of the sample; Section 4.2 illustrates the descriptive statistics regarding the information used for the analysis. In Section 4.3, the results of the two regression models are reported to highlight the possible causal relationships between companies’ sustainability performance and the use of social media. In Section 4.4, some additional analyses are provided, which checks for the existence of fixed effects.
4.1 Overview
The sample of 115 companies is divided into a 57% public companies from the “energy” sector and the remaining 43% from the “utilities” sectors. Companies’ location is depicted in Figure 2. Besides showing the states in Europe where the highest number of “energy” and “utilities” companies in the sample is concentrated, the figure shows the intensity of these companies’ presence in each state.
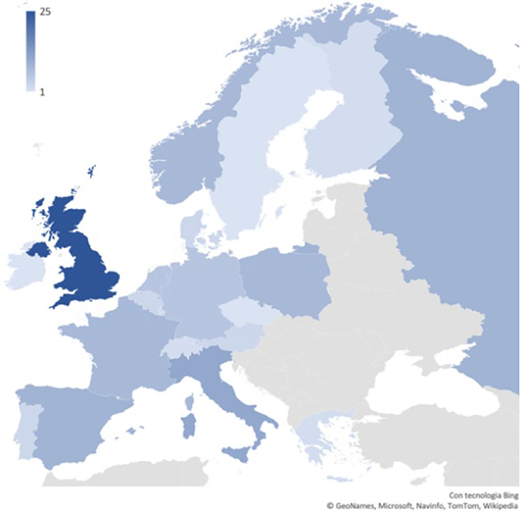
Geographical location of listed energy and utilities companies according to their headquarters
Geographical location of listed energy and utilities companies according to their headquarters
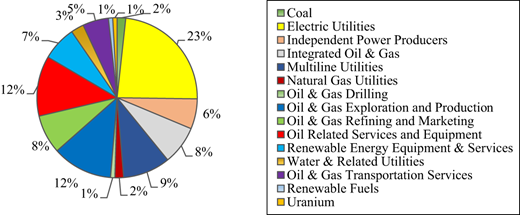
The largest percentage of the companies in the sample belong to the “electric utilities” industry (Figure 3). Electric utilities are of particular interest from the point of view of sustainable performance, as they are still recognised as being under-researched (Slacik and Greiling, 2020).
4.2 Descriptive statistics
Table 1 shows the descriptive statistics for each variable of Model 2, for the whole sample of 115 publicly listed companies from the “energy” and “utilities” sector in the period 2016–2019. It emerges that the average score achieved by companies in the ESG_C is 53.07. Likewise, the other ESG-related variables have obtained a score that has a mean value that ranges between 50 and 65, except for the WS, EIS and SS. The WS score averagely achieved by the companies in the sample is more than 70, indicating a great effort of “energy” companies and “utilities” in engaging ethically with the workforce.
Descriptive statistics
| Variable | Mean | p50 | SD | Variance | Min | Max |
|---|---|---|---|---|---|---|
| ESG_C | 53.07554 | 54.68 | 19.60098 | 384.1986 | 2.54 | 89.9 |
| EPS | 56.65769 | 60.73 | 26.19087 | 685.9618 | 0 | 97.09 |
| SPS | 60.07708 | 64.74 | 23.92147 | 572.2366 | 0.56 | 96.22 |
| GPS | 54.56354 | 57.25 | 22.99697 | 528.8609 | 2.38 | 97.93 |
| RUS | 62.49776 | 68.9 | 29.77864 | 886.7675 | 0 | 99.77 |
| ES | 63.95258 | 73.21 | 29.65504 | 879.4216 | 0 | 99.76 |
| EIS | 36.34732 | 29.66 | 35.1961 | 1,238.765 | 0 | 99.6 |
| WS | 70.55152 | 76.16 | 24.97821 | 623.9111 | 0.77 | 99.81 |
| HRS | 53.13118 | 62.07 | 33.37972 | 1,114.205 | 0 | 98.98 |
| CS | 58.46427 | 64.1 | 30.77644 | 947.1891 | 0.71 | 99.66 |
| PRS | 53.67147 | 57.14 | 31.6591 | 1,002.299 | 0 | 99.77 |
| MS | 55.99899 | 58.33 | 30.16131 | 909.7045 | 0.53 | 99.68 |
| SS | 47.01855 | 47.5 | 27.97419 | 782.5554 | 0.13 | 98.81 |
| CSRS | 58.70328 | 69.79 | 30.38476 | 923.2339 | 0 | 98.75 |
| R_T | 6.175198 | 2.646707 | 19.58009 | 383.3799 | 0 | 358.7111 |
| RE_T | 0.4930356 | 0.1515152 | 1.250165 | 1.562913 | 0 | 11 |
| L_T | 8.061953 | 2.702111 | 21.20801 | 449.7796 | 0 | 224.7275 |
| Q_T | 0.262519 | 0.0934579 | 0.4611315 | 0.2126422 | 0 | 3.089041 |
| MTW | 59.89634 | 59.5 | 37.72302 | 1,423.026 | 0 | 157 |
| Log(TA) | 16.45715 | 16.30906 | 2.476075 | 6.130946 | 9.424645 | 23.80895 |
| D_E | 99.51813 | 68.58 | 212.0886 | 44,981.58 | −1696.69 | 1071.67 |
| ROA | 2.460882 | 3.58 | 10.78243 | 116.2609 | −62.75 | 56.58 |
| ROE | −115.7539 | 7.31 | 2,574.943 | 6,630,333 | −56,331.57 | 265.92 |
| BV_S | 2,901.92 | 7.215 | 31,050.86 | 9.64e + 08 | −52.707 | 373,482.5 |
From Table 1, it also emerges that EIS and SS have achieved lower scores, indicating that environmental innovation and shareholders treatment are still underrated. By looking at the social media variables, it emerges that while the range of R_T, RE_T, L_T and Q_T goes from 0 to 358.71, 11, 224.73 and 3.08, respectively, the average values are generally low, suggesting that few companies are particularly successful in achieving high numbers of sharing, replies, likes and quotes on the social media platform, while many others are found around the average value and below. Additionally, it can be noted that the number of months since the activation of the social media account is on average 59.9 (MTW), which is less than five years.
Correlation analysis is reported in Table 2. The correlation values of Twitter-related variables to the organisations’ sustainability performance (ESG_C) are all positive even if not very strong. Apart R_T, all the other Twitter-related variables have a significant correlation with ESG_C. Only two of these variables, namely, RE_T and MTW, have a highly significant correlation to ESG_C. More precisely, MTW is statistically significant also for p-value < 0.01, meaning that the number of months of the existence of a Twitter account correlates positively and strongly to the general sustainable performance. As regards L_T and Q_T, the significance sets at p-value < 0.10.
Correlation matrix
| ESG_C | R_T | RE_T | L_T | Q_T | MTW | Log(TA) | D_E | ROA | ROE | BV_S | |
|---|---|---|---|---|---|---|---|---|---|---|---|
| ESG_C | 1.000 | ||||||||||
| R_T | 0.0151 | 1.000 | |||||||||
| RE_T | 0.1250** | 0.2566*** | 1.000 | ||||||||
| L_T | 0.1011* | 0.3247*** | 0.6992*** | 1.000 | |||||||
| Q_T | 0.0963* | 0.3170*** | 0.7246*** | 0.7402*** | 1.000 | ||||||
| MTW | 0.1603*** | 0.0220 | 0.1282*** | 0.1660*** | 0.1507*** | 1.000 | |||||
| LogTA | 0.3456*** | 0.0355 | 0.2056*** | 0.1551*** | 0.1754*** | 0.1196*** | 1.000 | ||||
| D_E | −0.0105 | 0.0611 | −0.0131 | −0.0065 | −0.0259 | 0.0256 | −0.0434 | 1.000 | |||
| ROA | 0.1426*** | −0.0127 | 0.0011 | 0.0118 | −0.0185 | −0.0068 | 0.3488*** | 0.0807* | 1.000 | ||
| ROE | 0.0715 | 0.0152 | 0.0180 | 0.0172 | 0.0258 | 0.0250 | 0.0765* | 0.4536*** | 0.5443*** | 1.000 | |
| BV_S | −0.0422 | −0.0298 | −0.0370 | −0.0350 | −0.0544 | −0.0270 | 0.2025*** | −0.0283 | 0.0527 | 0.0047 | 1.000 |
Notes:
*p < 0.10; **p < 0.05; ***p < 0.01
All the correlations values are below 0.9, which is consistent with what is suggested by Hair, Black, Babin, and Anderson (2014). Besides, this result is confirmed by the variance inflation factor (VIF) (see Table 3) values. Being all VIF values below 3, it can be concluded that there is a high tolerance value and thus a low degree of multicollinearity. In other words, the results indicate that the independent variables collectively have no substantial amount of shared variance (Hair et al., 2014). According to Allison (1999), collinearity starts to become an issue when the tolerance level falls below 40. Since 1/Tolerance equals VIF, collinearity commences to become an issue when it is significantly above 2.5.
Variance inflation factor
| Variable | VIF | SQRT VIF | Tolerance | R-squared |
|---|---|---|---|---|
| ESG_C | 1.12 | 1.06 | 0.8920 | 0.1080 |
| R_T | 1.15 | 1.07 | 0.8724 | 0.1276 |
| RE_T | 2.61 | 1.61 | 0.3834 | 0.6166 |
| L_T | 2.66 | 1.63 | 0.3762 | 0.6238 |
| Q_T | 2.93 | 1.71 | 0.3410 | 0.6590 |
| MTW | 1.06 | 1.03 | 0.9458 | 0.0542 |
| LogTA | 1.35 | 1.16 | 0.7382 | 0.2618 |
| D_E | 1.12 | 1.06 | 0.8928 | 0.1072 |
| ROA | 1.77 | 1.33 | 0.5655 | 0.4345 |
| ROE | 1.72 | 1.31 | 0.5801 | 0.4199 |
| BV_S | 1.10 | 1.05 | 0.9122 | 0.0878 |
| Mean VIF: 1.69 | ||||
4.3 Regression analysis
Before performing the regression analysis, a heteroscedasticity test has been run following Breusch and Pagan (1980) and Cook and Weisberg (1983). To avoid any problem of heteroscedasticity, a biweight robust regression has been carried out (Tukey, 1977). This type of regression is based on a series of following steps. First, the regression must be fitted calculating Cook’s D and excluding any observation for which D > 1. Then, the regression is carried out; case weights from absolute residuals are calculated; and results are regressed again, using those weights up to the moment where the maximum change in weights drops below the tolerance level.
By using Tukey’s robust regression, the results of Model 1 indicated that a confidence interval of 99% for TW is significant. Hence, there is a strongly significant and positive relationship between the existence of a Twitter account and the companies’ ESG performance.
Moving to the second model, the results of the regression analysis show that concerning ESG combined score, retweets are significant with a p-value below 1%. All the other Twitter-related variables, instead, do not prove to be statistically significant apart MTW. Analysing in-depth the three pillars (EPS, SPS, GPS) and comparing the results with the general score (ESG_C), it is interesting to notice that the situation does not change in terms of relationships between dependent and independent variables but there is a change in their significance. More precisely as for the EPS and SPS, MTW is statistically significant in a confidence interval of 99% while R_T reduces its significance at 90%. As for GPS, MTW has a significance at 95% (it is reduced compared to the other two pillars) while R_T is not significant at all (Table 5).
Regression analysis (Model 2) for the variables: ESG_C, EPS, SPS, GPS
| Variable | ESG_C | EPS | SPS | GPS |
|---|---|---|---|---|
| R_T | 0.39238*** | 0.31517* | 0.29601* | −0.05085 |
| RE_T | 0.83349 | −0.87392 | 0.10471 | 1.13244 |
| L_T | −0.05939 | 0.10693 | 0.05517 | 0.03495 |
| Q_T | −4.44216 | −4.60424 | −4.24457 | 1.63020 |
| MTW | 0.05068* | 0.11700*** | 0.12180*** | 0.07626** |
| LogTA | 1.70877*** | 4.18712*** | 3.34177*** | 3.29998*** |
| D_E | −0.00153 | −0.00801 | 0.00662 | −0.00588 |
| ROA | 0.44237*** | 0.11482 | −0.01363 | 0.07727 |
| ROE | −0.01473 | 0.00739 | −0.00474 | 0.05885 |
| BV_S | −0.00006** | −0.00007* | −0.00015*** | −0.00003 |
| _cons | 21.59108** | −17.77264* | −2.15420 | −5.67448 |
| N | 350 | 350 | 350 | 350 |
| r2 | 0.12377 | 0.210467 | 0.19967 | 0.16288 |
| r2_a | 0.09792 | 0.18718 | 0.17606 | 0.13819 |
| F | 4.78848 | 9.03677 | 8.45741 | 6.59593 |
Notes:
*p < 0.10; **p < 0.05; ***p < 0.01
Delving further into the analysis, the categories of each of the three pillars are investigated. Table 6 represents the categories of the environmental pillar. In the environmental one (EPS), it emerges that for each dependent variable (RUS and ES) except for EIS, there is a significant relationship with MTW. In contrast, EIS is the only category that shows a statistically significant relationship with R_T (p-value < 0.01), suggesting that environmental innovation is not only positively correlated with the number of retweets per tweet, but could also represent a topic of interest for Twitter users, who more likely tend to share its content.
Regression analysis (Model 2) of the EPS sub-pillars
| Variable | EPS | ||
|---|---|---|---|
| RUS | ES | EIS | |
| R_T | 0.19355 | 0.22579 | 0.67185*** |
| RE_T | −0.15850 | −0.62905 | −2.63517 |
| L_T | 0.08922 | 0.07859 | 0.11079 |
| Q_T | −5.82108 | −3.26070 | −0.20131 |
| MTW | 0.13892*** | 0.085233** | 0.11214* |
| LogTA | 4.23954*** | 4.57110*** | 3.89848*** |
| D_E | −0.00494 | −0.00960 | −0.00233 |
| ROA | 0.67583*** | 0.18827 | −0.54421* |
| ROE | −0.02810 | 0.00760 | 0.04478 |
| BV_S | −0.00011** | −0.00003 | −0.00015*** |
| _cons | −11.50692 | −13.80764 | −36.75984** |
| N | 350 | 350 | 349 |
| r2 | 0.24656 | 0.17688 | 0.12869 |
| r2_a | 0.22433 | 0.15260 | 0.10292 |
| F | 11.09336 | 7.28478 | 4.99233 |
Notes:
*p < 0.10; **p < 0.05; ***p < 0.01
For the social sub-pillars, the MTW is significant only for WS (p-value <0.05) and HRS (pvalue <0.10). For CS, no Twitter variable seems to be statistically valid, while in Product responsibility score (PRS), a negative relationship between PRS and the number of quotes per tweet is found to be significant. Given that PRS indicates the companies’ capacity to produce quality goods and services, this result suggests that a retweet followed by a comment negatively relates to the companies’ capacity to achieve product and service quality (Table 7).
Regression analysis (Model 2) of the SPS sub-pillars
| Variable | SPS | |||
|---|---|---|---|---|
| WS | HRS | CS | PRS | |
| R_T | 0.22024 | 0.35744 | 0.28416 | 0.39137* |
| RE_T | −0.45586 | −0.74250 | −0.25071 | 0.63421 |
| L_T | 0.10067 | 0.05544 | 0.00475 | 0.07605 |
| Q_T | −3.92758 | 4.06275 | −4.58796 | −13.33965** |
| MTW | 0.10710*** | 0.13330** | 0.04727 | 0.09627* |
| LogTA | 2.44313*** | 3.47654*** | 4.73789*** | 4.94623*** |
| D_E | −0.00243 | 0.00853 | 0.01179 | −0.00981 |
| ROA | −0.02814 | −0.34660 | −0.22431 | 0.32221 |
| ROE | 0.04232 | 0.01744 | −0.00845 | −0.00597 |
| BV_S | −0.00008** | −0.00018*** | −0.00016*** | −0.00025*** |
| _cons | 25.79295*** | −12.53490 | −22.64162 | −30.33451** |
| N | 349 | 350 | 350 | 350 |
| r2 | 0.12351 | 0.13049 | 0.12073 | 0.18777 |
| r2_a | 0.09758 | 0.10484 | 0.09479 | 0.16381 |
| F | 4.76291 | 5.08746 | 4.65479 | 7.83693 |
Notes:
*p < 0.10; **p < 0.05; ***p < 0.01
Regarding the GPS, it is notable that only CSRS seems to be significantly related to MTW (see Table 8). This finding is consistent with the idea underlying the CSRS score, as it reflects companies’ capacity to communicate economic, social and environmental aspects strategically. Moreover, results seem to indicate that a longstanding and permanent presence of a corporate Twitter account leads to more engaging CSR-strategies for communicating sustainable performance.
Regression analysis (Model 2) of the sub-pillars of the GPS
| Variable | GPS | ||
|---|---|---|---|
| MS | SS | CSRS | |
| R_T | −0.07196 | 0.06944 | −0.130146* |
| RE_T | 1.19020 | 1.95334 | 0.62857 |
| L_T | 0.06766 | −0.01692 | −0.08228 |
| Q_T | 4.87899 | −10.60405* | 2.63503 |
| MTW | 0.07730 | 0.02232 | 0.16913*** |
| LogTA | 3.16591*** | 1.04241 | 6.65878*** |
| D_E | −0.01055 | −0.01120 | 0.03287*** |
| ROA | 0.01182 | 0.36830 | 0.08412 |
| ROE | 0.10974* | −0.09619 | −0.03138 |
| BV_S | −0.00005 | 0.00011** | −0.00013*** |
| _cons | −2.87402 | 31.12544** | −64.21987*** |
| N | 350 | 350 | 351 |
| r2 | 0.12142 | 0.06286 | 0.30054 |
| r2_a | 0.09550 | 0.03521 | 0.27996 |
| F | 4.68487 | 2.27375 | 14.609 |
Notes:
*p < 0.10; **p < 0.05; ***p < 0.01
Focusing the attention on the control variables used in the regression models, it is evident that ESG performance is primarily and strongly related to the size of companies and the performance in terms of equity per share.
4.4 Further analysis
In addition to the regression analysis, the analysis of fixed effects has been carried out because of the belonging to the same economic sectors of all the companies in the sample. Fixed effects (FEs) can be used whenever it is of interest to investigate the impact of time-varying variables in the analysis. FE explores the relationship between dependent and independent variables within an entity (country, person, company, etc.). Each entity has its characteristics that may or may not influence the predictor or independent variables. For instance, the companies’ different social media practices or different sustainability disclosure techniques could influence the performance of a company, that is operating in a sustainability-sensitive industry.
Table 9 illustrates the results of the regression model for ESG_C and the three pillars with FE adaptation. As for the ESG_C, comparing the results reported in Table 9 with those in Table 5, it emerges that when FEs are used, R_T continues to be strongly and positively related to ESG_C. Differently, L_T becomes significant with a p-value <0.05, suggesting a negative relation between likes per tweet and combined ESG activity, and all financial variables are no more significant.
Regression analysis (Model 2) with FE for the ESG_C and ESG pillars
| Variable | ESG_C | EPS | SPS | GPS |
|---|---|---|---|---|
| R_T | 0.327021*** | 0.07918** | 0.08791 | 0.06072 |
| RE_T | 0.93795 | 1.44623*** | 0.06512 | −0.45802 |
| L_T | −0.11765* | −0.03417 | 0.00578 | −0.13522** |
| Q_T | −1.08642 | −5.24824** | −2.65572 | 7.18689 |
| MTW | 0.08373 | 0.07185 | 0.16918*** | 0.30333*** |
| LogTA | 3.67641 | 4.7295 | 2.23627 | 4.94321 |
| D_E | −0.00256 | −0.00125 | −0.00220 | 0.00189 |
| ROA | 0.03590 | −0.06513 | 0.06859 | −0.09868 |
| ROE | −0.01060 | −0.01217** | −0.01433*** | −0.00101 |
| BV_S | 0.00037*** | 0.00040*** | 0.00033*** | 0.00020*** |
| _cons | −15.56114 | −25.5227 | 11.70934 | −50.38975 |
| N | 351 | 351 | 351 | 351 |
| Number of groups | 112 | 112 | 112 | 112 |
| R2 | ||||
| Within | 0.0957 | 0.1532 | 0.1556 | 0.2069 |
| Between | 0.0097 | 0.0790 | 0.0102 | 0.1150 |
| Overall | 0.0085 | 0.0460 | 0.0010 | 0.0840 |
| F(10,111) | 404.49 | 43,704.83 | 235.70 | 233.36 |
| Prob > F | 0.0000 | 0.0000 | 0.0000 | 0.0000 |
| sigma_u | 25.49952 | 27.10771 | 25.99647 | 22.82676 |
| sigma_e | 9.26815 | 6.31329 | 7.33626 | 10.37816 |
| rho | 0.88331 | 0.94855 | 0.926236 | 0.82870 |
Notes:
*p < 0.10; **p < 0.05; ***p < 0.01
Moving to compare the results for the three pillars (EPS, SPS and GPS) using FE with those reported in Table 4, it is possible to highlight that the results of the two kinds of regressions are similar. SPS has not experienced a particular change. Differently is the situation in EPS. In fact, from Table 10, it emerges that unlike the EPS regression not adopting FE, three of the Twitter-related metrics (R_T, RE_T, Q_T) have now become statistically significant. In GPS, instead, L_T has proven to be significant in a confidence level of 90% and the significance level of MTW has moved from 10% to 1%, suggesting that MTW is even more related to the GPS.
Definition of ESG scores
| Score | Definition |
|---|---|
| ESG Combined Score | It is an overall company score based on the reported information in the environmental, social and corporate governance pillars |
| Resource Use Score (RUS) | It reflects a company’s performance and capacity to reduce the use of materials, energy or water and to find more eco-efficient solutions by improving supply chain management |
| Emission Score (ES) | It measures a company’s commitment and effectiveness towards reducing environmental emission in the production and operational processes |
| Environmental Innovation Score (EIS) | It reflects a company’s capacity to reduce the environmental costs and burdens for its customers, and thereby creating new market opportunities through new environmental technologies and processes or eco-designed products |
| Workforce Score (WS) | It measures a company’s effectiveness towards job satisfaction, a healthy and safe workplace, maintaining diversity and equal opportunities and development opportunities for its workforce |
| Human Rights Score (HRS) | It measures a company’s effectiveness towards respecting the fundamental human rights conventions |
| Community Score (CS) | It measures the company’s commitment towards being a good citizen, protecting public health and respecting business ethics |
| Product Responsibility Score (PRS) | It reflects a company’s capacity to produce quality goods and services integrating the customer’s health and safety, integrity and data privacy |
| Management Score (MS) | It measures a company’s commitment and effectiveness towards following best practice corporate governance principles |
| Shareholders Score (SS) | It measures a company’s effectiveness towards equal treatment of shareholders and the use of anti-takeover devices |
| CSR Strategy Score (CSRS) | It reflects a company’s practices to communicate that it integrates the economic (financial), social and environmental dimensions into its day-to-day decision-making processes |
5. Discussion and implications
Sustainability performance is an objective towards which an increasing number of companies are directing their business (Boiral and Henri, 2015; Dissanayake, 2020; Tripathi and Bhandari, 2014; Watson, 2015). The reasons behind this change are many: greater awareness of the need to protect the environment, the establishment of a new corporate humanism, etc. However, this change does not imply the replacement of financial objectives with non-financial ones, but the two types of performance are becoming increasingly interdependent (Maama, 2020; Ruggiero and Cupertino, 2018).
Interestingly, it is useful for companies to understand the variables capable of impacting their sustainability performance, even if it is equally important to identify the tools through which they can influence their pursuit of sustainability performance jointly with financial ones. Thus, a fundamental role could be played by social media, as these are tools through which companies can quickly bring to the attention of companies the aspects of greatest interest to their stakeholders (Fortunati et al., 2020). The achievement of this goal seems to be influenced more by the existence of a Twitter account than by the communication activity that companies make through this particular social media.
During the period 2016–2019, the use of social media does not seem to have contributed strongly to the pursuit and achievement of the sustainability performance reported for the companies included within the sample analysed. Therefore, the results that emerged from the analysis do not allow us to state that companies are driven by the level of engagement, expressed in the various forms of retweets replies such as quotes, with their stakeholders in pursuing their sustainability performance. This happens only for the PSR sub-pillar for which the quotes have a positive and statistically significant effect on performance.
Thus, the necessity to continue to analyse the strategic approach to social media communication emerged (Abbas et al., 2019). Although our result shows that the presence of companies on social media platforms contributes to their sustainability performance, the non-relevance of different activities carried out through social media, such as tweets, retweets, mentions, etc., is evident. In particular, social media activities are much less able to affect sustainability performance if not line in with a change in organisational culture (Ramanadhan et al., 2013). Even, communication through social media could be dangerous if not respectful of some general principles, such as reliability, updating, promptness and concreteness (Reilly and Hynan, 2014).
Social media and more specifically the presence of a Twitter account appears to be interpreted by companies as a sustainability performance in itself and not as a tool through which to manage their sustainability strategy and performance. In this sense, having a Twitter account could be more interpreted as a form of legitimation for companies rather than a real tool through which to manage and pursue sustainability performance (Monfardini et al., 2013). While setting up a profile on social media is not very expensive for a company, it does involve an ongoing engagement with customers through this medium, which requires more financial and non-financial resources to guarantee that continuous effort. Not all the different possibilities to use Twitter seems to be effective in affecting sustainability performance (Abbas et al., 2019). Social media make organisations’ relationships with customers more direct and faster, implying the necessity to start an interaction to govern appropriately. Potentially, the different use of a social media should be coupled with different sustainability objectives and mostly direct to create a competitive advantage for the organisation (Abbas et al., 2019). Only one of the variables developed to measure the use of Twitter by companies (R_T) have shown a strong and positive causal relationship with the general measure of companies’ sustainability performance but not with its pillars and sub-pillars.
Therefore, social media are able to influence the overall sustainability performance (ESG_C) through the construction of a specific identity for companies but not particular aspects of sustainability performance (Eccles et al., 2012). This reflection is also confirmed by the significant and positive relationship found between the number of months of the existence of companies’ Twitter accounts and their sustainability performance. A relationship exists significantly both at the overall level and at the pillars and sub-pillars level. This result would suggest that exposure to the public through social media channels leads companies to strengthen their commitment to sustainability over time in order not to damage the legitimacy gained in front of their stakeholders.
With respect to sustainability, social media seem to play an important role for companies more for marketing purposes than for building a corporate culture. The governance pillar and its sub-pillars have, compared to other pillars and sub-pillars, a less significant relationship with the variables related to the use of Twitter. Additionally, the PRS sub-pillar as performance dimension is the most impacted by the relationships and reactions of corporate stakeholders. Thus, the companies’ capacity to produce quality goods and services by integrating the customer’s health, safety, integrity and data privacy is the dimension of sustainability performance that is mostly negatively impacted by the Q_T variable. It seems that an increasing number of quotations imply a reduction of companies’ focus on that dimension of sustainability performance. It seems that companies strategically define a certain level of PRS performance whose achievement makes companies feeling as they do not need any more to care about that performance.
The role played by the control variables is another interesting issue from the previous analysis. Sustainability performance, both at the general and the pillar and sub-pillar levels, seems affected by companies’ size and the amount of equity per share. These results confirm the idea that sustainability performance is mostly pursued by bigger companies [log(TA)] or companies characterised by a higher financial solidity (BV_S) (Ruggiero and Cupertino, 2018). The situation is slightly different if the effects coming from the belonging of the companies analysed to two specific economic sectors, energy and utilities are taken into consideration. While there is not a relevant difference for the variables related to the use of Twitter, the results highlight that companies’ size is no more relevant for explaining sustainability performance while the amount of equity per share still is. Therefore, dividends policies implemented by companies could affect their sustainability performance. If the profitability of companies is reinvested within the business, resulting in an increase of equity, it implies a positive effect on the possibility for those companies to pursue and achieve higher sustainability performance.
6. Conclusions and future research
This paper contributes to two streams of literature: social media and CSR (Kolk and van Tulder, 2010; Leonardi and Vaast, 2017). As for the social media literature, the paper highlights that the use of social media affects companies’ approach to sustainability mainly as a tool for reaching a higher level of legitimisation, even if they are not yet used/capable of influencing companies in pursuing specific dimensions of sustainability performance. Additionally, social media produce their effect more through the widespread content published on a platform such as Twitter than the followers’ interaction with specific contents.
As for CSR, the results of the analysis put in evidence that sustainability performance is a complex and composite result deriving from the effects exercised by some drivers, such as social media. These drivers affect sustainability performance according to their life cycle during which their impact on companies’ sustainability performance increases. Additionally, the results have confirmed the idea that size and financial solidity are positively related to companies’ sustainability performance, but these results could be affected by the economic sector to which companies belong.
A practical contribution of this paper comes from the idea that, in using social media, managers need to manage differently the whole social media profile of a company and its possible different uses. The various possibility of interacting with stakeholders through a social media (in our case, tweets, retweets, likes, replies and quotes) must be managed distinctively and appropriately to affect sustainable performance. If they are thought as a simple consequence of the existence of a social media profile, a business could lose the opportunity to affect positively the interaction with its stakeholders and produce an effect on its suitability performance.
The paper has also some limitations that could suggest further research in the future. These limitations are related to the subject and object of analysis. As for the former, the analysis should be carried out on companies that are non-public and/or operating in other economic sectors. It would be interesting to compare the result of this paper with those relative to the use of different social media such as Facebook or Instagram as these social media are differently structured and directed to a different kind of audience.

