

Purpose
This paper aims to verify whether the integration of sustainability in executive compensation positively affects firms’ non-financial performance and whether corporate governance characteristics enhance the relationship between sustainability compensation and firms’ non-financial performance and to expand the domain of the impact of sustainability on non-financial performance.
Design/methodology/approach
This analysis is based on a sample of companies listed on the Milan Italian Stock Exchange from the Financial Times Milan Stock Exchange Index over the 2016–2020 period. Regression analysis was used by using data retrieved from the Refinitiv Eikon database and the sample firms’ remuneration reports.
Findings
The findings of this paper show that embedding sustainability in executive compensation positively affects firms’ non-financial performance. The results of this paper also reveal that specific corporate governance features can improve the impact of sustainability on non-financial performance.
Research limitations/implications
This analysis is limited to Italian firms included in the Financial Times Milan Stock Exchange Index; however, the findings are highly significant.
Practical implications
The findings provide regulators with useful insights for considering the integration of sustainability goals into executive remuneration. Another implication is that policymakers should require – at least – listed firms to fulfil specific corporate governance structural requirements. Finally, the findings can provide investors and financial analysts with a greater awareness of the role played by executive remuneration in the long-term value-creation process.
Originality/value
This paper contributes to addressing the relationship among sustainability, remuneration and non-financial disclosure, drawing on the stakeholder–agency theoretical framework and focusing on Italian firms. This issue has received limited attention with controversial results in the literature.
1. Introduction
Over the past few years, sustainability has received increasing attention at the international level, becoming a critical issue for the firms’ long-run success because of several factors, such as the European commitment to the energy transition, the increasing importance played by climate risks, the international attention paid to the interconnections between finance and sustainability and the regulation aimed at introducing specific disclosure requirements with regard to the firm’s impacts on the environment and the community [United Nations, 2015, 2020; European Commission, 2013, 2019, 2021; High-Level Expert Group on Sustainable Finance (HLEGSF), 2018]. Firms are more aware of the relevance of integrating sustainability into their decisions to facilitate value creation according to global responsibility, fairness, transparency, inclusion and stakeholder engagement principles (Adamo et al., 2020; Coronella et al., 2018; D’Amico and Biscotti, 2013; Faizul, 2017; Flammer et al., 2019; Kim et al., 2015; Matsumura et al., 2014; Salvioni and Gennari, 2017; Salvioni and Almici, 2020).
In this context, the sustainability concept embraced in this study is based on the transition of this concept from the macro perspective of the Brundtland Report to the firm’s micro perspective introducing the so-called “corporate sustainability”, which is the firm’s capability to achieve its economic goals by either reducing or mitigating its impact on the environment and the community (Dyllick and Hockerts, 2002; Knoepfel, 2001; van Marrewijk and Verre, 2003; Wilson, 2003; World Commission on Environment Development, 1987). Namely, the corporate sustainability concept embraced in this study refers to the firm’s ability to optimize at the same time as the economic, social and environmental performance by ensuring the full satisfaction of all stakeholder’s expectations.
In this regard, executive remuneration is seen as a suitable tool for enabling performance improvement (economic and non-economic), as long as it is linked to non-financial goals (Berrone and Gomez-Mejia, 2009; Callan and Thomas, 2011, 2014; Deckop et al., 2006; Lacy and Hayward, 2013; Lacy et al., 2010; Mahoney and Thorn, 2006). Self-regulation bodies have also emphasized the relevance of integrating socio-environmental goals into corporate remuneration policies (Italian Corporate Governance Committee, 2020).
In the current research, these non-economic goals have a broad and general meaning that does not strictly match the meaning of Agenda 2030 sustainable development goals.
In this study, the sustainability goal expressions identify a general level of sustainability’s pervasiveness with reference to social and environmental dimensions; with reference to the first one, sustainability refers, for example, to human rights’ safeguard, equal opportunities and accessibility of goods and services in favour of all stakeholders. The environmental dimension refers to the reduction of greenhouse gas emissions by mitigating impacts on the ecosystem and biodiversities. In general, the assessment of the integration of sustainability issues in chief executive officer (CEO) compensation implies verifying whether the compensation is determined considering also the attention paid to safeguard the environment and the community. In this regard, the sustainability integration in CEO remuneration is identified as a general condition for orienting the firm’s activity to improve the relationships between firm, environment and community.
Despite the acknowledged relevance of this issue, limited analysis has been conducted on the impact of the integration of sustainability goals into executive remuneration policies on non-financial performance. In addition, the available literature includes controversial results because of inconclusive evidence (Berrone and Gomez-Mejia, 2009; Cai et al., 2011; Deckop et al., 2006; Hong et al., 2016; Mahoney and Thorn, 2006; McGuire et al., 2003; Renwick et al., 2012; Russo and Harrison, 2005; Stanwick and Stanwick, 1998).
Thus, this study aims to fill this research gap by verifying whether the integration of sustainability issues into executive remuneration enhances non-financial performance and whether specific corporate governance features positively impact the relationship between sustainability in remuneration and non-financial performance, which refers – in this research – to the achievement of environmental and social results, mainly in terms of mitigating the firm’s impacts on these dimensions (Faizul, 2017). In this research, the concept of non-financial performance is chiefly related to that of sustainability, with a focus on the results achieved in the social and environmental context, namely, the non-financial performance is proxied by environmental, social and governance (ESG) scores.
The theoretical framework used to investigate the above-explained issue is the stakeholder–agency theory (Hill and Jones, 1992), which assumes that an improvement of social and environmental performance because of economic incentives in favour of CEOs is an opportunity to align management’s and stakeholders’ interests. In general, this study aims to verify whether a CEO’s compensation can contribute to overcoming the well-known problems underlined by stakeholder–agency theory through the improvement of non-economic performance in favour of all stakeholders. Within this theoretical framework, sustainability is, thus, a common view that links stakeholders and management by providing the opportunity to eliminate opportunistic behaviours and interests’ misalignment.
To test these hypotheses, this study examined listed firms on the Milan Stock Exchange from the Financial Times Milan Stock Exchange Index (FTSE MIB) over the 2016–2020 period through a regression analysis using data retrieved from the Eikon Refinitiv database and from textual analysis of firms’ remuneration reports.
This paper contributes to the literature on sustainability and non-financial performance by combining corporate governance characteristics and sustainability in executives’ remuneration to evaluate the impact on non-financial performance using the stakeholder–agency theoretical framework (Hill and Jones, 1992).
In particular, this research’s contribution refers to four main aspects: the theoretical framework used enables a different analysis of the topic, as compared to other traditional approaches (typically, the classical version of agency theory and the institutional theory); the analysis of the role played by CEO remuneration as an opportunity to facilitate the convergence of traditionally conflicting interests by providing further interesting cause for reflection compared to the extant literature underlying different and controversial results; the analysis of the relationships between sustainability-based remuneration and non-financial performance, encompassing also the corporate governance topic, through the selection of specific corporate governance characteristics treated as independent variables rather than simple control variables (Adu et al., 2022a); and the focus on the Italian firms that are usually less frequently investigated regarding this topic, as the attention has been usually concentrated either on other countries’ firms or those operating in specific sectors.
The focus is on Italian firms because of the recent recommendation of the Italian Corporate Governance Code to integrate, in CEO remuneration, specific components based on the achievement of social and environmental goals, stimulating the analysis of a quite recent phenomenon (Italian Corporate Governance Code, 2020). At the same time, these aspects justify the reason that previous studies have been carried out focusing on non-Italian firms in which sustainability-based compensation has been more widespread and practiced since long ago.
In addition, the selection of Italian firms enables the deepening of the analysis of the moderating role played by a typical insider corporate governance system emphasizing the primary monitoring role of the board of directors aimed at ensuring that the management activity safeguards all stakeholders’ interests.
The research findings will be of interest to regulators, investors and financial analysts; the former can get useful insights for mandating the integration of sustainability goals into executive remuneration. Investors and financial analysts can benefit from this research by gaining a clearer view of the key variables for long-term value creation.
The rest of the paper is structured as follows. Section 2 explains the theoretical framework and includes an analysis of the previous literature, leading to the development of the research hypotheses. Section 3 explains the research methodology and data collection. Section 4 highlights and discusses the main results. Finally, Section 5 draws conclusions.
2. Theoretical framework, previous research and hypothesis development
2.1 Stakeholder–agency theory
Agency theory is based on the belief that managers (agents) and shareholders (principals) have generally misaligned interests, and management tends to behave opportunistically by taking advantage of the information asymmetry between agents (who can access the information in the easiest way) and principals, implying the so-called “agency problem” (Arora and Alam, 2005; Flammer and Bansal, 2017; Holmström, 1989; Jensen and Meckling, 1976; Lazear, 1998; Narayanan, 1985). The opportunistic behaviour of management generally derives from the so-called “separation between ownership and control”, which makes it difficult and costly for the shareholder to monitor CEOs’ decisions and activity (Eisenhardt, 1989).
However, the increasing relevance of corporate social responsibility (CSR) principles and all stakeholders’ expectations (both economic and non-economic) has progressively led to a broader analysis of the classical agency issue, believing that management’s behaviour may impact not only shareholders but also all the other stakeholders (Martin et al., 2020; Werder, 2011; Wowak et al., 2015). In this regard, a new approach has been developed known as stakeholder–agency theory, based on the idea that other stakeholders – in addition to shareholders – have legitimate claims on the firm and that management acts on the basis of an agency mandate (Barney, 2018; Brennan and Solomon, 2008; Coombs and Gilley, 2005; Hill and Jones, 1992; Jones et al., 2016; Tirole, 2001; Zolotov et al., 2021).
In this research, the stakeholder–agency framework has been used, as it is based on a broader perspective compared to the classical agency theory; particularly, according to the selected framework, all the stakeholders have a legitimate claim on the firm and not only shareholders, as, instead, theorized by the classical version of agency theory. In this regard, the relevance of an implicit contractual agency relationship between the CEO and stakeholders is emphasized, assuming that all involved interests are relevant (both economic and non-economic). In particular, CEOs should orient their firms’ activities towards principles such as global responsibility, transparency and equity to protect the ecosystem and the biodiversities, as well as the community, and be aware of the increasing interconnection with the economic results. It is clear that stakeholder–agency theory underlines a shift from shareholder supremacy towards a stakeholder perspective, implying the need for management to consider all stakeholders’ expectations. In this regard, Hill and Jones (1992) stated: “There is a parallel between the general class of stakeholder-agent relationships and the principal-agent relationships articulated by agency theory” (p. 134).
According to classical agency theory’s view, the need to align managers’ and shareholders’ interests emphasizes the need to control management behaviours through a specific body, which traditionally is the board of directors, and to use specific incentives to orient managers’ behaviours (Jensen and Meckling, 1976).
Indeed, the use of specific remuneration incentives can facilitate this convergence process by reducing monitoring costs (Collier, 2008; de Villers et al., 2011; Hillman and Dalziel, 2003; Ibrahim and Angelidis, 1994; Ji, 2015; Liao et al., 2015; Mahoney and Thorn, 2006). Scholars emphasize how CEO remuneration facilitates the alignment of interests between management and shareholders (Arora and Alam, 2005) by orienting the former towards sustainability. The literature has addressed executive remuneration as a mechanism that can be used to reduce agency problems (Bruce et al., 2005; Connelly et al., 2011). In particular, remuneration policies can promote alignment between shareholders and management, especially if they are associated with sustainability goals and a corporate governance system that facilitates the establishment of a long-term orientation towards sustainability.
In the above-explained context, stakeholder–agency theory is a fundamental interpretative lens to explain how the executives’ remuneration – whether it is sustainability-oriented – may facilitate the convergence between potentially conflicting interests: on the one hand, management interests and, on the other hand, all relevant stakeholders’ interests (including the shareholders), whose knowing expectations have become more and more focused on the firms’ impacts on the ecosystem and community (in terms of human rights safeguard, equal opportunities, equity, etc.). In detail, sustainability orientation is an opportunity to facilitate the alignment between management, shareholders and the other stakeholders, as it enables the creation of benefits that can be shared by all of them. Indeed, the enhancement of economic performance is strongly intertwined with the firm’s capacity to respect the environment and the community; in this regard, the sustainability orientation enables the concurrent improvement of all firm’s performance (economic and non-economic) by overcoming all the problems related to agency theory (perspective misalignment between management and stakeholders, monitoring costs, opportunistic behaviours and information asymmetry). Sustainability traditionally intended implies the concurrent enhancement of social, environmental and economic results, identifying a point of agreement between management’s and stakeholders’ expectations by enabling them to solve the so-called “agency problem” (Buckley, 2021; Nguyen et al., 2021a, 2021b; Salvioni and Gennari, 2017).
In this context, the executives’ remuneration can be – as the literature underlined – a tool for orienting management activities towards the respect of the environment, the safeguard of human rights and the enhancement of economic results by facilitating the convergence of involved interests (Arjaliès and Mundy, 2013; Berrone and Gomez-Mejia, 2009; Callan and Thomas, 2011, 2014; Groen et al., 2012; Hill and Jones, 1992; Hong et al., 2016; Lacy et al., 2010; Lacy and Hayward, 2013). To reach this goal, remuneration must also consider the achievement of specific socio-environmental results in addition to economic ones. Indeed, the forecast of economic benefits based on the achievement of social and environmental results drives management to orient its activity towards greater sustainability by promoting the protection of all relevant stakeholders’ interests and the defeat of agency problems.
Thus, executive remuneration should integrate both short- and long-term interests, referring to shareholders and all the other stakeholders and respecting the conditions of broad performance integration (economic and non-economic). This shift should improve the firm’s impacts on the environment and the community according to an increasing orientation towards sustainability by facilitating the convergence between interests, mitigating agency problems and reducing associated costs.
Thus, the stakeholder–agency theory is an appealing theoretical framework for explaining how CEO remuneration – whether sustainability-based – can facilitate the improvement of social and environmental performance by ensuring the fulfilment of all stakeholders’ expectations and by motivating the management through specific economic incentives. With reference to the current research, the expression “sustainability-based” means that remuneration is determined by considering the efforts spent and the results achieved in the social and environmental context.
2.2 Sustainability in executive compensation and firms’ non-financial performance
Remuneration is a potential tool for orienting firm activity towards sustainability, especially when financial incentives depend on the achievement of social and environmental goals (Donaldson and Preston, 1995; Jones and Wicks, 1999). In this regard, the remuneration structure can be an important mechanism for improving firms’ economic and socio-environmental performance, whose disclosures have become increasingly integrated (Lai and Stazzecchini, 2021).
In this regard, CEO remuneration is a potential tool for aligning the interests between management and relevant stakeholders by overcoming traditional agency problems. Indeed, the selection of economic incentives based on the achievement of social and environmental results may orient a firm’s activity towards sustainability; thus, the concurrent respect of the environment, human rights and economic expectations identifies a point for agreement between different players. In this context, the relationship between remuneration and non-financial performance – intended as the achievement of social and environmental results – becomes fundamental, as underlined by many national and international bodies.
Several recommendations emphasizing the importance of linking non-economic long-term goals to executives’ compensation have been formulated at the international and national levels. For example, the United Nations (2016) Principles for Responsible Investment stated, “linking environmental, social and governance (ESG) performance to pay can help hold executive management to account for the delivery of sustainable business goals […] companies should link appropriate ESG metrics to reward systems in a way that they form a meaningful component of the overall remuneration framework” (pp. 4-6). Similarly, the World Business Council for Sustainable Development (WBCSD) (2010) stated that “compensation can be a powerful tool, within an overall approach to creating a culture of sustainability” (p. 12). In the Italian context, the Italian Corporate Governance Code (2020) invites the board of directors to align a firm’s remuneration policy with sustainability goals, requiring that the variable component be mainly long-term based and linked to non-financial variables. Similarly, the Association of Italian Joint Stock Companies (Assonime) stated that approximately one-third of the Milan Electronic Stock Exchange-listed companies link the CEO remuneration characteristic to at least one non-financial goal; this is true, especially for large companies (79% of FTSE MIB-listed companies) and those operating in the financial industry (63%) (ASSONIME, 2020). Likewise, the Report 2020 on the non-financial reporting of Italian listed firms emphasized the increasing integration, compared to previous years, of sustainability goals in executive remuneration (Italian National Commission for the Listed Companies and Stock Exchange, 2020). Among those listed on the Milan Electronic Stock Exchange, 63 firms linked CEO remuneration to sustainability, mainly focusing on the short-term remuneration component (53 cases). At the international level, firms are increasingly using the remuneration model based on sustainability: 87.5% of the French Cotation Assistée en Continu 40-listed companies identify a direct link between compensation and socio-environmental goals. In Germany, the UK and Spain, the percentages are 40.0%, 35.0% and 48.6%, respectively [Alta Scuola Impresa e Società (Altis), 2021]. These data show the increasing inclusion of sustainability goals in executive remuneration policies, emphasizing the need to verify whether this integration actually contributes to the improvement of non-financial performance.
Despite being standard setters, practitioners and other eminent bodies recognize the importance of a subordinate part of CEO remuneration to the achievement of specific non-economic results (social and environmental), scholars have addressed this issue only partially, either by focusing on specific aspects, such as disclosure (Baysinger and Hoskisson, 1990; Hartikainen et al., 2021; Kortelainen, 2008; Naser et al., 2002) and the role played by environmental goals (Francoeur et al., 2017; Lothe et al., 1999; Lothe and Myrtveit, 2003; Russo and Harrison, 2005; Stanwick and Stanwick, 2001) or by considering only specific geographical areas (Coombs and Gilley, 2005; Maas and Rosendaal, 2016; Mahoney and Thorn, 2005). Few studies have investigated the relationships between remuneration and non-economic performance, leading to controversial results (Berrone and Gomez-Mejia, 2009; Cai et al., 2011; Deckop et al., 2006; Hong et al., 2016; Maas and Rosendaal, 2016; Mahoney and Thorn, 2006; McGuire et al., 2003; Renwick et al., 2012; Russo and Harrison, 2005; Stanwick and Stanwick, 1998). In addition, previous studies used different theoretical approaches, such as the traditional version of agency theory (Abdelmotaal and Abdel-Kader, 2016; Chang et al., 2012; Deckop et al., 2006; Jensen and Murphy, 1990; Faizul, 2017; Hong et al., 2016; Hou et al., 2013), as well as the institutional and non-institutional theory (Adu et al., 2022a, 2022b; Berrone and Gomez-Mejia, 2009), while the stakeholder–agency framework has been used less frequently by focusing almost exclusively either on the environmental dimension or on specific geographical areas rather than on Italy (Kartadjumena and Rodgers, 2019; Winschel, 2021; Zolotov et al., 2021).
The theoretical framework used in this research is the stakeholder–agency theory, which assumes that management is potentially induced to behave opportunistically by harming all stakeholders. Thus, there is a need to implement specific mechanisms for orienting management’s behaviour towards goals, ensuring the alignment of all interests converging on the firm (economic and non-economic). It is assumed that this alignment may be ensured by sustainability, whose meaning refers to the concurrent enhancement of economic, social and environmental results. To reach this goal, remuneration may be an effective tool as long as some components are determined, considering the achievement of specific targets in terms of improving a firm’s impact on the social and environmental dimensions. In this regard, this study contributes to the extant literature by verifying whether the link between executives’ remuneration and the achievement of social and environmental goals may actually improve non-financial performance (especially social and environmental). If so, then CEO remuneration could facilitate the alignment of the involved interests.
In this regard, this research is particularly contributing, as previous studies on the relationship between the integration of sustainability issues in CEO remuneration and non-financial performance have underlined controversial results.
Some authors have underlined the lack of significant relationships between executive remuneration and non-financial performance as well as the presence of negative relationships, implying that CEO compensation does not affect the convergence of management’s and stakeholders’ interests (Cai et al., 2011; Coombs and Gilley, 2005; Stanwick and Stanwick, 1998; McGuire, 2003; Russo and Harrison, 2005). McGuire et al. (2003) demonstrated that different components of remuneration (short term and long term) have no impact on social performance or CSR-oriented behaviours. In particular, they emphasized that socially good performance is not affected by decisions about executive remuneration, while weak performance is negatively correlated with high levels of compensation and the main use of long-term goals (McGuire et al., 2003). Cai et al. (2011) examined how CSR influences CEO compensation by analysing 11,215 US firms over the 1996–2010 period; they found a negative relationship between social corporate responsibility and total compensation. They demonstrated how, generally, more responsible firms pay their CEOs less than less responsible firms, which need to mitigate conflicts of interest between managers and different stakeholders (Cai et al., 2011). Coombs and Gilley (2005) analysed the impact of stakeholder engagement on CEO remuneration by identifying a relevant relationship that is, however, negative. In particular, using a longitudinal database of 406 Fortune 1,000 firms, the authors showed how the attention paid to relevant stakeholders’ expectations (both economic and non-economic) can jeopardize managers’ remuneration (Coombs and Gilley, 2005). Russo and Harrison (2005) investigated the effects on CEO remuneration related to the integration of specific incentives based on the achievement of environmental goals by detecting the lack of a relevant relationship between the involved variables, likely because of the belief that managers (especially environmental quality managers) do their best to reduce emissions, regardless of economic incentives. The authors stated, “our results provide weak support for the idea that incentive systems can elicit desired environmental outcomes” (Russo and Harrison, 2005, p. 590).
Stanwick and Stanwick (1998) analysed the critical characteristics that impact corporate social performance (CSP): firm profitability, charitable giving, environmental emissions, women and minority members of the board of directors, women and minority members within a firm and its CEO’s annual salary and monetary bonus. The selected variables for the listed companies included in the Business Ethics 100 Index showed an opposite relationship between CEO remuneration and non-financial performance to demonstrate that economic incentives do not contribute to a higher orientation towards global responsibility principles if cultural renewal does not occur. The authors argued, “The negative relationship between CEO pay and CSP shows that based on pay alone, CEOs would not encourage the development and implementation of social programs. […] The Board of Directors may feel that CSP should not be a measure to incorporate when calculating the salary level of CEO” (Stanwick and Stanwick, 1998, p. 91).
Conversely, other scholars have found a positive relationship between remuneration and non-financial performance, especially regarding the so-called CSP and when specific non-economic incentives are selected (Adu et al., 2022a; Arjaliès and Mundy, 2013; Berrone and Gomez-Mejia, 2009; Callan and Thomas, 2011, 2014; Deckop et al., 2006; Groen et al., 2012; Hong et al., 2016; Lacy and Hayward, 2013; Lacy et al., 2010; Mahoney and Thorn, 2006). Hong et al. (2016) showed how CSR incentives can be an effective tool for improving social performance and, in general, sustainability. In particular, they stated that “executive compensation for CSR leads to more CSR activities” (Hong et al., 2016, p. 199). Similarly, Deckop et al. (2006) focused on the relationships between the composition of CEO remuneration and CSP for 318 firms in the Standard and Poor 500. The authors showed that short-term incentives are negatively correlated with social performance, while long-term incentives are positively correlated. Similarly, Ji (2015) demonstrated how the long-term components of senior executives’ remuneration positively affect US firms’ social performance. Similarly, Adu et al. (2022a) observe, by analysing 262 UK listed firms from 2009 to 2018, the presence of a positive relationship between sustainability-based compensation and sustainable business practices, except for the CO2 emissions which are, conversely, negatively affected by the above stated variable.
Ackerman (1975) and Ricart et al. (2005) argued that the integration of sustainability goals into CEO remuneration requires a shift from an economic-based perspective to a broader one aimed at safeguarding all stakeholders. The above-stated studies support the thesis that remuneration – whether sustainability-oriented – may contribute to the improvement of non-financial performance by facilitating the alignment between involved interests.
Mahoney and Thorn (2006) analysed remuneration components by selecting those suitable for improving non-financial performance through CEOs’ orientation towards more responsible behaviours. In particular, the authors examined the impact of remuneration composition on CSR engagement and CSR strength for a sample of 77 Canadian firms (Mahoney and Thorn, 2006). The results showed that a positive relationship exists between CEO salary and CSR weaknesses, CEO bonus and CSR strengths and CEO stock options and total CSR. Regarding remuneration structure, Callan and Thomas (2014) demonstrated how the pay-for-performance relationship impacts CSP more strongly when remuneration components are mainly long term.
Regarding environmental performance, Berrone and Gomez-Mejia (2009) investigated the most polluting industries in the USA and found a positive bidirectional relationship between environmental protection policies and CEO remuneration. To support the idea that remuneration based on socio-environmental goals can improve non-economic performance, Lacy and Hayward (2013) interviewed approximately 800 CEOs worldwide. Their findings demonstrated that the majority think that integrating sustainability goals into executive remuneration can contribute to sustainable development and positively impact non-financial performance (Lacy and Hayward, 2013; Lacy et al., 2010).
This review of the literature shows a research gap regarding the relationship between the integration of sustainability in CEO remuneration and non-financial performance as a tool to promote the convergence between management’s and stakeholders’ interests. The main findings are controversial, and the studies mainly focused on economic incentives by neglecting social and environmental incentives that structurally refer to the sustainability issue. Thus, this research aims to verify whether the integration of sustainability in CEO remuneration contributes to the improvement of non-financial performance; if so, then it is possible to state that CEO remuneration, whether sustainability-oriented, may reduce agency costs through the promotion of a shared perspective identified by sustainability.
The following is the first hypothesis to be tested:
Integrating sustainability into executive compensation positively affects firms’ non-financial performance.
2.3 The effect of corporate governance on the relationship between executive compensation and non-financial performance
Corporate governance systems may improve social and environmental performance, as long as CEO compensation is sustainability-oriented. Indeed, specific corporate governance characteristics facilitate the establishment of a sustainability orientation of governance bodies, facilitating the integration of sustainability principles into a firm’s strategic vision (Galbreath, 2018; Jamil et al., 2021; Kock et al., 2012; Michelon and Parbonetti, 2012; Salvioni and Almici, 2022).
Corporate governance systems may enhance non-financial performance by affecting the integration of sustainability in CEO remuneration. The board of directors’ contribution is twofold: it plays a relevant role in determining CEO compensation and it monitors management activities to enable alignment between management’s and stakeholders’ interests.
The literature has clearly emphasized how sustainability enables the fulfilment of stakeholders’ (including shareholders) expectations; thus, they find a relevant opportunity to protect their interests in the achievement of non-economic goals (Al-Tuwaijri et al., 2004; Berrone and Gomez-Mejia, 2009; Cai and He, 2014; Clarkson et al., 2011; Comyns and Figge, 2015; El Ghoul et al., 2011; Gallego-Alvarez et al., 2015; Kim et al., 2015; Matsumura et al., 2014; Orlitzky et al., 2003; Salvioni and Gennari, 2017).
Thus, shareholders will be interested in inducing management to pay attention to non-economic expectations by facilitating the alignment of interests (shareholders’ and management’s), which are traditionally seen by agency theory as conflicting.
In particular, in this study, the agency theory approach is integrated into a broader perspective (stakeholder–agency theory), based on the identification of all stakeholders as principals instead of only shareholders. In this regard, corporate governance characteristics can positively affect the relationship between CEO compensation and non-financial performance, facilitating the convergence of interests that have been traditionally depicted as conflicting.
In this regard, the board of directors plays a dual role by reducing agency costs and aligning the involved interests, as the board first formulates corporate remuneration policies by enabling the integration of socio-environmental variables in addition to economic variables (Adu et al., 2022b; Ji, 2015) and, second, ensures through its monitoring activity that management also pursues long-term non-financial goals (Hillman and Dalziel, 2003). The board of directors’ monitoring activity and the related orientation towards sustainability may increase whether this governance body shows specific structural features.
Scholars have shown how some corporate governance features may imply greater attention to social and environmental dimensions by improving non-financial performance, whose results refer to the relationship between firm, ecosystem and community (de Villers et al., 2011; Flammer and Bansal, 2017; Faizul, 2017; Hillman and Dalziel, 2003; Ludwig and Sassen, 2021; Mallin and Michelon, 2011). Other studies showed that a good corporate governance system emphasizes the positive relationship between CEO remuneration and orientation towards “normal CSR”, intended as the optimal level of CSR investments aimed at increasing shareholders’ value (Jian and Lee, 2015). The above-stated studies underline the opportunity to verify whether specific corporate governance characteristics can facilitate the alignment of interests converging on the firm, strengthening the management orientation – as the effect of a sustainability-based remuneration – towards the enhancement of the social and environmental results.
Thus, the following hypothesis is posited:
Corporate governance characteristics have a positive effect on the relationship between sustainability compensation and firms’ non-financial performance.
In particular, scholars mainly focus on the following board structural characteristics: board members’ independence and board size, the presence of female board members, the establishment of a sustainability committee, CEO–chair separation and the independence of the compensation committee members. These characteristics are considered relevant factors, enabling firm orientation towards sustainability as well as promoting management’s responsible behaviours with positive effects on non-financial performance (de Villers et al., 2011; Faizul, 2017; Ibrahim and Angelidis, 1994; Liao et al., 2015; Ludwig and Sassen, 2021; Salvioni et al., 2016; Singh et al., 2001).
The literature shows a positive relationship between board members’ independence and their orientation towards sustainability. Scholars have argued that, compared to non-independent members, independent members ensure more effective control over management activities by reducing agency costs (Alipour et al., 2019; Crifo et al., 2019; de Villers et al., 2011; Garcia-Sanchez et al., 2018; Mallin and Michelon, 2011; Pucheta-Martinez et al., 2019). As independent members are not engaged in managing the firm, they can reduce the risk of opportunistic management behaviours by enabling more effective control over the firm’s activities (Coffey and Wang, 1998; Liao et al., 2015). This emphasizes the need to verify whether board independence is a characteristic that positively affects the impact of the integration of sustainability in CEO remuneration on non-financial performance:
Ceteris paribus, the board of directors’ independence has a positive effect on the relationship between sustainability compensation and firms’ non-financial performance.
In detail, this study investigates the effects related to the independence of compensation committee members. The Italian Corporate Governance Committee (2020) recommends that this committee be composed chiefly of independent directors, among whom a president must be appointed. To the author’s knowledge, no studies have focused on this topic. This characteristic can positively contribute to the improvement of non-financial performance (social and environmental results), as this body is actively involved in the formulation of remuneration policies. Thus, the following hypothesis is posited:
Ceteris paribus, the compensation committee’s independence has a positive effect on the relationship between sustainability compensation and firms’ non-financial performance.
The presence of female directors is one of the most analysed aspects by scholars in terms of board diversity. Most of the studies identified a positive relationship as long as at least two-thirds of board members are women (Ben-Amar et al., 2017; Cordeiro et al., 2020; Fernandez-Feijoo et al., 2014). In general, female directors show a stronger global responsibility orientation (social and environmental), as they are more committed than male directors to pursuing sustainability goals by promoting initiatives aimed at safeguarding the environment and the community (Ben-Amar et al., 2017; Coffey and Wang, 1998; Glass et al., 2015; Huse and Solberg, 2006; Landry et al., 2014; Liao et al., 2015; Nielsen and Huse, 2010; Rao and Tilt, 2016; Willows and van der Linde, 2016). Conversely, a few scholars have found a negative relationship (Cucari et al., 2018; Endrikat et al., 2020; Nadeem et al., 2020; Shamil et al., 2014). Therefore, based on the above, the following hypothesis is posited:
Ceteris paribus, gender diversity has a positive effect on the relationship between sustainability compensation and firms’ non-financial performance.
The presence of large boards enables firms to attain the skills and expertise required in the socio-environmental field (Booth and Deli, 1996; de Villers et al., 2011), in addition to monitoring management activity in a more effective way (Endrikat et al., 2020; Fama and Jensen, 1983; Lau et al., 2016; Mudiyanselag, 2018). Large boards should enable firms to face effectively with new social and environmental challenges (i.e. the energy transition and poverty reduction) by relying on highly specialized skills. However, a few authors have argued that large boards may reduce the efficiency of decision-making and monitoring, as they may facilitate free-riding behaviours and conflict of interest situations (Core et al., 1999; Prado-Lorenzo and Garcia-Sanchez, 2010; Uwuigbe et al., 2011; Walls et al., 2012). The analysis of this characteristic requires testing the following hypothesis:
Ceteris paribus, board size has a positive effect on the relationship between sustainability compensation and firms’ non-financial performance.
The CEO–chair separation is considered a feature that may improve the quality of the board’s monitoring activity by ensuring suitable protection for all stakeholders and their expectations (economic and non-economic). The CEO–chair separation safeguards long-term goal achievement according to shared value creation conditions by fighting opportunistic behaviours aimed at pursuing personal interests (Finkelstein and D’Aveni, 2017; Kelton and Yang, 2008). The lack of separation between the CEO and the chair may imply agency and information asymmetry problems, as well as a reduction in the effectiveness of the board’s control over management activities (Boyd, 1994; de Villers et al., 2011; Hambrick and D’Aveni, 1992). Therefore, this study aims to verify the following hypothesis:
Ceteris paribus, CEO–chair separation has a positive effect on the relationship between sustainability compensation and firms’ non-financial performance.
Regarding the establishment of a sustainability committee (CSR committee, ethical committee, business conduct committee, ESG committee, environmental committee, etc.), the majority of scholars have found a positive relationship between this governance feature and sustainability orientation by promoting the alignment of involved interests and overcoming the “agency problems” (Daddi et al., 2019; Endrikat et al., 2020; Gennari, 2019; Hussain et al., 2018; Orazalin, 2020; Salvioni and Gennari, 2019). The sustainability committee is generally seen as an enhancing condition for the effectiveness of the board’s monitoring activity over management, especially for socio-environmental issues (Burke et al., 2019; Lam and Li, 2008; Peters and Romi, 2014; Porter and Kramer, 2011). Thus, there is a need to test the following hypothesis:
Ceteris paribus, the establishment of a sustainability committee has a positive effect on the relationship between sustainability compensation and firms’ non-financial performance.
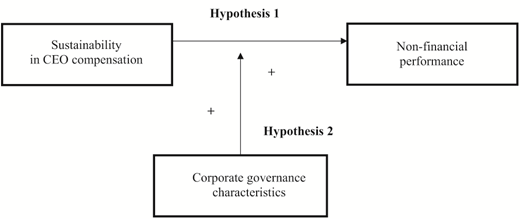
The study’s two main hypotheses (H1 and H2) are depicted in Figure 1.
3. Research methodology
3.1 Research sample
This study included the Milan Stock Exchange FTSE MIB-listed companies over a five-year period from 2016 to 2020, with 400 observations. The year 2016 is selected as the starting year because the sustainability issue received much attention that year from policymakers – as a result of the Legislative Decree 254/2016 regarding non-financial disclosure – and international organizations (i.e. the United Nations’ Agenda 2030). This study is based on Italian firms, as since 2012, according to Legislative Decree 259/2010, they must publish a specific report about corporate remuneration policies. This regulation makes this report mandatory by widening the disclosure recommended by the 2006 Italian Corporate Governance Code. In particular, the focus is on FTSE MIB-listed firms, as this index includes the most capitalized Italian firms, covering about 80% of the total Italian market capitalization. The focus on these companies is mainly based on the expectation that the larger the firms, the better their disclosures are (Fahad and Nidheesh, 2020; Haddad et al., 2020; Karim et al., 2013; Lakhwinder and Nanda, 2018; Liu and Taylor, 2008; Luethge and Guohong Han, 2012; Scaltrito, 2016; Tamini and Sebastianelli, 2017). The industry classification of the selected companies is based on the Global Industry Classification Standard (Table 1).
Industry distribution of the sample
| Industry | No. of firms | No. of observations | % | Cumulative |
|---|---|---|---|---|
| Multi-utilities | 2 | 10 | 5.00 | 5.00 |
| Healthcare providers and services | 1 | 5 | 2.50 | 7.50 |
| Transportation infrastructure | 1 | 5 | 2.50 | 10.00 |
| Capital markets | 2 | 10 | 5.00 | 15.00 |
| Diversified financial services | 2 | 10 | 5.00 | 20.00 |
| Banks | 6 | 30 | 15.00 | 35.00 |
| Construction materials | 1 | 5 | 2.50 | 37.50 |
| Beverages | 1 | 5 | 2.50 | 40.00 |
| Machinery | 2 | 10 | 5.00 | 45.00 |
| Health-care equipment and suppliers | 1 | 5 | 2.50 | 47.50 |
| Electric utilities | 2 | 10 | 5.00 | 52.50 |
| Oil, gas and consumable fuels | 1 | 5 | 2.50 | 55.00 |
| Automobiles | 2 | 10 | 5.00 | 60.00 |
| Diversified telecommunication services | 2 | 10 | 5.00 | 65.00 |
| Gas utilities | 2 | 10 | 5.00 | 70.00 |
| Aerospace and defense | 1 | 5 | 2.50 | 72.50 |
| Textiles, apparel and luxury goods | 1 | 5 | 2.50 | 75.00 |
| IT services | 1 | 5 | 2.50 | 77.50 |
| Auto components | 1 | 5 | 2.50 | 80.00 |
| Insurance | 3 | 15 | 7.50 | 87.50 |
| Electrical equipment | 1 | 5 | 2.50 | 90.00 |
| Pharmaceuticals | 1 | 5 | 2.50 | 92.50 |
| Energy equipment and services | 2 | 10 | 5.00 | 97.50 |
| Semiconductors and semiconductor equipment | 1 | 5 | 2.50 | 100 |
| Total | 40 | 200 | 100 |
The focus was on Italian firms aiming to face a clear research gap, as the analysis of this topic is generally addressed by referring to other countries, neglecting the Italian context. This is likely to be explained by the fact that the opportunity to determine CEO remuneration considering the achievement of social and environmental results has only recently been emphasized in response to the recommendation of the Italian Corporate Governance Code in 2020. This document invites the board of directors to align a firm’s remuneration policy with the social and environmental goals, requiring that the variable component should be mainly long-term based and linked to non-financial variables. Thus, it is a relatively new practice in progress with the consequent limitations that a new phenomenon generally implies, but at the same time, it is an interesting opportunity for carrying out a specific analysis on a topic that Italian listed firms are beginning to face.
A second reason that justifies the selection of this sample refers to the corporate governance model that characterizes the Italian context: it is a typically insider model in which control is mainly carried out by governance bodies (especially by the board of directors) rather than the market. Indeed, this body plays a fundamental role in promoting convergence towards the alignment of interests that are traditionally conflicting (management, shareholder and stakeholder) by facilitating the solution of the well-known problems implied by the so-called “agency contract”.
3.2 Empirical models and variables
The hypotheses were tested using univariate statistical analysis (including correlations among the variables) and multivariate analysis using a multiple regression model.
To test H1 (H1), Model 1 was used:
Non-financial performance (ESG_Performance) of a firm i in year t is a function of the integration of environmental and social sustainability in executives’ compensation (Env_Sust_Comp and Soc_Sust_Comp), other specific control variables and the error ε. The variables are described in Table 2.
Variable definitions
| Variables | Symbols | Descriptions |
|---|---|---|
| Firm’s non-financial performance | ESG_Performance | Non-financial performance (Eikon Refinitv database) |
| Environmental sustainability in executive compensation | Env_Sust_Comp | Environmental integration of sustainability in executives’ compensation |
| Social sustainability in executive compensation | Soc_Sust_Comp | Social integration of sustainability in executives’ compensation |
| Corporate governance characteristic | CG_Characteristic | Corporate governance features affecting the firm’s sustainability orientation |
| Board independence | BoD_Ind | Percentage of independent directors on the board |
| Board gender diversity | BoD_Gend | Percentage of female directors on the board |
| Board size | BoD_Size | Natural log of the number of board members |
| CEO–chair separation | CEO–chair | Dummy variable that equals 1 when the CEO and the chair are not the same person and 0 otherwise |
| Sustainability committee | Sust_com | Dummy variable that equals 1 if there is a sustainability committee and 0 otherwise |
| Compensation committee independence | CompCom_Ind | Percentage of independent directors on the compensation committee |
| The effect of board independence on environmental sustainability | Env_Sust_Comp × BoD_Ind | Interaction between environmental sustainability and board independence |
| The effect of board independence on social sustainability | Soc_Sust_Comp × BoD_Ind | Interaction between social sustainability and board independence |
| The effect of board gender diversity on environmental sustainability | Env_Sust_Comp × BoD_Gend | Interaction between environmental sustainability and board gender diversity |
| The effect of board gender diversity on social sustainability | Soc_Sust_Comp × BoD_Gend | Interaction between social sustainability and board gender diversity |
| The effect of board size on environmental sustainability | Env_Sust_Comp × BoD_Size | Interaction between environmental sustainability and board size |
| The effect of board size on social sustainability | Soc_Sust_Comp × BoD_Size | Interaction between social sustainability and board size |
| The effect of CEO duality on environmental sustainability | Env_Sust_Comp × CEO–Chair | Interaction between environmental sustainability and CEO duality |
| The effect of CEO duality on social sustainability | Soc_Sust_Comp × CEO–Chair | Interaction between social sustainability and CEO duality |
| The effect of the sustainability committee on environmental sustainability | Env_Sust_Comp × Sust_com | Interaction between environmental sustainability and sustainability committee |
| The effect of the sustainability committee on social sustainability | Soc_Sust_Comp × Sust_com | Interaction between social sustainability and sustainability committee |
| The effect of compensation committee independence on environmental sustainability | Env_Sust_Comp × CompCom_Ind | Interaction between environmental sustainability and compensation committee independence |
| The effect of compensation committee independence on social sustainability | Soc_Sust_Comp × CompCom_Ind | Interaction between social sustainability and compensation committee independence |
| Firm size | Size | Average revenues |
| Profitability | ROA | Return on assets |
H2 (H2) was tested based on Model 2, which is formulated by adding, to Model 1, an interaction term identified by the relationship between the corporate governance characteristic and the integration of sustainability (both social and environmental) into executive remuneration. Scholars have recommended using an interaction term to evaluate how a factor can affect a specific relationship between variables (Hou et al., 2013; Javeed et al., 2021; Ricci et al., 2020). However, this study is the first to examine the impact of the corporate governance system on the relationship between sustainability in remuneration and non-financial performance:
Model 2 was developed in detail, considering each of the selected corporate governance characteristics:
The variables used in Models 1 and 2 are defined in Table 2.
3.3 Measuring non-financial performance (dependent variable)
The dependent variable – non-financial performance – is proxied by the average ESG performance of the sample firms. The choice of using ESG scores to depict non-financial performance is consistent with the main stream of literature (Bodhanwala and Bodhanwala, 2021; Chairani and Siregar, 2021; Cupertino and Vitale, 2022). The ESG data were retrieved from the Refinitiv Eikon database, which is considered one of the leading global ESG databases (Cheng et al., 2014; Faizul, 2017; Qiu et al., 2016). The ESG scores were calculated according to a percentile-based methodology and an integrated analysis of social, environmental and governance performance of firms listed on international stock exchanges, covering more than 80% of global market capitalization. The high number of firms in this database enables the calculation of more than 450 firm-level ESG indicators by reducing selection bias and ensuring consistency with the other ESG databases.
3.4 Measuring the independent variables
Independent variables can be classified as follows:
the integration of social and environmental sustainability into executive remuneration policies;
the corporate governance system’s characteristics that may improve the firm’s orientation towards sustainability and related non-financial performance: board members’ independence, the gender diversity issue, the board’s size, the CEO–chair separation, the establishment of the sustainability committee and the independence of the compensation committee members; and
the interactions between the variables of the first group and the second group to verify whether the corporate governance system actually contributes to the enhancement of non-financial performance by amplifying the positive effects of the integration of sustainability in executive remuneration.
The extent of sustainability embedded in executive remuneration was assessed using a textual analysis of remuneration reports available on the firms’ websites for the selected period (2016–2020). Listed Italian firms must publish and disclose remuneration reports on their websites according to Legislative Decree 259/2010.
A textual analysis was performed using the Linguistic Enquiry World Count software after setting a “sustainability dictionary”, including specific words identifying the sustainability issue by distinguishing between social and environmental dimensions. Textual analysis is particularly suitable for exploring firms operating in different industries, enabling an inferential analysis of their decisions (Morris, 1994). Moreover, the use of this research technique builds on previous empirical studies validating its effectiveness and validity (Camodeca and Almici, 2021; Hossnofsky and Junge, 2019; Ricci et al., 2020; Wen, 2014). Using this software, a digitalized content analysis was performed on the sample firms’ remuneration reports to examine the presence of terms related to sustainability, especially the environmental and social pillars. In particular, this analysis was based on the assumption that sentences and words “that are frequently used are cognitively central and reflect what is most in the user’s mind” (Cho and Hambrick, 2006, p. 459). This means that selected words included in the “sustainability dictionary” underline the importance given to sustainability within executive remuneration. The higher the use of these words, the higher the will to link executive remuneration to sustainability goals. Textual analysis for exploring the integration of sustainability in remuneration has been used in previous studies. Hartikainen et al. (2021) performed a qualitative analysis of 43 Finnish firms’ remuneration and sustainability reports to investigate whether executive remuneration depended on the achievement of social and environmental goals.
The bag of words used to assess the integration of sustainability issues into CEO compensation is disclosed as follows:
Environmental dimension: Deforestation; Biodiversity; Air pollution; Energy efficient; Global warming; Greenhouse effect; Net-zero; Organic; Recycle; Zero-waste; Ecosystem; Conservation; Green technology; Green design; Natural resources; Environmental protection; Climate change; GHG emissions; Environmental footprint; Green products; Decarbonization; Renewable energies; Circular economy; Energy transition; Hydrocarbon production; Reduction of plastic use; Environmental impact; Environmental responsibility; Gas leakage rate; Environmental sustainability.
Social dimensions: Corporate social responsibility; Social products; People empowerment; Community impact; Ethical behavior; Safety; Human rights; Social protection; Labour relations; Fight against corruption; Product and service stewardship; Social inclusion; Social security; Gender equality; Diversity policy; Inclusion policy; Anti-corruption; Occupational health; Social inequalities; Welfare; Sustainability; Social dialogue; Equity; Cultural diversity; Equality; Gender; Occupational disability; Social well-being; and Workplace diversity.
However, the corporate governance system characteristics were retrieved from the Eikon Refinitiv database. In particular, board member independence is measured by the percentage of independent directors, as the main stream of the literature suggests (Ludwig and Sassen, 2021; Mallin and Michelon, 2011; Pucheta-Martinez et al., 2019; Safari, 2022). The explanatory variable for gender diversity is the percentage of female directors, as suggested by the majority of scholars (Ben-Amar et al., 2017; Landry et al., 2014; Liao et al., 2015; Rao and Tilt, 2016; Safari, 2022; Willows and van der Linde, 2016). The board’s dimension is identified by the natural logarithm of the members’ number (Faizul, 2017), while CEO–chair separation is a dummy variable that equals 1 when the CEO and the chair are two different individuals and 0 otherwise (de Villers et al., 2011; Faizul, 2017; Tsang et al., 2021). Similarly, the establishment of the sustainability committee is measured using a dummy variable that equals 1 if firms have established such a body and 0 otherwise (Faizul, 2017). Finally, the compensation committee’s independence is identified by the percentage of independent directors included in this body.
3.5 Measuring the control variables
Firm size and profitability are the control variables selected for the present study, considering the main stream of literature (de Villers et al., 2011; Faizul, 2017; Jian and Lee, 2015; Luo et al., 2012). Firm size is measured by average revenues over the years 2016–2020, while firm profitability is the average return on assets ratio for the same period. Data were retrieved from the Refinitiv Eikon database.
Regarding the control variables, some scholars have found a positive relationship between firm size and environmental performance (de Villers et al., 2011; Liao et al., 2015). Other scholars have found that large firms are polluting more than small firms because of economies of scale and despite the use of advanced technologies and systems aimed at improving energy efficiency (Faizul, 2017). Regarding the profitability control variable, firms with high levels of profitability should have a greater quantity of financial resources to invest in socio-environmental initiatives (de Villers et al., 2011; Qiu et al., 2016).
4. Results and discussion
4.1 Descriptive statistics and correlations
Table 3 shows the main descriptive statistics results (mean, standard deviation, minimum and maximum) related to all the selected variables to provide a synthetic picture of the analysed data. The mean value of non-financial performance (ESG_Performance) is 57.56, although higher results are found for semiconductors and semiconductor equipment (91.87), multi-utilities (73.41) and gas utilities (70.29). The mean values of the integration of environmental sustainability (Env_Sust_Comp) and social sustainability (Soc_Sust_Comp) are 0.03 and 0.24, respectively. In particular, the non-financial performance figures range from 22.45 to 91.87, with an average value of 57.56 and a standard deviation of 15.89.
Descriptive statistics
| Variables | Mean | SD | Minimum | Maximum |
|---|---|---|---|---|
| ESG_Performance | 57.56 | 15.89 | 22.45 | 91.87 |
| Env_Sust_Comp | 0.03 | 0.010 | 0.01 | 0.06 |
| Soc_Sust_Comp | 0.24 | 0.06 | 0.14 | 0.35 |
| BoD_Ind | 59.09 | 0.17 | 22.32 | 96.00 |
| BoD_Gend | 32.88 | 0.08 | 5.30 | 44.83 |
| BoD_Size | 2.49 | 0.25 | 2.00 | 3.06 |
| CEO–Chair | 0.71 | 0.42 | 0.00 | 1.00 |
| Sust_com | 0.82 | 0.31 | 0.00 | 1.00 |
| CompCom_Ind | 75.53 | 0.27 | 0.00 | 100.00 |
| Env_Sust_Comp × BoD_Ind | 0.01 | 0.02 | 0.01 | 0.11 |
| Soc_Sust_Comp × BoD_Ind | 0.12 | 0.07 | 0.01 | 0.30 |
| Env_Sust_Comp × BoD_Gend | 0.01 | 0.01 | 0.01 | 0.05 |
| Soc_Sust_Comp × BoD_Gend | 0.19 | 0.07 | 0.02 | 0.36 |
| Env_Sust_Comp × BoD_Size | 0.05 | 0.05 | 0.03 | 0.32 |
| Soc_Sust_Comp × BoD_Size | 0.49 | 0.20 | 0.07 | 0.97 |
| Env_Sust_Comp × CEO–Chair | 0.02 | 0.02 | 0.00 | 0.14 |
| Soc_Sust_Comp × CEO–Chair | 0.14 | 0.11 | 0.00 | 0.34 |
| Env_Sust_Comp × Sust_com | 0.02 | 0.02 | 0.00 | 0.14 |
| Soc_Sust_Comp × Sust_com | 0.52 | 0.26 | 0.00 | 1.00 |
| Env_Sust_Comp × CompCom_Ind | 0.02 | 0.02 | 0.00 | 0.14 |
| Soc_Sust_Comp × CompCom_Ind | 0.15 | 0.09 | 0.00 | 0.32 |
| Size | 16.84 | 30.85 | 268.00 | 136.97 |
| ROA | 5.72 | 0.06 | −3.9 | 23.30 |
The environmental dimension’s figures range from 0.01 to 0.06, with a mean of 0.03 and a standard deviation of 0.01, while the social dimension is characterized by a mean of 0.24 and a standard deviation of 0.06, underlying how these variables seem to be more clustered around the average.
Table 3 shows that boards of directors usually consist of 12 members (2.49 as the natural logarithm), of whom 59.09% are independent and 32.88% are female, while the independence of the compensation committee members is higher, reaching 75.53%. Moreover, most of the sample firms separate the CEO role from the chair role, as the mean value is 0.71 (against the maximum, which equals 1). Similar data refer to the establishment of a sustainability committee whose mean value is 0.82 (against the maximum value, which equals 1). The results in Table 3 – which are similar to the evidence of Faizul (2017) – reveal small standard deviations, indicating that the data points are close to the mean (Field, 2009).
Table 4 shows pair-wise Pearson correlations for the dependent, independent and control variables. The correlation between the dependent variable ESG_Peformance and the independent variables is positive and statistically significant, except for gender board diversity and firm size. The data suggest that the integration of sustainability in remuneration can enhance firms’ non-financial performance by promoting alignment between stakeholders’ and management’s interests. In terms of independent variables, the correlation coefficients suggest that multicollinearity is unlikely, as they assume values far from either 1 or −1, except for some results related to the interaction terms.
Pearson correlation matrix
| Variables | 1 | 2 | 3 | 4 | 5 | 6 | 7 | 8 | 9 | 10 | 11 | 12 | 13 | 14 | 15 | 16 | 17 | 18 | 19 | 20 | 21 | 22 | 23 | |
|---|---|---|---|---|---|---|---|---|---|---|---|---|---|---|---|---|---|---|---|---|---|---|---|---|
| 1 | ESG_Performance | 1.00 | ||||||||||||||||||||||
| 2 | Environmental sustainability in executive compensation | 0.01 | 1.00 | |||||||||||||||||||||
| 3 | Social sustainability in executive compensation | 0.33 | 0.11 | 1.00 | ||||||||||||||||||||
| 4 | Board independence | 0.54 | 0.12 | 0.35 | 1.00 | |||||||||||||||||||
| 5 | Board gender diversity | −0.02 | −0.06 | −0.03 | 0.04 | 1.00 | ||||||||||||||||||
| 6 | Board size | 0.05 | −0.28 | 0.09 | −0.02 | 0.00 | 1.00 | |||||||||||||||||
| 7 | CEO–Chair separation | 0.22 | 0.05 | 0.04 | 0.07 | 0.06 | 0.10 | 1.00 | ||||||||||||||||
| 8 | Sustainability committee | 0.44 | 0.08 | 0.18 | 0.22 | 0.29 | 0.10 | 0.38 | 1.00 | |||||||||||||||
| 9 | Compensation committee independence | 0.30 | 0.04 | 0.18 | 0.39 | 0.35 | 0.01 | 0.31 | 0.34 | 1.00 | ||||||||||||||
| 10 | Effect of board independence on environmental sustainability | 0.08 | 0.97 | 0.15 | 0.31 | 0.00 | −0.24 | 0.09 | 0.14 | 0.15 | 1.00 | |||||||||||||
| 11 | Effect of board independence on social sustainability | 0.50 | 0.12 | 0.85 | 0.75 | 0.05 | 0.04 | 0.12 | 0.28 | 0.25 | 0.25 | 1.00 | ||||||||||||
| 12 | Effect of board gender diversity on environmental sustainability | 0.02 | 0.94 | 0.09 | 0.16 | 0.24 | −0.26 | 0.10 | 0.22 | 0.19 | 0.95 | 0.14 | 1.00 | |||||||||||
| 13 | Effect of board gender diversity on social sustainability | 0.45 | 0.08 | 0.30 | 0.79 | 0.61 | −0.04 | 0.07 | 0.31 | 0.48 | 0.25 | 0.64 | 0.27 | 1.00 | ||||||||||
| 14 | Effect of board size on environmental sustainability | 0.02 | 0.99 | 0.11 | 0.12 | −0.06 | −0.19 | 0.06 | 0.09 | 0.03 | 0.97 | 0.12 | 0.94 | 0.08 | 1.00 | |||||||||
| 15 | Effect of board size on social sustainability | 0.31 | 0.02 | 0.96 | 0.33 | −0.02 | 0.33 | 0.05 | 0.19 | 0.20 | 0.07 | 0.82 | 0.01 | 0.27 | 0.05 | 1.00 | ||||||||
| 16 | Effect of CEO duality on environmental sustainability | 0.02 | 0.88 | 0.04 | 0.17 | 0.06 | −0.18 | 0.44 | 0.23 | 0.22 | 0.90 | 0.13 | 0.89 | 0.17 | 0.88 | −0.02 | 1.00 | |||||||
| 17 | Effect of CEO duality on social sustainability | 0.35 | 0.88 | 0.54 | 0.32 | 0.10 | 0.08 | 0.81 | 0.41 | 0.40 | 0.14 | 0.58 | 0.11 | 0.32 | 0.06 | 0.52 | 0.36 | 1.00 | ||||||
| 18 | Effect of sustainability committee on environmental sustainability | 0.11 | 0.94 | 0.11 | 0.20 | 0.13 | −0.23 | 0.17 | 0.38 | 0.21 | 0.95 | 0.18 | 0.97 | 0.23 | 0.93 | 0.04 | 0.91 | 0.18 | 1.00 | |||||
| 19 | Effect of sustainability committee on social sustainability | 0.55 | 0.15 | 0.31 | 0.64 | 0.24 | 0.04 | 0.37 | 0.82 | 0.35 | 0.28 | 0.61 | 0.26 | 0.63 | 0.16 | 0.29 | 0.29 | 0.50 | 0.38 | 1.00 | ||||
| 20 | Effect of compensation committee independence on environmental sustainability | 0.04 | 0.94 | 0.10 | 0.23 | 0.12 | −0.23 | 0.16 | 0.22 | 0.33 | 0.96 | 0.19 | 0.96 | 0.25 | 0.93 | 0.03 | 0.93 | 0.18 | 0.96 | 0.27 | 1.00 | |||
| 21 | Effect of compensation committee independence on social sustainability | 0.41 | 0.06 | 0.81 | 0.49 | 0.21 | 0.11 | 0.26 | 0.37 | 0.68 | 0.17 | 0.83 | 0.16 | 0.52 | 0.07 | 0.8 | 0.17 | 0.66 | 0.20 | 0.47 | 0.25 | 1.00 | ||
| 22 | Firm size | −0.09 | 0.20 | −0.05 | 0.16 | −0.04 | −0.08 | −0.11 | −0.27 | 0.08 | 0.24 | 0.00 | 0.19 | 0.09 | 0.20 | −0.06 | 0.20 | −0.11 | 0.15 | −0.16 | 0.22 | −0.01 | 1.00 | |
| 23 | Profitability | 0.03 | 0.05 | 0.03 | −0.10 | 0.04 | −0.01 | −0.56 | 0.12 | −0.04 | −0.07 | −0.05 | −0.04 | −0.06 | −0.05 | 0.04 | −0.24 | −0.41 | 0.00 | −0.08 | −0.04 | 0.01 | −0.01 | 1.00 |
4.2 Normality tests of the dependent variables
The Kolmogorov–Smirnov and Shapiro–Wilk tests were carried out to test the normality of ESG_Performance (Shapiro and Wilk, 1968; Shapiro and Varian, 1999). The results of both tests are not statistically significant (p = 0.200; and p = 0.254). Thus, the null hypothesis was accepted, demonstrating that the analysed data were normally distributed (Table 5).
4.3 Regression results and discussion
The results shown in Table 6 support H1 (H1) that integrating sustainability into executive compensation positively affects firms’ non-financial performance, facilitating the convergence between management’s and stakeholders’ interests and the solution of agency relationship problems. In fact, the achievement of satisfying results in the social and environmental context, in addition to the economic context, on the one hand, enables a CEO to get greater remuneration and, on the other hand, promotes sustainability orientation, identified as a perspective safeguarding all stakeholders’ interests. Sustainability integration in CEO remuneration is verified through content analysis based on the presence and frequency of specific terms referring to social and environmental dimensions.
The overall R2 is 0.77, meaning that this model explains nearly 77% of the variation in non-financial performance.
All of Model 1’s coefficients (β) are positive, meaning that attention to the social and environmental dimensions, integrated into CEO remuneration, positively affects non-financial performance, assuming significant values: β = 266.39 and p = 2.64 in terms of environmental issues and β = 90.65 and p = 0.0006 in terms of social issues. With regard to the β coefficients, the characteristic that most affects non-financial performance is environmental. All other variables being equal, as the result of the unitary increase of environmental sustainability in the executive compensation variable, firms’ non-financial performance increased by 266.39.
In terms of the control variables, the results in Table 6 show that only profitability is significant (β = 31.16 and p = 0.04).
The positive effect of sustainability in CEO remuneration on non-financial performance is consistent with the results of previous studies (Berrone and Gomez-Mejia, 2009; Deckop et al., 2006; Groen et al., 2012; Haque and Ntim, 2020; Hong et al., 2016; Lacy and Hayward, 2013; Lacy et al., 2010; Mahoney and Thorn, 2006; Okafor and Ujah, 2020) and the theoretical predictions of stakeholder–agency theory underline how sustainability can lead to a general alignment of involved interests. Indeed, CEO compensation can play a significant role in improving social and environmental performance by satisfying both management’s and stakeholders’ expectations. In this regard, some scholars have clearly demonstrated that incentive pay policies can lead managers to focus on sustainable practices, especially environmental practices (Cordeiro and Sarkis, 2008; Haque and Ntim, 2020). By contrast, these findings do not confirm the results demonstrating that remuneration does not improve non-financial performance, demonstrating that the agency relationship is not affected by these variables (Cai et al., 2011; Coombs and Gilley, 2005; McGuire, 2003; Russo and Harrison, 2005; Stanwick and Stanwick, 1998). The results related to H1 are not consistent with studies demonstrating either a lack of a relationship or a negative relationship between the integration of sustainability in remuneration and non-financial performance.
Tables 7 and 8 show the results related to H1 by distinguishing between the non-financial and financial sectors; this distinction allows observation of an interesting aspect.
Regression results for H1 – non-financial industry
| Variables | Coefficient | Standardized coefficient | t-statistics |
|---|---|---|---|
| 1. Env_Sust_Comp | 255.21 | ** | 3.49 |
| 2. Soc_Sust_Comp | 80.35 | ** | 4.86 |
| 3. Size | 4.03 | 0.12 | |
| 4. Profitability | 27.58 | * | 2.22 |
| R2 overall | 0.73 | ||
| Number of firms | 29 |
Notes:
* and ** indicate statistical significance at p < 0.05 and p < 0.01
Regression results for H1 – financial industry
| Variables | Coefficient | Standardized coefficient | t-statistics |
|---|---|---|---|
| 1. Env_Sust_Comp | −33.25 | ** | −1.25 |
| 2. Soc_Sust_Comp | 70.65 | ** | 2.3 |
| 3. Size | 2.5 | 0.02 | |
| 4. Profitability | 22.34 | * | 1.29 |
| R2 overall | 0.71 | ||
| Number of firms | 11 |
Notes:
* and ** indicate statistical significance at p < 0.05 and p < 0.01
With reference to the non-financial sector, the findings confirm what has been observed with regard to the entire sample: coefficients (β) are positive and significant, both in terms of social and environmental dimensions.
Conversely, with reference to the financial sector (insurance, market capital and banks), including 11 firms of 40, Table 8 shows that the relationship between environmental dimension and non-financial performance is negative, contrary to the results referring to the overall sample. These findings are aligned with previous studies on the banking sector; in this regard, these studies demonstrated that, on the one hand, banks generally pay little attention to sustainability issues (Al-Haija, 2021; Khan et al., 2011) and, on the other hand, CEO remuneration negatively affects environmental performance (Adu et al., 2022a, 2022b).
In particular, the findings referring to the financial sector are misaligned with those related to the entire sample, characterized by a clear relevance of the environmental dimension in terms of affecting non-financial performance. Indeed, the environmental pillar chiefly affects non-financial performance, as shown in previous studies and surveys (Altis, 2021; Berrone and Gomez-Mejia, 2009; Cordeiro and Sarkis, 2008; Italian National Commission for the Listed Companies and Stock Exchange, 2020; Merriman and Sen, 2011). Thus, this study underlines the concept of sustainability, which is chiefly based in the sample firms’ compensation policies on the environmental dimension, while the social dimension is emphasized in short-term compensation components. The emphasis on the environmental dimension can be explained by considering the wide prominence of energy transition and climate risk issues, with a consequent push to pursue goals and achieve results in this domain. Thus, this study shows a moderate impact of social goals compared to environmental goals. The results demonstrate the need to emphasize social goals in long-term remuneration to properly implement sustainability principles, which traditionally entail three main dimensions: economic, environmental and social.
In general, the findings highlight how a sustainability orientation in CEO remuneration may contribute to improving firms’ performance, especially environmental performance, by facilitating the convergence of different interests (economic and non-economic) and overcoming the traditional agency dichotomy. In fact, the interconnection between social, environmental and economic issues, referring to CEO remuneration, enables the enhancement of performance (economic and non-economic) by orienting firms towards sustainability, which becomes a condition for shared advantage both for management and all stakeholders. In this regard, the theoretical framework enables the identification of sustainability in remuneration as a potential tool for promoting convergence between management and stakeholders according to global responsibility principles and value creation over the long term.
H2 (H2) was partially confirmed; in particular, the analysis showed how only specific corporate governance characteristics support – even for specific dimensions – the relationship between sustainability goals and non-financial performance by reducing agency costs, mainly in terms of monitoring management activities.
To verify this hypothesis, specific sub-hypotheses were tested, and the results are shown in Table 9.
Regression results for H2a, H2b, H2c, H2d, H2e and H2f
| Variables | H2a | H2b | H2c | H2d | H2e | H2f |
|---|---|---|---|---|---|---|
| 1. Env_Sust_Comp | 15.72 | −38.37 | −135.27 | −136.71** | 153.44** | 151.42 |
| 2. Soc_Sust_Comp | 60.012** | 97.09* | 153.50** | 3,793.65** | 35.62** | 55.73 |
| 3. Env_Sust_Comp*CGC1 | 274.53* | 372.29* | 1,207.86 | −670.71** | 69.07* | 21.93 |
| 4. Soc_Sust_Comp*CGC1 | 73.73 | −56.89 | −257.04* | 1,156.08** | 27.79* | 9.27 |
| 5. Size | 0.00 | 4.55 | 0.00 | 0.00 | 0.00 | 4.41 |
| 6. Profitability | 40.68** | 32.99* | 40.41* | 39.12* | 97.57** | 20.19 |
| R2 overall | 0.98 | 0.81 | 0.89 | 0.80 | 0.99 | 0.46 |
| Number of firms | 40 | 40 | 40 | 40 | 40 | 40 |
Notes:
1Corporate governance’s characteristic (H2a: board of directors’ independence; H2b: compensation committee’s independence; H2c: gender diversity; H2d: board size; H2e: CEO–chair separation; and H2f: sustainability committee).
* and ** indicate statistical significance at p < 0.05 and p < 0.01
Regarding board members’ independence (H2a), R2 increases to 0.9775; the variable’s impact on the environmental dimension (i.e. the interaction term Env_Sust_Comp*BoD_Ind) remains positive and statistically significant (β = 274.526819 and p = 0.048315319), revealing that more independence of board members can enhance the relationship between sustainability-based remuneration and non-financial performance. Conversely, this variable does not affect the social dimension, while the interaction term eliminates the significance of the Env_Sust_Comp standalone variable.
Similarly, the H2b hypothesis was confirmed only in terms of the environmental dimension, as the interaction variable is significant and has a positive β coefficient (β = 372.294805 and p = 0.041311662).
Regarding the standalone variables, only the social dimension is significant (β = 97.0913722 and p = 0.003743702), while the control variable profitability remains significant.
The independence of the board and compensation committee members contributes to improving the impact on non-financial performance, although only for environmental goals. Independent members are required to enhance the board’s discussion to orient the firm’s activity towards sustainability conditions, avoiding conflicts of interest, opportunistic behaviours and decisions focused on a short-term perspective. Many scholars have argued that board members’ independence can promote behaviours according to sustainability principles (Coffey and Wang, 1998; Faizul, 2017; Liao et al., 2015). In this regard, independence is a condition for strengthening the effects on the firm’s performance of the sustainability orientation in CEO remuneration, ensuring that the management does not pursue personalistic goals but rather stakeholder interests, confirming the previous studies’ evidence (Ben-Amar et al., 2017; Coffey and Wang, 1998; Glass et al., 2015; Huse and Solberg, 2006; Landry et al., 2014; Liao et al., 2015; Nielsen and Huse, 2010; Rao and Tilt, 2016; Willows and van der Linde, 2016). Thus, this study’s findings are aligned with part of the literature on this topic, even if the results emphasize the environmental dimension, which becomes particularly relevant, presumably because of the increasing attention paid to climate risks and energy transition issues. In particular, the emphasis on the environmental dimension confirms what has been observed in other studies (Aslam et al., 2021; Campbell et al., 2007; Haque and Ntim, 2020; Okafor and Ujah, 2020; Stanwick and Stanwick, 2001). Campbell et al. (2007) demonstrate that CEO compensation can be designed to encourage managers to reduce greenhouse gas emissions.
With reference to the selected hypotheses, Models 2a and 2b demonstrate that the independence of directors is an important component, ensuring that management activity is driven towards the achievement of common interest goals. These findings are consistent with stakeholder–agency theory, which is based on the assumption that the board of directors plays a fundamental role in avoiding management opportunistic behaviours; in this context, members’ independence ensures the effectiveness of the board’s activity.
The H2c hypothesis was not supported by the results, revealing that gender diversity is not significant in explaining a firm’s non-financial performance and the potential convergence of different interests. This result is not aligned with the literature, which underlines a positive relationship between gender diversity on the board of directors and the establishment of a sustainability orientation supporting a general convergence of interests (Ben-Amar et al., 2017; Coffey and Wang, 1998; Glass et al., 2015; Huse and Solberg, 2006; Landry et al., 2014; Liao et al., 2015; Nielsen and Huse, 2010; Rao and Tilt, 2016; Willows and van der Linde, 2016). In this regard, this result is particularly innovative, as it demonstrates that – in specific circumstances – gender diversity does not create the expected benefits, as observed in previous studies. In fact, despite the literature underlining how the female gender is generally more committed to social and environmental issues, this study aims to address the so-called agency relationship between management and stakeholders through an analysis of the contribution that sustainability-based remuneration can offer to the achievement of social and environmental results. In this context, gender diversity does not play a strong enough role to orient CEO activity compared to other corporate governance characteristics, which are more effective in affecting managers’ behaviours.
The H2d hypothesis was supported only in terms of the social sustainability dimension, as the interaction term Soc_Sust_Comp × BoD_Size shows a positive β coefficient, and it is significant (β = 1,156.078392 and p = 0.000102263) (Table 8). For the standalone variable Soc_Sust_Comp, its β coefficient increases from 90.646909 (Model 1) to 2,793.650266 (Model 2d) by enhancing its impact on non-financial performance. The profitability control variable remains significant.
The H2d hypothesis was only partially supported with reference to the social dimension; the lack of impact on the environmental dimension is not aligned with scholars who have addressed this issue (Booth and Deli, 1996; de Villers et al., 2011). Indeed, previous studies have demonstrated that large boards are generally an opportunity in terms of skills and experience required to cope with the emerging challenges (i.e. the energy transition), which firms undergo because of modern economies (Booth and Deli, 1996; de Villers et al., 2011) and of more effective control of firms’ activities (Endrikat et al., 2020; Fama and Jensen, 1983; Lau et al., 2016; Mudiyanselag, 2018). However, the results underline how the numerousness of directors can strengthen – even if in terms of the social dimension – the positive relationship between remuneration and non-financial performance by contributing to overcoming the dichotomy between management’s and stakeholders’ perspectives. The partial impact (that is limited to the social dimension) of this variable can be explained considering that what chiefly matters are the specific directors’ characteristics, rather than their number.
The H2e hypothesis was confirmed in terms of social and environmental aspects; the related interaction terms show the following results: β = 27.7893015, p = 0,001627661, β = 69.07414374 and p = 0.025556808. In addition, the standalone variables Env_Sust_Comp and Soc_Sust_Comp are still significant, with positive β coefficients: β = 153.4400888, p = 0.002341357, β = 35.62286676 and p = 0.002371372. The variable CEO–chair separation increases R2 to 0.999325615, while the control variable profitability remains significant.
The results for the CEO–chair separation variable (whose mean value is 0.71 compared to the maximum score of 1.00) confirm H2e, demonstrating that this characteristic contributes to enhancing the relationship between social and environmental remuneration goals and non-financial performance. This evidence is consistent with the literature, which depicts this variable as an enabling condition for a greater sustainability orientation (Boyd, 1994; de Villers et al., 2011; Finkelstein and D’Aveni, 2017; Kelton and Yang, 2008). In particular, this corporate governance’s characteristic is the more relevant variable for strengthening the relationship between the selected variables, as it enhances both the social and the environmental dimensions. Indeed, the separation of the chair and CEO ensures more effective control over management activity and its orientation towards stakeholders according to mutual interest principles. In this regard, the presumed conflict theorized by the stakeholder–agency theory can be partially overcome through specific governance decisions; in this context, the separation between chair and CEO plays a fundamental role. This result is consistent with stakeholder–agency theory, as it states that the achievement of opportunistic behaviour can be discouraged by the identification of separate roles between the management body and that in charge of monitoring the performed activity.
The H2f hypothesis was not supported, as the related findings are not significant. However, this result is particularly interesting, as it is not consistent with the previous literature; indeed, the majority of studies have found a positive relationship between this variable and sustainability practices (Daddi et al., 2019; Endrikat et al., 2020; Hussain et al., 2018; Gennari, 2019; Orazalin, 2020; Salvioni and Gennari, 2019). It is likely that this committee has less possibility – compared to the board of directors – to monitor management activity, weakly affecting the relationship investigated by Model 2f.
Finally, with reference to the control variables, profitability affects the relationship between a CEO’s remuneration and a firm’s non-financial performance the most. In fact, to invest in sustainability, additional resources are required; firms with high profitability should attain the resources needed to finance social and environmental initiatives (de Villers et al., 2011; Qiu et al., 2016). In addition, a high level of profitability should enable linking a part of executive remuneration to the achievement of non-economic goals.
In general, considering that H1 is supported, this study underlines how only some corporate governance characteristics strengthen the relationship investigated in Model 1. In fact, some corporate governance aspects are weak to ensure an integrated sustainability orientation, which is based on the concurrent enhancement of all relevant dimensions (economic, social and environmental).
In this regard, this research demonstrates that sometimes a corporate governance system enhances the social dimension, while in other cases, it enhances the environmental dimension or none of them. In particular, the most affecting characteristics are the directors’ independence and their numerousness but chiefly the separation between chairman and CEO roles. Indeed, these are the corporate governance features that mostly affect management’s sustainability orientation, promoting the alignment of the involved interests and reducing the conflicts theorized by the stakeholder–agency framework.
This study’s results underline how the integration of sustainability issues into CEO remuneration can actually improve non-financial performance, and this process can be strengthened by specific corporate governance characteristics, with clear consequences in terms of the convergence of involved interests. In this context, sustainability is a mutual-interest view, enabling one to overcome the traditional dichotomy between management and stakeholders and economic and non-economic interests, as traditionally theorized by the stakeholder–agency framework.
Firms with high profitability should attain the resources needed to finance social and environmental initiatives (de Villers et al., 2011; Qiu et al., 2016). In addition, a high level of profitability should enable linking a part of executive remuneration to the achievement of non-economic goals.
4.4 Endogeneity check
To verify the robustness of the findings, a two-stage least squares approach was performed to deal with potential endogeneity problems and detect any self-selection bias (Nguyen et al., 2021a, 2021b). As this research focuses on sustainability-based remuneration and non-financial performance, this study aims to identify some effective exogenous instrumental variables for this variable that are correlated with the expected endogenous variable but uncorrelated with the error term of the dependent variable (Cho and Kim, 2003). According to previous studies, a two-stage least squares approach was performed, assuming “environmental sustainability” (Env_Sust_Comp) as an endogenous variable affected by the control variables.
The related findings shown in Tables 10 and 11 are similar to those included in Tables 6 and 9. For example, the social and environmental dimensions referring to CEO remuneration have a positive and significant impact on non-financial performance, confirming H1; similarly, the results included in Table 11, related to H2, confirm, in general, the evidence shown in Table 9. This suggests that the results are robust in terms of endogeneity problems and self-selection bias.
Endogeneity check for H1 using two-stage least squares
| Variables | Coefficient | Statistical significance | t-statistics |
|---|---|---|---|
| 1. Env_Sust_Comp | 269.33 | ** | 5.22 |
| 2. Soc_Sust_Comp | 93.65 | ** | 6.34 |
| 3. Size | 3.89 | 0.22 | |
| 4. Profitability | 32.33 | * | 2.66 |
| R2 overall | 0.86 | ||
| Number of firms | 40 |
Note:
* and ** indicate statistical significance at p < 0.05 and p < 0.01
Endogeneity check for H2a, H2b, H2c, H2d, H2e and H2f using two-stage least squares
| Variables | H2a | H2b | H2c | H2d | H2e | H2f |
|---|---|---|---|---|---|---|
| 1. Env_Sust_Comp | 17.21 | −36.22 | −132.22 | −134.89** | 151.42** | 155.78 |
| 2. Soc_Sust_Comp | 58.03** | 98.01* | 148.5** | 3,650.23** | 33.23** | 53.22 |
| 3. Env_Sust_Comp*CGC1 | 268.9* | 370.11* | 1,209.00 | −702.22** | 68.02* | 22.34 |
| 4. Soc_Sust_Comp*CGC1 | 70.11 | −55.22 | −248.55* | 1,148.01** | 31.03* | 10.21 |
| 5. Size | 0.02 | 4.01 | 0.00 | 0.06 | 0.07 | 4.33 |
| 6. Profitability | 50.01** | 33.44* | 43.41* | 38.11* | 99.03** | 21.12 |
| R2 overall | 0.88 | 0.86 | 0.79 | 0.75 | 0.11 | 0.88 |
| Number of firms | 40 | 40 | 40 | 40 | 40 | 40 |
Notes:
1Corporate governance’s characteristic (H2a: board of directors’ independence; H2b: compensation committee’s independence; H2c: gender diversity; H2d: board size; H2e: CEO-chair separation; and H2f: sustainability committee).
* and ** indicate statistical significance at p < 0.05 and p < 0.01
5. Concluding remarks
This study addresses the analysis of the relationship between sustainability in executive remuneration and non-financial performance by exploring the role played by corporate governance’s characteristics in strengthening this relationship.
In this regard, the analysis contributes to the extant literature in different ways. First, this research demonstrates how the integration of sustainability into remuneration policies in the Italian context can improve socio-environmental performance, although some scholars have found controversial evidence (Cai et al., 2011; Coombs and Gilley, 2005; McGuire, 2003; Stanwick and Stanwick, 1998).
Second, the analysis has been carried out using a theoretical framework – stakeholder–agency theory – infrequently used for investigating this topic, which is generally addressed using other frameworks, such as agency theory and institutional theory. This theoretical perspective enables the authors to address the topic according to a different view to contribute to the debate about the convergence between management’s and stakeholder’s interests by investigating the role played by CEO remuneration and the corporate governance system. In this way, an additional cause of reflection is provided compared to the current literature framework, which is characterized by controversial results. In addition, the link between corporate governance features and CEO remuneration is a novel aspect, especially whether it refers to the Italian context. In this study, corporate governance characteristics are treated – converse to other studies (Adu et al., 2022a) – as independent variables and not as simple control variables. In particular, this study shows how specific corporate governance characteristics can positively affect the relationship between sustainability goals and non-financial performance by contributing to the extant literature on corporate governance and sustainability orientation, as well as agency theory (Coffey and Wang, 1998; de Villers et al., 2011; Faizul, 2017; Liao et al., 2015).
Third, this study shows how the environmental dimension mostly affects non-financial performance. In this regard, enhancing attention to the social dimension is recommended to facilitate a more effective improvement of firm performance according to the wide integration of all sustainability dimensions. At the same time, the greater attention paid to the environmental dimension is chiefly referred to as the increasing relevance of environmental issues, such as the mitigation of climate risks and energy transitions.
Fourth, this research focuses on Italian firms that are usually less frequently investigated regarding this topic, as the attention is generally concentrated either on other countries’ firms or those operating in specific sectors. The decision to focus on Italian firms is partially because of the recent recommendation of Italian Corporate Governance to determine some CEO remuneration components considering the achievement of social and environmental results by underlying the opportunity to investigate the firms’ behaviour in response to this recent recommendation. Finally, the choice to consider Italian firms allows for the investigation of the impacts that an insider corporate governance system – such as the Italian one – can have on non-financial performance.
5.1 Practical implications
The findings of this research demonstrate how sustainability can be a paradigm facilitating the convergence of different interests (economic and non-economic) referred to as different players (the management and stakeholder). In this context, a high level of pervasiveness of sustainability issues in CEO remuneration can orient management behaviour towards the improvement of social and environmental performance; in this regard, specific corporate governance characteristics can be supportive. Considering what is observed above, it is possible to underline some interesting implications.
In the past decade, a high emphasis was placed on the sustainability issue by international bodies, standard setters, policymakers and regulators, with the aim of facilitating the increasing mitigation of firms’ impacts on the ecosystem and community. In this context, executives’ remuneration has been studied to test its effectiveness in improving social and environmental performance to overcome the traditional conflicts theorized by the stakeholder–agency framework.
This research provides useful insights into the potential tools that can be used to enhance non-financial performance to benefit all relevant stakeholders by reducing agency costs and promoting the alignment of interests. In particular, the research results demonstrate that non-financial performance can be positively affected by integrating sustainability issues into executives’ compensation. This relationship can be further enhanced by specific corporate governance characteristics, such as independence and the separation between chair and CEO. In this regard, the findings could be of interest to regulators, institutional investors and financial analysts.
This research provides regulators with useful insights for considering the opportunity to mandate firms, especially listed ones, and to base at least part of executive remuneration on the achievement of non-financial goals. This implication is based both on this research’s results and previous studies; in particular, the integration of sustainability in remuneration policies can facilitate the creation of value in the medium–long run, which can be shared by all stakeholders according to conditions of close integration between economic, social and environmental dimensions.
In addition, this study suggests that the implementation of corporate governance systems according to the recommendations and laws of self-regulation codes can orient executives’ activities towards the achievement of shared goals by discouraging opportunistic behaviours. Increased regulation of specific aspects (i.e. the strengthening of independence as well as the CEO and chairman separation) should facilitate an increased orientation towards sustainability and an improvement in related performance. In this regard, corporate governance characteristics identify a fundamental condition for improving sustainability and reducing the potential distance between management and stakeholders, as traditionally stated within the stakeholder–agency framework. Thus, there is a call for firms to implement good corporate governance systems, as they can improve sustainability orientation and create value that can be shared by both management and stakeholders.
At the same time, this research can orient investors and financial analysts towards a greater awareness of the role played by executive remuneration policies in creating value in the long run; indeed, this issue may play a relevant role in selecting sustainable firms to invest in.
Finally, it is important to emphasize that the integration of sustainability in executives’ compensation should be connected to a broader renewal of corporate culture by shifting from an economic-based perspective towards an integrated perspective based on the interconnection of all relevant performance (economic, social and environmental). Thus, regulators should improve governance bodies’ and investors’ awareness of the benefits derived from carrying out economic activities without harming ecosystems and the community.
5.2 Main limitations and emerging issues
One of the limitations of this study is the sample, which could be widened by including, for example, all Italian Milan Stock Exchange-listed companies. Moreover, a study of the integration of sustainability into executive remuneration could be performed by analysing specific sustainability-linked incentives disclosed in the sample firms’ remuneration reports, rather than using a textual analysis aimed at appraising the general level of sustainability’s pervasiveness. For future research, this analysis could be considered as a starting point for either an international comparison of firms located in countries characterized by insider and outsider corporate governance systems or an analysis of the potential impacts of non-financial regulation (i.e. the Italian Legislative Decree 254/2016).

