

This study addresses the nexus of two critical challenges for today’s mathematics teacher. On the one hand, teaching for understanding for all students is the goal of most mathematics teachers. However, many teachers also must acknowledge and address the requirement that students do well on high stakes tests. This study analyzed data on 6th grade students’ performance and achievement after a year-long implementation of Connected Mathematics (CMP). Texas Assessment of Academic Skills (TAAS) data were analyzed, comparing students’ achievement from 5th to 6th grade. The variables of at-risk, socio-economic status, and ethnicity were analyzed to determine the nature and practical importance of adopting CMP. The results indicated that the overall gain from using CMP materials over the previous year’s mathematics achievement was four points (p < .01). The at-risk students demonstrated a mean 10-point gain (p < .01) while the non at-risk students demonstrated a mean 2-point gain.
Introduction
Teaching and learning mathematics with understanding involves some fundamental forms of mental activity: constructing relationships, extending and applying knowledge, reflecting about experiences, articulating what one knows, and making knowledge one’s own (Carpenter & Lehrer, 1999). Furthermore, the specific classroom activities and teaching strategies that support these mental activities include appropriate tasks, representational tools, and normative practices that engage students in structuring and applying their knowledge. In addition, reflection and encouragement of articulation about tasks and about student mental activities are supported. Classrooms that promote learning mathematics with understanding for all students involve a necessarily complex set of interactions and engagement of teacher and students with richly-situated mathematical content (McClain & Cobb, 2001). Because this engagement is so essential, fairness and equity are important issues in making learning and understanding available for all students. There may be differential effects of this type of instruction for some students (Secada & Berman, 1999).
There are specific instructional and learning factors that produce cognitive change and understanding of mathematics concepts and procedures in middle grades students. In particular, these factors are manifested in activities that (1) build on students’ prior ideas about mathematics and (2) promote student thinking and reasoning about mathematics concepts (Kulm, Capraro, Capraro, Burghardt, & Ford, 2001). Research on these factors has provided evidence of their importance in mathematics teaching and learning that is designed to lead to conceptual change. The goal of this study is to understand how the use of standards based curriculum, Connected Mathematics Project, impacts student mathematics achievement as measured by standardized tests across gender, socio-economic status, and ethnicity.
Aligning Curriculum Materials and Instruction
Textbooks are important tools for mathematics teachers; it makes sense to select textbooks that incorporate the results of research on mathematics learning. The variables ‘building on student ideas’ and ‘promoting student thinking’ have been identified as distinctive characteristics of the Connected Mathematics (Lappan, Fey, Fitzgerald, Friel, & Phillips, 1998) textbooks (American Association for the Advancement of Science [AAAS], 2000). Research is beginning to emerge on the teaching and learning of middle grades with the Connected Mathematics (CMP) materials. CMP is a standards-based reform mathematics program for middle school grades. Students engage real-life problems with each lesson using calculators and a variety of materials to discover strategy to solve the problems. The program was developed through funding from the National Science Foundation. The curriculum is spiral meaning the mathematical ideas are revisited from unit to unit and grade to grade in increasingly more sophisticated ways rather than recursively (Lappan et al., 1996). Students who had three years in the CMP curriculum demonstrated deep understanding of a significant piece of algebra (Krebs, 1999). In addition to developing conceptual understanding, Kersaint (1998) reported that using CMP algebra units led to alternate methods for solving algebra problems.
There have been mixed results when inexperienced teachers use CMP. For example, two of four preservice teachers using the materials developed new understandings of ratio and standards-based reform, while the other two preservice teachers reverted to traditional methods for solving ratio and proportion problems when challenged with a new experience (Hutchinson, 1996). These results may in part be due to the fact that no training is required before implementing the materials. Similar difficulties may occur with experienced teachers who try to make major changes in their teaching that CMP requires. Further research is needed on this issue, including the professional development and other support needed for effective implementation.
Building on Student Ideas about Mathematics
This research builds on the established work of Saxe, Gearhardt, and Seltzer (1999) who in part investigated the impact on student achievement of building on student ideas. The American Association for the Advancement of Science (2000) provides evidence that CMP, when implemented as indicated in the materials, builds on student ideas. In part, the implementation necessitates that teachers use the materials as their daily curriculum in the sequence provided and embody the CMP philosophy for pedagogical content knowledge development. Fostering conceptual understanding requires taking time to attend to the ideas students already have, both ideas that are incorrect and ideas that can serve as a foundation for subsequent learning (Ball, 1993). The importance of taking account of students’ ideas has long been recognized. Ausubel (1968) noted that "the most important single factor influencing learning is what the learner already knows." (p. 16) There are many implications of this finding in mathematics teaching and learning. Difficulties in mathematical problem solving are often caused by students’ ineffective use of what they already know (Schoenfeld, 1992). If students have narrow conceptions and representations of ideas or procedures that do not extend to other situations, their subsequent work can result in misconceptions (Bell, Greer, Grimison, & Mangan, 1989; Fischbein, Deri, Nello, & Marino, 1985). For example, students’ intuitions about number operations need to be revised when they move to expanded number systems (Graeber & Campbell, 1993). Students may decide, for instance, that when multiplying, the result is always larger than either of the two original numbers – a generalization that can lead to trouble when they move to working with numbers less than one. Additionally, Hart (1988) and Matz (1980) found that prior knowledge from arithmetic leads to misconceptions when generalized to more advanced topics.
Teachers who understand students’ knowledge and thinking are able to use this information to improve the quality of their instruction (Carpenter, Franke, Jacobs, Fennema, & Empson, 1998; Cobb et al., 1991). Several strategies have been found that are effective in identifying and addressing prior knowledge. For example, a discussion of how students perceive the difference between two solutions to an exercise or problem can provide insights into student understanding (Cobb, 1988). Also, an assessment of how students extend procedures to other contexts and situations can reveal misconceptions or lack of understanding (Hiebert & Wearne, 1986). Both of these strategies apply to a wide range of mathematical ideas and procedures.
Instruction should also provide opportunities for students to make connections between and among mathematical ideas and skills. Resnick (1987) concluded that without explicit assistance in connecting ideas, people do not usually learn concepts simply by building up pieces of knowledge. Unless instruction attends to students’ prior knowledge and teachers are alerted to it, the sequence of activities might be inappropriate or ineffective (Mack, 1990). Moreover, further misconceptions may develop, or achievement may diminish for many students who are unable to develop more sophisticated ideas, which may be partially due to persistent errors (Brown & VanLehn, 1982; Matz, 1980).
Promoting Student Thinking About Mathematics
Classroom discourse can exploit the use of language as a powerful tool for orienting and focusing attention and is crucial for constructing relationships (Greeno, 1988; Resnick & Omanson, 1987). Specifically, students who are expected to engage in communication about mathematics will have improved conceptions of the nature of mathematics (Lampert, 1989). Working in pairs and small groups can be an effective tool for promoting student communication. Both Slavin (1989) and Webb (1989) found that work in small groups can enhance achievement through student interaction if the work is focused carefully on learning mathematical ideas.
Guidance of student interpretation and reasoning through classroom discourse and work in small groups can help students construct and formalize their ideas so they are more accessible. Students need the opportunity for self-discovery through activities that are unstructured enough to allow them to derive generalizations and invent their own procedures (Doyle, 1983). Questions in the lesson summary can also help students reflect on the mathematical concepts and help them establish connections between mathematical topics (Madsen-Nason, 1988).
Research Questions
The present study considered questions about middle school mathematics teaching and learning with understanding. These questions were of practical interest to the teachers and administrator who were involved and represented concerns that the authors and the teachers worked together to address after considering student performance on the previous year’s standardized test. This article reports initial progress toward quantitative answers to the questions for our sample: Is teaching and learning with understanding coterminous with achievement on high stakes multiple-choice tests? Can teaching with understanding improve the achievement of students who are at risk to the same level as those who are not at risk? Is teaching with understanding equally effective regardless of students’ gender, ethnicity, or socio-economic status?
Methodology
Design
This was an exploratory study using a pretest-treatment posttest design. Each student’s achievement on a state mathematics assessment was compared with their achievement the previous year using the Texas Learning Index (TLI). Therefore, the students acted as their own control, based on their previous year’s achievement. Students were assigned to mathematics teacher by the school district with the goal of heterogeneity but this was outside the control of the researchers and each mathematics teacher is part of a smaller learning community in which all their students also have the same language arts, social studies, and science teachers. Along with planning in their smaller learning community, content area teachers also plan and meet to ensure continuity.
Setting
After piloting a few CMP units the year before the study began, sixth grade schoolteachers in a suburban community located in the southwestern United States decided to fully implement the CMP curriculum the next year. The piloted units were based on school need as indicated by student performance on the state standardized test. The CMP textbooks have received high ratings on criteria reflecting instructional quality and the use of approaches found in research literature promoting teaching with understanding (AAAS, 2000). The teacher leader in the school approached the senior author who agreed to help purchase textbooks. Researchers and teachers collaboratively decided that a careful study of implementation would provide important data to support teachers’ implementation efforts. The purpose was to study mathematics teaching and learning and the extent of implementation of the textbooks, not to compare the teachers based on their students’ performance on tests.
Participants
All sixth grade mathematics teachers (Teachers A, B, & C) agreed to participate in classroom observations and data collection. Ninety-minute periods per day were allocated for teaching mathematics as indicated in the CMP suggested scheduling guidelines to provide ample time for meaningful exploration and practice. All classes were conducted in English. Two of the teachers pilot tested CMP units previously; the other teacher had never used the textbook before. As is typical for most textbook adoptions and is common practice in most schools none of the teachers had formal training in CMP materials. While a best case would be to provide the highest possible level of training it is not the case that would happen generally, therefore, to afford the greatest possibility for generalizability no training was provided to approximate the effects of textbook, disentangled from training effects. The study included 140 sixth-grade students; however, due to attrition caused by student mobility, complete data was available for 105 student participants. The attrition did not significantly change the composition of the student sample. Demographics within the remaining sample were comparable to those of the school and are displayed in Table 1.
Demographic information regarding ethnicity was determined by each student’s parents. Economically disadvantaged status was defined by students qualifying for free or reduced meal programs. The variable “at-risk” was defined by a set of state criteria that identifies students in danger academically or as potential dropouts. According to the state’s definition, “at-risk” includes, but is not limited to, students who did not advance from one grade level to the next for one or more years, are of limited English proficiency, were placed in alternative education or were expelled during the current or preceding school year, or resided in an emergency shelter, halfway house, or foster group home (Texas Education Agency, www.tea.state.tx.us, 9/16/05).
Demographic Characteristics of the Sample (n = 105)
| Economically Disadvantaged | At Risk | Not At Risk | Total* | |
|---|---|---|---|---|
| White | 10 | 17 | 68 | 85 |
| Black | 8 | 6 | 2 | 8 |
| Hispanic | 5 | 2 | 7 | 9 |
| Asian | 0 | 0 | 3 | 3 |
| Male | 13 | 16 | 34 | 50 |
| Female | 10 | 9 | 46 | 55 |
*Note. Numbers in the first three columns are not independent; that is, a student may be counted in two or more categories.
Data Sources
The scores from the Spring 2000 and 2001 Texas Assessment of Academic Skills (TAAS) test were the primary quantitative data for the study. In order to examine possible differential effects of CMP instruction across four mathematics content areas and problem solving, five of the 13 Texas Essential Knowledge and Skills (TEKS) Mathematics Grade Six objectives were the focus of teacher observations during the study. The TEKS objectives in the study focused on number, algebra, geometry, statistics, and problem solving, respectively because they were aligned with content being covered by teachers’ use of CMP. These TEKS objectives corresponded to five TAAS performance objectives on which students were tested. Each set of TAAS performance objectives was assessed by four test items, with a sub-score provided for each set. Problem solving was an exception and was assessed using six items. Table 2 lists the TAAS performance objectives and a sample test item from each.
The Texas Learning Index (TLI) is a score that characterizes a student’s performance on the TAAS in relation to the passing standard. The TLI was developed to allow students, parents, and schools to relate student performance to a passing standard and to compare student performance from year to year. A TLI of 70 represents a passing standard. The top end of the score range may differ from subject to subject and from year to year. For example, the 6th grade mathematics maximum TLI in 2000 was 93; the maximum score in 2001 was 92. The Mathematics Differential score is the difference between the two consecutive year’s TLI scores. The mean gain for the state’s students moving from sixth to seventh grade was -.4 and the median was .1. A student’s TLI score that is the same as the previous year’s (Mathematics Differential equal to zero) means the student demonstrated one year’s typical progress and his / her performance is relatively the same as the previous year (Texas Education Agency, www.tea.state.tx.us; 9/16/05).
In addition to obtaining quantitative data, we observed the three teacher participants and their students a total of 18 times, 6 class periods per teacher. Researchers (videographers) spent one month prior to the study observing each classroom, establishing rapport with both teachers and students to reduce intrusion on classroom activities and teacher practice. Field notes, observation checklists, and video and audio recordings were used to collect observational data. These data helped to determine the level of implementation and fidelity to the curriculum materials.
Mathematics Learning Goals (TEKS) Correlation with TAAS Objectives and Sample Items
| Texas Essential Knowledge and Skills | TAAS Objective | Sample Item |
|---|---|---|
| The student represents and uses rational numbers in a variety of equivalent forms. (number, operation, and quantitative reasoning) | (1) Demonstrate an understanding of number concepts | 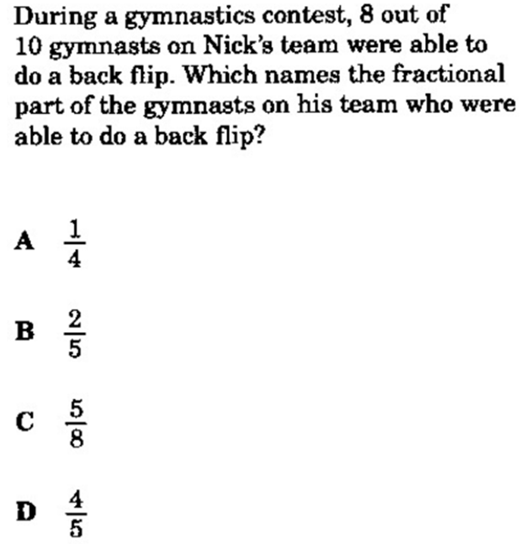 |
| The student uses letters to represent an unknown in an equation. (patterns, relationships, and algebraic thinking) | (2) Demonstrate an understanding of mathematical relations, functions, and other algebraic concepts | 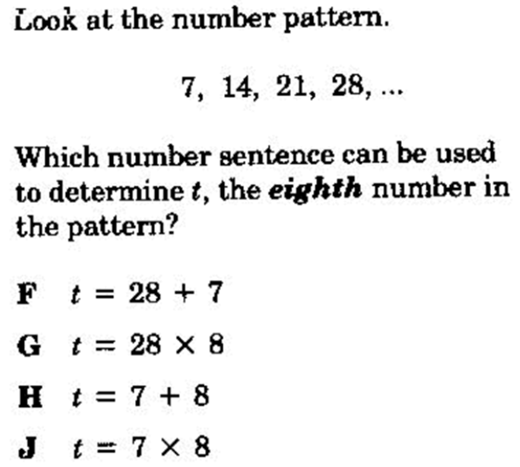 |
| The student uses geometric vocabulary to describe angles, polygons, and circles. (geometry and spatial reasoning) | (3) Demonstrate an understanding of geometric properties and relationships. | 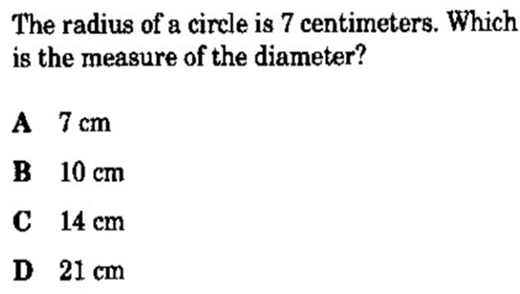 |
| The student uses statistical representations to analyze data. (probability and statistics) | (5) Demonstrate an understanding of probability and statistics | 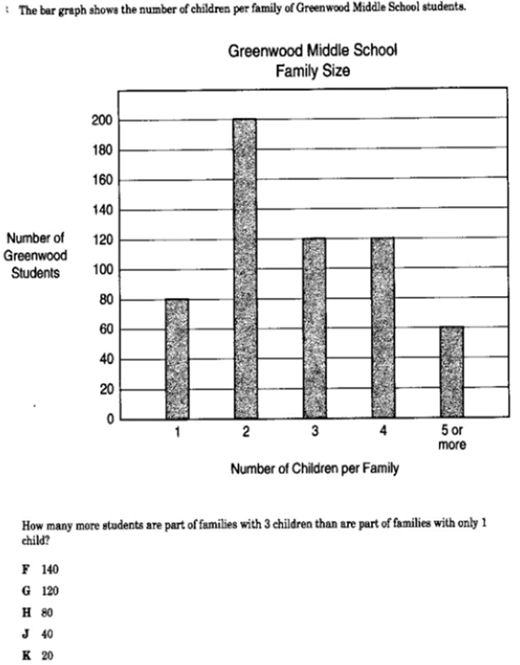 |
| The student will select or develop an appropriate problem-solving strategy from a variety of different types, including drawing a picture, looking for a pattern, systematic guessing and checking, acting it out, making a table, working a simpler problem, or working backwards to solve a problem | (11) Determine solution strategies and will analyze or solve problems. |  |
Data Analysis
The results of the Spring 2000 and 2001 TAAS test were analyzed using a t-test to compare students’ achievement on the 6th grade test with their achievement on their previous year’s 5th grade test. The effect of at-risk status and gender were analyzed using a two-way analysis of variance (at-risk by gender) with Mathematics Differential as the dependent measure. Finally, to determine possible differences in achievement across content areas, a multiple analysis of variance was performed on the TAAS scores for each of five TAAS content objectives (number, algebra, geometry, statistics, and problem solving), using at-risk, gender, socio-economic status, and ethnicity as independent variables.
The lynch pin for the quantitative analyses was establishing the Level and Fidelity as regards two of the strengths of the CMP curriculum. In an analysis and ranking of middle grades textbooks, a study by AAAS (2000) applied seven criteria that reflected research on effective mathematics teaching and learning. CMP ranked first or second on all seven criteria, and was one of only three textbooks that had high scores on two critical criteria: (1) building on student ideas and (2) promoting student thinking. For this reason, the level and fidelity of these criteria were chosen as measures of whether, and to what extent, the instruction reflected the intent of the CMP curriculum. First, to establish that teacher enactments of the curriculum built on student ideas, the videos were coded for each instantiation in which the teacher built on student notions. Second, the videos were coded each time teachers promoted student thinking about mathematics. Instances of building on student ideas were identified any time the teacher used a student comment or question to expand or develop deeper insights into the mathematics being presented. Instances of promoting student thinking about mathematics were identified when teachers asked questions or encouraged student comments relating the mathematics content being taught. To ensure reliability, training included chunking and time coding of all videos. Agreement among coders had to reach the 95% threshold before coders were authorized to chunk and time code on their own. Agreement was determined by meeting all criteria with 90% overall agreement. Videos were assigned so that at least three different coders examined each video. The coders did not know who else was assigned the same videos because they worked individually. When they submitted their chunked and time coded results, discrepancies were noted. When any coder deviated more than 10% from the other coders, the particular coder was retrained. However, final decisions about chunking discrepancies were judged by the primary researcher. The entire research team reviewed each time coding and each transcription for final analysis for fidelity of implementation.
Level and Fidelity of Implementation
The observations and video analysis indicated that the three teachers varied in their approaches to implementation, depending mostly on how closely the instructional approach used in CMP matched their own teaching. One of the teachers (Teacher C) claimed to be very comfortable with CMP from the beginning and implemented all of the units exactly as described in the teachers’ manual. As the year progressed, the two teachers who implemented more loosely began to use the units with more fidelity (see Table 3). Teacher A, who had never previously taught the material, on occasion fell back on more traditional strategies but used the CMP units regularly. In examining the implementation of the textbook, we were especially interested in the two factors that contribute to student understanding: (1) building on students’ prior ideas about mathematics and (2) promoting student thinking and reasoning about mathematics concepts (Kulm, et al., 2001).
The videos of the teachers were viewed and analyzed to obtain specific data on the level and extent of implementation of the textbook. The following observation questions guided the analysis:
- ○
How often did teachers use the CMP textbook?
- ○
Did the enactment reflect the lesson as written in the textbook?
- ○
What percentage of the textbook lesson was enacted?
- ○
What percentage of the questions in the enacted lesson were included in the textbook?
- ○
How many questions are related to building on students’ ideas?
- ○
How many questions are related to promoting student thinking?
Level and Fidelity of Implementation of Criteria
| Teacher | A | B | C | Mean |
|---|---|---|---|---|
| CMP textbook use | 56% | 84% | 100% | 82% |
| Enactment of written lesson | Yes | Yes | Yes | |
| Percent of CMP lesson enacted | 74% | 90% | 100% | 84% |
| Total time spent teaching CMP* | 42 min. | 70 min | 60 min | |
| Percent of CMP textbook questions in enacted lesson | 68% | 93% | 100% | 88% |
| 1Building on student idea questions | 7 | 12 | 21 | 13a |
| 1Promoting student thinking | 4 | 6 | 13 | 8b |
Note. a16% of all questions;
b10% of all questions; Teachers A&B had 90 minute periods; Teacher C had 60 minute periods; mean not computed;
1Numbers reported by teacher are mean per lesson questions rounded to the nearest whole number
The following excerpts from observation notes and transcripts of videos provide examples of the three teachers’ implementations. In the excerpts, the statements and questions denoted by ‘T’ are exact quotations from the teachers. The responses denoted by ‘S’ represent either exact quotes from individual students or a summary statement that represents several students’ responses. The response denoted by ‘C’ represents a choral class response. Any names that appear within the transcript have been changed to protect the anonymity of the participants.
Teacher A - Introductory Investigation in the unit Data about Us
T: What is data?
S: Information, anything you research.
T: In Bits and Pieces did we use data?
S: Yes, in the cats table.
T: What information did the database contain about cats?
S: It had their name, weight, and age.
T: How do you think they collected the data about cats?
S: They asked questions.
T: Could they find data like the weight by asking? How much does your cat weigh? How do you know?
S: I would guess.
T: Unless you have recently been to the vet, you would have to actually weigh the cat. This is another way to gather data. Think of other ways you can gather data.
Teacher A used a question and answer approach, following the suggestions provided by the CMP teaching guide to find out what students know about data representation. This strategy is an important component that is necessary in order to build on student ideas. She helped the students to connect their knowledge about data from a previous unit and worked to guide students’ reasoning and thinking about different approaches to collecting and representing data.
Teacher B - A lesson from Ruins of Montarek (3-D Shapes) Students are handling and describing 3-dimensional shapes.
T: If we could go on then maybe we could learn the names of the rest of these. Okay, in your Connections they say how many faces, edges, and vertices are there in the Great Pyramid of Kufu? It says the Great Pyramid of Kufu is a square pyramid. So it has one square face and four triangular faces. So there are five faces in all. Count your faces on your … square pyramid.
S: Five
T: Okay, you’ve counted all of them and the bottom. So there are five faces in all. There are four edges where the side faces meet the base. Four more edges are where the side faces meet each other. So there are eight edges in the pyramid in all. There are four vertices of the square’s base and a vertice (sic) where each of the faces meets. So there are five vertices in all. So the main ones that you count are which ones?
S: The bottom. Base.
T: The bottom, which is your base and then the one where the face meets the square. Well, meets the base. You count that one. So that would add to …
S: So how do you get five?
T: Look at. Well, I was going to say … There is four. Look at your book. Our bottom of the pyramid, there is how many?
S: Four.
T: Huh, it is a what?
S: Square.
T: Okay, and it has how many vertices on a square?
S: Four.
Teacher B used manipulative materials to help students see the properties of shapes. The use of concrete models is an attempt to build on student ideas, through using a familiar object. However, it is unclear whether the teacher allows students to have the opportunity to construct their own ideas. The instruction is didactic, aimed mainly at providing and eliciting information. Some of the questions attempt to guide student thinking but other questions are focused on obtaining specific answers, rather than on encouraging students to think and explore.
Teacher C - An investigation with pentominoes from the unit Ruins of Montarek
T: So, all of you remember perimeter, right? What do you do to count the perimeter? (Pause) How do you know what the perimeter is?
S: If it’s like a square, it’s the length times the width times two. It’s the length around the …
T: Okay. If it’s a square, if it’s a square or rectangle, it’s length plus width times two. Okay. It’s just the outside edge. The outside of your object and in this case it happens to be pentominoes. Anybody want to give a little guess on the perimeter of your pentominoes? (Pause) Are they all different?
C: Yes.
T: Is the area all the same?
C: Yes.
T: What is it?
C: Five.
T: How about the perimeter? Damon quit counting.
S: They’re all the same, I know.
T: You know.
S: Uh-huh.
T: Anybody else have an opinion on that? What do you think Martin?
S: I don’t think the perimeters are the same because “I” has four sides and “W” has six sides or something.
T: Okay. Good observations.
S: Well the “P” doesn’t have as many sides open as the “W.”
T: What do you guys think of that? Did you hear what she said? (Pause) Sean?
S: Kind of like what Sharon said. Like different things, the “X”, and the “P”, and the “W.” They have more open sides. Like the “P” is closed.
T: Uh-huh. Uh-huh. Janie?
S: The more zigzags and open spaces you have, the more perimeter.
T: Okay. Right. The more open spaces. Tell you what, I’m going to give you a paper. You’re going to be able to record the perimeter of each pentominoe. Then you’re going to go on to pentominoe pairs, pentominoes together. Kind of like your homework except this time you are going to be finding perimeters on pentominoe pairs. Okay? Why don’t you get started on it just as soon as you get your paper? If you have any questions, I can answer them. (Walks around classroom)
Teacher C used students’ answers, including incorrect ones, to build on their ideas and encourage students to explore on their own. The teacher used other questions to guide the students to think about the shapes, rather than counting, in order to develop a conceptual understanding of the relationships. The teacher’s efforts in guiding students to reason and think helped the students make a generalization about the relationship between the shapes of the pentominoes and their perimeters.
These excerpts are representative of the lessons we observed. Overall, as was shown in the lesson transcripts from videos and information presented in Table 3, the CMP materials were implemented reasonably well, neither perfectly nor poorly. As the year progressed, each of the teachers appeared to become more comfortable with the material. They expressed this perceived change to us in postobservation conversations. In summary, the observation and video data as summarized in Table 3 support the conclusion that CMP was implemented with reasonable fidelity throughout the year. In particular, the teachers used the textbook’s strategies of building on student ideas and guiding students to think and reason about mathematics. The teachers worked to implement the textbook with the intention of providing students the opportunity to learn mathematics with attention to understanding concepts as well as learning skills.
Results
In this section we report the results of the analyses of the TAAS data. The TLI and the Mathematics Differential (the difference between the 2000 and 2001 TLI scores) components of the TAAS student report were used as dependent variables, and an “at-risk” indicator was used as the independent variable. Table 4 shows the comparison of 5th to 6th grade change in TLI score for the same students overtime. There is a noticeable decrease in the spread of the scores (22.41) accompanied by a marked gain of nearly 14 points on the TLI. This combined information indicates that student scores grouped more closely together with improve performance as opposed to an overall decrease in performance. The two-tailed t-test of statistical significance indicated that student performance improved when comparing 6th grade performance to 5th grade performance. The standardized effect size (difference in the means divided by the pooled standard deviation) is .82. The effect size is large by educational standards (Capraro, 2004) and would be considered large when considering Cohen’s (1988) benchmarks for standardized effects. Three students in the study received a perfect TLI score of 92, answering all 56 questions correctly. Thirty-nine (37%) of the students missed only 2 to 4 questions resulting in a score of 90 or 91. All but two students passed with a score of 70 or better.
Analyses of Previous (5th Grade) and Current (6th Grade) Texas Learning Index Scores
| Mean | N | Std. Deviation | Std. Error Mean | t | df | Sig | |
|---|---|---|---|---|---|---|---|
| 5th Grade TLI | 73.01 | 105 | 28.66 | 1.123 | |||
| 6th Grade TLI | 86.97 | 105 | 5.52 | .538 | |||
| 5th Grade - | |||||||
| 6th Grade TLI | -4.93 | 104 | .000003 |
Note. Texas Learning Index is a measure designed to compare student progress from year to year.
In comparing mean gains, the at-risk group (n = 25) gained on average 10.16 (SD = 17.37) TLI points from 5th to 6th grade as compared to the not at-risk group (n = 80) which gained on average 1.74 (SD = 4.32) TLI points. The weighted mean standardized effect was .38. Although one cannot dismiss the ceiling effect (i.e., when students start out high their growth is limited by the maximum score for the measurement instrument) for the not at-risk students, in this case, it demonstrates high achieving students remained high achieving whereas at-risk students demonstrated practically significant increases. As with the use of any educational treatment, it is important to demonstrate that it does not influence various constituents adversely. Whereas given the limitations of the measurement instrument it is not possible to know if not at-risk group might have actually gained more from the curriculum than the at-risk group. However, the gains reported here indicated that indeed the treatment provided accelerated growth in the performance of at-risk students as compared to previous years, as illustrated in the ANOVA.
In further analysis of the data, a two-way analysis of variance (ANOVA) of the Mathematics Differential was conducted with gender (male vs. female) and at-risk (at risk vs. not at-risk) as independent variables. The results of the ANOVA are displayed in Table 5. The main effect for gender was not significant at the .05 level. The main effect for at-risk was significant at the .01 level, with the students not at-risk out-performing those at-risk (F (1, 89) = 11.731, p<. 01, r 2= .141). The analysis of student gains by at-risk and not at-risk indicated that they experienced a marked improvement. The ANOVA results contextualize the gain score finding to indicate that at-risk student performance continues to lag that of not at-risk students. However, the practical significance is small when considering Cohen’s classification. The interaction of gender by at-risk was not significant at the .05 level. The 14% effect size is practically important in this study and can be considered large by comparison to similar1 educational studies reporting an effect size statistic (cf. Ben-Chaim et al., 1997; Cain, 2002; Clarkson, 2002; Hoover et al., 1997; Jansen & Herbel-Eisenmann, 2001; Mullins et al., 2001; O’Neal & Robinson-Singer 1998; Reys et al., 2003; Ridgway et al., 2003; Riordan & Noyce, 2001).
ANOVA of Mathematics Differential by Gender and At Risk
| Source | df | F | Sig. |
|---|---|---|---|
| Gender | 1 | .522 | .472 |
| At Risk | 1 | 11.731 | .001 |
| Gender X At Risk | 1 | .621 | .433 |
| Error | 89 |
Note. R2 = .141
Most educational research settings demand an analysis that accounts for reality, so a multivariate analysis was used to match the research design as closely as possible (Baggaley, 1981). Using a multivariate approach in real-life research situations increases the reliability of the results by limiting the inflation of Type I "experimentwise" error rates by reducing the number of analyses in a given study (Capraro & Capraro, 2001; Shavelson, 1988; Thompson, 1991). Furthermore, Thompson (1991) stated multivariate approaches limit "experimentwise" error, reducing the probability of making a Type I error anywhere within the investigation. A MANOVA was performed to determine whether a statistically significant difference was present among the five TAAS objectives as a function of ethnicity, at-risk, and economically disadvantaged. The MANOVA results in Table 6 show the difference between the not at-risk and at-risk groups were significant for the algebra, statistics, and problem solving items. There was a statistically significant effect for ethnic groups; with the mean of the white students being greater than all other ethnic groups for algebra. There was also an interaction for at-risk and economically disadvantaged students for the statistics and problem solving items. The R2 for Objectives 1, 2, 3, 5, and 11 are 21.1%, 18.0%, 25.7%, 13.9%, and 31.6%, respectively. Objectives 5 and 11 contribute the most to the variance accounted for in the model overall followed by Objective 3. Each effect size is of practical importance and could be considered high by educational research standards.
MANOVA by Objective
| Source | Dependent Variable | df | F | Sig. |
|---|---|---|---|---|
| Ethnicity | Obj. 2: Algebra | 1 | 4.445 | .038 |
| At Risk | Obj. 2: Algebra | 1 | 5.553 | .020 |
| Obj. 5: Statistics | 1 | 4.161 | .044 | |
| Obj. 11: Problem Solving | 1 | 4.740 | .032 | |
| EconDis | Obj. 5: Statistics | 1 | 4.722 | .032 |
| At Risk by EconDis | Obj. 5: Statistics | 1 | 4.161 | .044 |
| Obj. 11: Problem Solving | 1 | 3.542 | .033 |
Note. Objectives 1 and 3 were not significant on any of the factors and omitted from this table. Obj 1 R2 = .211; Obj 2 R2 = .180; Obj 3 R2 = .257; Obj 5 R2 = .319; Obj 11 R2 = .316
According to the Task Force on Statistical Inference (1999), effect size should be interpreted based on comparable studies with similar samples. “Always present effect sizes for primary outcomes. If the units of measurement are meaningful on a practical level (e.g., number of cigarettes smoked per day.…It helps to add brief comments that place these effect sizes in a practical and theoretical context” (p. 599). In this study, on Objective 2 (algebra), White students have a mean of .93 (SD = .37) and non-White students a mean of .65 (SD =. 49) with a 18.0% R2. The results are both statistically significant and practically significant (see Table 7) accounting for almost one-fifth of the variance in the item. This objective consisted of four questions and was scaled as 1, mastered or 0, not mastered. In comparing the means, the non-White student mean is approximately 28% lower. Nearly one-third of the Non-White students failed to achieve mastery on the algebra objective, whereas nearly all the White students achieved mastery. The differences in the means on Objective 2 for at-risk were also practically significant. The mean for at-risk .68 (SD = .48) and not at-risk .94 (SD = .35) indicated that not at-risk students achieved mastery nearly 26% more often. Therefore, the effect size of 18.0% is relatively large in comparison with other similar studies, and the differences in the means are important enough to warrant attention.
The means for Objective 5 (statistics) for at-risk was .88 (SD = .33) and not at-risk .99 (SD = .11) indicates that nearly all not at-risk students mastered this objective (see Table 8). The mean for economically disadvantaged students on Objective 5 was .63 (SD = .19) and .96 (SD = .20) for not economically disadvantaged students. Even though the difference between economically disadvantaged and not economically disadvantaged is statistically significant (p= .032). The relatively large effect size of 31.9% for Objective 5 does point to a practically significant result that could be accounted for by the at-risk comparison or the interaction effect for at-risk and economically disadvantaged.
Means and Standard Deviations of Statistically Significant MANOVA Results
| White White | Not | At Ask | Not At Ask | Econ. Disadvantaged | Not ED | |||||||
|---|---|---|---|---|---|---|---|---|---|---|---|---|
| X̅ | SD | X̅ | SD | X̅ | SD | X̅ | SD | X̅ | SD | X̅ | SD | |
| Objective 2 | .93 | .37 | .65 | .49 | .68 | .48 | .94 | .35 | ns | ns | ns | ns |
| Objective 5 | ns | ns | ns | ns | .88 | .33 | .99 | .11 | .63 | .19 | .96 | .20 |
| Objective 11 | ns | ns | ns | ns | .52 | .51 | .80 | .40 | ns | ns | ns | ns |
Note. ns indicates that no statistically significant difference exists on those variables p<.05.
Objective 11, examined as a measure of student thinking, indicated a statistically significant difference across the independent variable of at-risk and the interaction of at-risk by economically disadvantaged. The mean for at-risk students was .52 (SD = .51) and not at-risk was .80 (SD = .40). The effect size is relatively important here because 31.6% of the variance in performance of the proxy measure for student thinking can be accounted for by the at-risk variable. Therefore, students who are not at-risk demonstrate higher levels of performance regardless of this intervention irrespective of the increased performance of the at-risk group across the entire instrument as a whole.
Discussion
The importance of achievement on high-stakes tests cannot be underestimated in states that use them for school and teacher accountability. In these contexts, the implementation of new curriculum materials and teaching strategies must first provide evidence that they “do no harm.” Furthermore, if these new approaches are to be embraced and more widely adopted, they must improve the achievement of students who have not succeeded well with more traditional approaches. Finally, it makes practical sense for school districts to proceed with caution, pilot testing new approaches with volunteer teachers before moving forward on a wider scale. This study was on a small scale and focused on a somewhat narrow question: Is teaching and what students can demonstrate about the content coterminous with achievement on high stakes multiple-choice tests? On the other hand, the study also represents a fairly typical setting with “average” students and teachers and without a rich set of resources to support implementation, making its findings practically relevant.
The primary issue related to implementation was the level, quality, and consistency of implementation. The teachers were intent on reaching the appropriate balance of teaching for understanding and developing procedural skills. They had their traditional district-adopted textbook, as well as their own favorite materials, available throughout the year. They did use these textbooks and materials from time to time but remained committed to using CMP as the primary text. Another aim of the observations was to assure that the “spirit” of the materials was reflected; that is, how well the instruction met the criteria that are important for student understanding: Building on Student Ideas and Guiding Student to Think and Reason. Although this objective was more difficult to judge, our observations and data on the time spent using activities from the textbook and the questions that focused on building and guiding student thinking consistently noted that teachers used the introductory investigations and hands-on activities that are important for building on student ideas. This was bolstered by the results of the examination of the problem-solving objective that functioned as a measure of student thinking and each teacher’s ability to evoke and build on student ideas. The student reflection questions that the CMP text employs were used consistently by the teachers to encourage and guide students to think and reason about mathematical ideas.
The first result that the teachers and administrators noticed was that only two students failed to pass the 6th grade TAAS mathematics test. Although the school’s average on the test had always been good, only 60 to 75% of minority, disadvantaged, and at-risk students had passed the test in previous years. Our formal analysis of the data provided further insight into this result. The mean scores on the TLI reflect not only the significant difference between the previous and current year but also the rate of growth. The nearly 14 point mean gain on the TLI represents acceleration in mathematics achievement as compared to the Texas Education Agency’s own data that on average, students increasing between one and three TLI points have demonstrated one year’s growth. The standard deviations show that the spread of TLI scores was compressed 78% (TLI SD difference divided by the initial TLI SD), illustrating that the TAAS has limited usefulness in measuring students scoring near the upper limit the previous year but indicating that the at-risk students did increase and were responsible for the decrease in standard deviation. An additional important factor in this compression is the 10-point gain in TLI by at-risk students. This gain represents at least one additional grade level equivalent in achievement growth, without sacrificing achievement for students in the not at-risk group.
It is especially important to note that improvement by the at risk students was the main source of gain in TAAS achievement scores. These students, especially those classified as Limited English Proficient, who represent a growing population, present a challenge to many teachers in improving mathematics achievement. The usual approach is to implement intensive test practice programs. Many schools require time be set aside in each mathematics class to do practice TAAS items. The teachers in this study paid close attention to aligning the CMP units and lessons with the TAAS objectives to assure content coverage. In doing this alignment, they attempted to build on and employ the features of the textbook that have potential to address the needs of low-performing students. Our results confirm the findings of Empson (2003) that traditionally low-performing students can perform when the teacher provides opportunities for them to participate in discussing and solving problems. In order to make mid-course assessments the teachers also constructed a mid-year “benchmark” test to determine areas that needed additional work. This diagnostic activity provided the opportunity to further focus on students who needed additional practice or concept development. Finally, the students completed a TAAS practice test a few weeks before the “real test.” None of these practical and sensible measures were inconsistent with the intended implementation of the CMP materials.
Limitations
The achievement gains varied somewhat across mathematics topic areas. Although only a few items of the TAAS measure each of these, there appeared to be differential effects on at-risk, minority, and disadvantaged groups for the algebra, statistics, and problem solving objectives. Since the CMP materials develop algebra ideas primarily in 7th and 8th grades, these students may not have had an opportunity to fully develop their understanding of the algebra objectives. A full 6th grade unit in CMP addresses statistics. However, it takes some time for students to develop and revise their ideas. Statistics may be a relatively new topic for these at-risk students because in previous years students identified as low achieving as measured by TAAS were segregated to a “TAAS” mathematics class where they were given intense remediation mainly focused on computation for the purposes of improving their performance. It may take more time for these students to make significant gains in their understanding and achievement of statistics ideas and skills.
Summary
This study addressed practical questions that were of interest to a few teachers in one school, but these practical questions represent the concerns of many mathematics educators and teachers. We found that teaching and learning with understanding is compatible with achievement on high stakes multiple-choice tests. We also found that the needs of all students can be addressed with high quality high curriculum materials. Students who had been classified as being at-risk for failure gained more than two grade levels in mathematics achievement. The results of the study have had practical impact. The 6th grade students have moved to a middle school this year. The teachers and principal in that school have decided using research-driven data to adopt the CMP materials so that these students can continue to develop their mathematical understandings.
References
Footnotes
We use the phrase “similar studies” to refer to quantitative educational research studies exploring similar phenomena under similar conditions. We do not intend to convey that the same phenomena are investigated using the exact same analytic method. For comparison purposes, reported effect sizes were converted to Cohen’s d and when effect sizes were not provided but means and standards deviations were provided Cohen’s d was calculated (cf. Capraro, 2004).
