

Data literacy is recognized as a critically important skill in today’s society, but thinking with and about data is often ignored in K-12 curricula. The Thinking With Data (TWD) project advocates that data literacy is a skill that should be addressed in an interdisciplinary manner. This article provides an overview of the TWD curriculum for middle school, which uses an extended Preparation for Future Learning (PFL) framework to teach data literacy across subjects. Research conducted during field implementation of the curriculum in two middle schools investigated whether the approach worked, and if so, why. Results show evidence of student gains in data literacy skills as well as in mathematics and science. Our best evidence of learning of data literacy skills was found during the social studies and mathematics modules. While we have preliminary evidence of learning in science and language arts, potential gains in these modules need to be more closely examined.
Perspectives/Theoretical Framework
Much has been written about the importance of understanding quantitative data in today’s society (Briggs, 2002; Madison, 2002; Steen, 2001). Unfortunately, this realization has not translated into classroom practice. There has been significant research on the teaching and learning of data analysis and probability (Lehrer & Schauble, 2002) as well as on key aspects of data literacy that are age appropriate for middle school students, and data analysis has been included in mathematics education standards for many years (National Council for Teachers of Mathematics [NCTM], 2000). However, data analysis is still relegated to a few days in mathematics class in which students calculate measures of central tendency and read simple graphs and tables, without aiming for true data literacy. Indeed, Rubin (2005, p. 22) writes that, “‘Numerical literacy’ is woefully incomplete without ‘data literacy,’ yet we shortchange most students by leaving these topics out of the common series of math courses.”
Although unfortunate, this situation is perhaps inevitable. Most teachers in the United States cannot find time to cover their required material, with textbooks that are already “a mile wide and an inch deep” (Schmidt, McKnight, Cogan, Jakwerth, & Houang, 1999), leaving them with the impression that there is no time to address a topic as complex as data literacy. And data literacy is indeed complex, as it includes the ability to formulate and answer data-based questions; use appropriate data, tools, and representations; interpret information from data; develop and evaluate data-based inferences and explanations; and use data to solve real problems and communicate their solutions. Compounding the issue in addressing data literacy is the organization of today’s middle school itself: In many schools, individual subjects are still taught in relative isolation, as students move from class to class, with each class focusing on an individual discipline. However, true data literacy cannot be taught within classes that are focused on a single discipline (Briggs, 2002; Madison, 2002; Scheaffer, 2001; Steen, 2001). This is most obvious in considering the role of the context of investigation: Whereas in most mathematics “the context is part of the irrelevant detail … in data analysis, context provides meaning” (Cobb & Moore, 1997, p. 801; see also Rubin, 2005). We cannot expect the context for using the skills of data literacy to come solely from the mathematics classroom, nor can we expect the data analysis required for data literacy to come from the other disciplines. True data literacy, especially at the middle grade level, requires contributions from across the curriculum.
While recognizing the challenges of implementing cross-disciplinary learning activities in middle school, there is reason to be hopeful that middle schools will be able to support this cross-curricular learning, as the importance of data literacy has been recognized across middle school disciplinary standards (Table 1). Furthermore, our prior research found significant student learning of key mathematical concepts in a 3 week, sixth grade curricular unit that integrated mathematics and social studies through the use of data (Vahey, Yarnall, Scan, Patton, & Zalles, 2006). By taking advantage of this confluence of learning standards across the disciplines, our research has found that we can allow students to experience true data literacy, even within the constraints of current middle school organizational structures, especially in middle school environments where team-teaching approaches are encouraged.
We build on research that indicates that a cross-curricular approach to learning may be especially beneficial for students in the middle grades (Beane, 1997). With the onset of early adolescence come many physical, emotional, and intellectual changes. Concrete thinkers become abstract thinkers who need a positive, active, and interdisciplinary learning environment to develop skills such as critical thinking, decision making, and metacognitive reflection (Beane & Brodhagen, 2001; Brown & Canniff, 2007; National Middle School Association [NMSA], 2010; Parker & Neuharth-Pritchett, 2008). In addition, it is at this age that learners develop a curiosity about the world and life in general, and middle school is the time that students develop more sophisticated ways to think about, understand, and feel empathy for people near and far. Making connections between learning and everyday life, as well as local and global issues (in our case water) becomes increasingly important (Beane, 1993; Kalchman, 2011). Moreover, much of the knowledge and skills that students learn in middle school are building blocks for what comes next; in mathematics, for example, they learn about proportional reasoning, which is a foundation of higher levels of mathematics. Unfortunately, this is also the time at which students become increasingly disinterested in school-based learning (which may be partially due to the separation of disciplines into discrete courses and their disconnection from students’ own lives), and are exposed to a substantial amount of faulty reasoning by peers and advertising (Eccles & Midgely, 1990; Parker & Neuharth-Pritchett, 2008).
Links to Data Literacy Across Four Content Areas
| Data Literacy Requirement | Middle School Mathematics Standards (National Council for Teachers of Mathematics) | Middle School Social Studies Standards (National Council for the Social Studies) | Middle School Science Standards (National Science Teachers Association)a | Middle School English Language Arts Standards (National Council for Teachers of English) |
| Formulate and answer data-based questions | “Formulate questions, design studies, & collect data about a characteristic shared by two populations or different characteristics within one population.” | “Formulate historical questions, obtain historical data, question & identify gaps in data, & construct sound historical interpretations.” | “Identify questions that can be answered through scientific investigations. Develop the ability to refine & refocus broad & ill-defined questions.” | “Students conduct research on issues & interests by generating ideas & questions, & by posing problems.” |
| Use appropriate data, tools, and representations | “Select, create, & use appropriate graphical representations of data; discuss & understand the correspondence between data sets & their graphical representations.” | “Use appropriate geographic tools such as atlases, data bases, systems, charts, graphs, & maps to generate, manipulate, & interpret information.” | “Use appropriate tools & techniques to gather, analyze, & interpret data; the use of which, including mathematics, will be guided by the question asked & the investigations students design.” | “They gather, evaluate, & synthesize data from a variety of sources (e.g., print & nonprint texts, artifacts, people) to communicate their discoveries in ways that suit their purpose & audience.” |
| Develop and evaluate data based inferences and explanations | “Use observations about differences between two or more samples to make conjectures about the populations; use conjectures to formulate new questions & studies to answer them.” | “Encourage increasingly abstract thought as learners use data & apply skills in analyzing human behavior in relation to its physical & cultural environments.” | “Students can learn to formulate questions, design & execute investigations, interpret data, use evidence to generate explanations, propose alternative explanations, & critique explanations & procedures.” | “Students use spoken, written, & visual language to accomplish their own purposes (e.g., for learning, enjoyment, persuasion, & the exchange of information).” |
The National Science Teachers Association has not developed its own standards. Instead, it endorses the National Science Education Standards (NSES) as developed by the National Research Council (http://www.nsta.org/about/positions/standards.aspx).
To maintain student interest in academic learning, provide them with curriculum that is meaningful and challenging, and prepare them for full participation in our data-rich society, an interdisciplinary data literacy curriculum can provide a solution (Koellner, Wallace, & Swackhamer, 2009; Wood, Jones, Stover, & Polly, 2011). Our approach situates students in interdisciplinary and real-world contexts that provide urgency, focus on proportional reasoning as a critical mathematics concept, and teaches them to formulate and answer data-based questions, use appropriate data, tools, and representations, and create data-based inferences and explanations (see Table 1).
The Thinking with Data Curriculum
Data Literacy
Within the framework of middle grades education, Thinking With Data (TWD; http://www.rcet.org/twd/) takes seriously the notion that robust learning is grounded in authentic contexts (Bransford, Brown, & Cocking, 2000; Brown, Collins, & Duguid, 1989). It is committed to engaging students in the investigation of a real societal problem using real-world data across disciplinary fields. Indeed, if the goal of data literacy is to develop students’ abilities to use data to make informed decisions (Rubin, 2005; Steen, 2001), it is imperative that we so situate their learning.
The TWD unit was created as a series of four 2-week, integrated modules for cross-disciplinary implementation in seventh-grade social studies, mathematics, science, and English language arts classes designed to develop students’ deep understanding of data literacy across the curriculum. The context of water allocation and use was chosen because issues of water are among the most critical facing the world today (de Villiers, 2000), and because issues of “fairness” evoke investigations of real world data.
The social studies module introduces students to data literacy in the context of fair allocation and use of water in the Tigris-Euphrates watershed. This aspect of the data literacy investigation is grounded in United Nations Resolution 51/229 (May, 1997), which states that: “Watercourse States shall in their respective territories utilize an international watercourse in an equitable and reasonable manner” (p. 5). Students investigate the tensions between Turkey, Syria, and Iraq that are caused by having to share limited water resources. Analyzing a variety of data (including data found in spreadsheets), students come to understand issues surrounding fair and equitable access to water. Student groups create water profiles for the individual countries and negotiate a water treaty between the three countries, without having been exposed to the mathematical tools they need to come up with the best possible solution.
As student investigation moves to mathematics class, the notion of “fairness” invokes the use of proportional reasoning and the concomitant creation of common measures within a real-world context. Students first engage in a hands-on activity to set the stage for learning about proportional reasoning. They then investigate per capita, other forms of unit rate (e.g. water salinity), and percents. The activities culminate in an investigation into mathematical arguments that use proportional reasoning and prepare students for the science and English language arts modules.
In science, students learn to use data to identify important patterns and relationships (Lehrer & Schauble, 2002) and develop coherent arguments (Kuhn & Udell, 2003) to address larger social debates. The module addresses the science behind world water issues, in particular ways in which the water cycle and man-made technologies affect water availability and use. The first part of the module consists of three 2-day explorations into where the water in the Tigris/Euphrates watershed comes from, the effects of open-ditch irrigation on water quality, and the impact of water salinity on plant growth. In these activities, student groups attempt to use data to support a hypothesis or a particular explanation and then share their arguments with their peers. The second part of the science module engages student groups in guided Internet research on similar issues of water availability, quality, and use in selected U.S. watersheds in preparation for the development of persuasive arguments in English language arts.
Finally, in English language arts students use a variety of data literacy skills, including thinking critically about concepts, claims, and arguments as well as reading, interpreting, evaluating, and synthesizing information (American Association of School Librarians [AASL], 2007) to communicate their findings, conclusions, and recommendations accurately and effectively. They transfer the skills they have learned in the previous three modules to communicate what they have learned regarding the water crisis. Building on the research they conduct in science on United States watersheds, students develop reports on water-related issues and possible solutions supported by data-based evidence, and present these to a larger audience.
Thus, the TWD curriculum focuses on the following aspects of data literacy across all four modules:
Formulating and answering data-based questions. Students formulate and answer questions based on their investigation of water availability data in social studies and their investigation of water quality data in science. These questions are deeply linked to core disciplinary content knowledge, and data analysis techniques learned in mathematics are applied to support student investigations in science and English language arts.
Using appropriate data, tools, and representations. The curricular materials focus on the central role of the creation of common measures as key to students’ understanding of what it means to use appropriate data and numerical representations. In our prior research (Vahey et al., 2006) we discovered that the analysis of many social studies contexts required a transformation of data from raw values to a proportional measure that combines two quantities.
Solving real problems and communicating their solutions. Through the use of Web-based and paper materials, students are provided with the context needed to understand real social problems, such as how localities can address issues surrounding water availability and quality. Through the use of multimedia presentations, students communicate their findings and solutions.
Preparation for Future Learning (PFL)
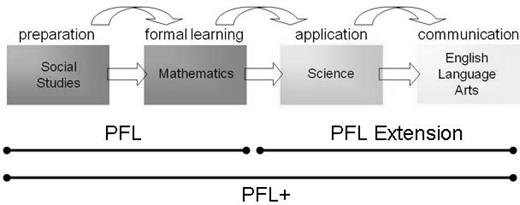
While data literacy makes up the curricular focus of TWD, its pedagogical framework, Preparation for Future Learning (PFL), makes it unique from other interdisciplinary approaches. The PFL approach is based on the finding that certain kinds of conceptual learning are more likely to occur when students are prepared to learn before formal instruction takes place (Bransford & Schwartz, 1999). PFL reverses the traditional lecture-and-apply process (Klahr & Nigam, 2004) and aligns with research that shows that students are more likely to learn when they have recognized the existence of a problem before being presented with a solution (Lehrer & Schauble, 2002). In this framework students first prepare by investigating a set of problems that is designed to highlight the structure of an important concept. Instead of creating complete solutions, students come to understand the structure and parameters of the concept and internalize key dimensions of the situation. Students then engage in a formal learning activity in which they are introduced to a standard solution that is practiced and applied in a variety of contexts. This instructional sequence is consistent with the conceptual change literature, which shows that students must first understand that there is a problem and then realize that their existing understandings are not adequate for creating a solution, before they are fully ready to learn scientific and/or mathematical concepts (Strike & Posner, 1992). PFL has been used in learning about statistics (Schwartz & Martin, 2004), the psychology of memory (Schwartz & Bransford, 1998), water quality (Barron et al., 1998), and ecosystems (Schwartz, Lin, Brophy, & Bransford, 1999).
In the TWD unit, preparation takes place in the social studies module as students learn about water issues in the Tigris/Euphrates watershed. They read about, manipulate, and graphically represent relevant data, but are not provided with formal proportional reasoning tools or heuristics for evaluating arguments. The goal is to have students better understand the complexities of the situation, and “feel” the need for having a process that could create a fair solution, without necessarily creating such a process themselves. Students completing the social studies module engage in the problem, but are typically frustrated with their inability to satisfactorily plan for equitably sharing the Tigris/Euphrates water among the countries through which it flows (van ‘t Hooft, Kratcoski, Swan, Vahey, Cook, Rafanan, & Yarnall, 2010). Students’ desire to overcome this feeling of frustration provides the motivation for formal, yet relevant, mathematics-based solutions. Hence, following social studies, formal instruction takes place in the mathematics module, where students learn to use proportional reasoning tools and heuristics for evaluating arguments and thinking with and about data.
Exploratory research related to an implementation of a 3-week, sixth grade curricular unit that integrated social studies and mathematics through the use of data demonstrated the need to include science and English language arts in the curriculum (Vahey et al., 2006). Based on these findings, we extended the PFL framework to what we call PFL+ (Figure 1; see also Vahey, Rafanan, Swan, van ‘t Hooft, Kratcoski, & Stanford, 2010). In PFL+, student learning spans four disciplines instead of two in a way that augments PFL with transfer activities. In this case, the formal instruction in mathematics is also the beginning of a conventional transfer sequence (see, e.g., Perkins & Salomon, 1994; Schunk, 2004). In the TWD modules, application of the cognitive tools acquired in the mathematics module happens in the science and English language arts modules. In the science module, application takes place in two domains. In the first, students use proportional reasoning tools and an evaluation heuristic to solve problems related to the science underlying water issues in the Tigris/Euphrates watershed. This might be seen as near transfer, as it provides new problems in the same context. In the second, students explore water issues in a new context, watersheds in the United States. This might be seen as far transfer.
In the English language arts module, far transfer continues as students extend and apply what they have learned in the first three modules of the TWD unit to develop persuasive arguments concerning water issues in the United States watersheds they researched in science. They present their arguments in written and oral form. This communication phase adds an important element to the design framework as it requires that students explicitly reflect upon their thinking with data in order to effectively share it with others.
Methods
In order to determine the effectiveness of the TWD materials and their impact on student learning, we investigated three research questions:
What are the differences in middle school student learning gains in cross-disciplinary data literacy between those who engage in the TWD curriculum and those who do not?
What are the differences in middle school student learning gains in individual disciplines (specifically mathematics and science) between those who engage in the TWD curriculum and those who do not?
What is the effect of the PFL+ cycle on student learning of data literacy?
Pilot-Testing the Curriculum
Once an initial version of the TWD unit had been developed, it was pilot-tested with an interdisciplinary team of two female teachers and 42 seventh-grade students (22 male, 20 female; lower-middle/middle class) from a middle school in Northeast Ohio during the 2007-2008 school year. One of the teachers taught language arts and social studies, and the other mathematics and science. Prior to implementation, teachers received three days of professional development at Kent State University by project staff, which included an explanation of the unit content and its underlying PFL+ framework, as well as a hands-on walk-through of all lesson plans. Feedback from this pilot resulted in substantial revisions of the individual modules. In social studies, the first three lessons were completely redesigned in order to begin the module with stories, followed by a transition to the data. In addition, the layout of the data spreadsheets was redesigned to make them more student-friendly, and a self-paced tutorial on graphing tabular data was developed to replace a teacher-led PowerPoint presentation. In mathematics, the use of dedicated data exploration software was tried and abandoned, due to issues of access and a higher-than-expected learning curve among both students and teachers. The science and English language arts modules were revised in tandem; student research on U.S. watersheds that was originally included in the English language arts module was moved to the last two days of the science module to provide the English teacher with enough time to work with students on creating and fine-tuning persuasive essays and oral presentations. Finally, all student and teacher materials were made available online (http://www.rcet.org/twd/).
Participants
Field implementation with seventh graders at two middle schools in Northeast Ohio followed during the fall semester of the 2008-2009 school year. At each school, one four-teacher interdisciplinary team participated, with each teacher implementing one of the four TWD modules. One of the teams was located at the pilot school and included the two teachers who had implemented the original TWD curriculum the year before; this team had been supplemented with two teachers so that each teacher was only responsible for one subject area. Both schools used the same materials. A total of 114 students were taught using the TWD materials, and 462 students from the same two schools formed the comparison group who were taught their regular curriculum; thus, a total of 576 students participated in pre/post testing. Both treatment and comparison groups were made up of lower-middle and middle class students of primarily Caucasian descent (85-90%) and approximately evenly split between males and females (Table 2). Before the curriculum implementation, all teachers received training by project staff that was similar to the pilot phase training, with the primary difference that the training was conducted at each school site. This training provided an overview of the unit and the PFL+ framework, as well as a hands-on walk-through. In addition, teachers were apprised of what had and had not worked during the pilot implementation, and curricular changes that had been made as a result of these findings.
The modules were taught in sequence (social studies, math, science, and English language arts) and as closely together as the school calendar allowed, with a maximum of one school week between the end of one module and the beginning of the next module in the sequence. Project staff provided teacher support as needed by phone, e-mail, or face-to-face for the duration of the implementation. Classroom observations indicated that all teachers implemented the materials at some level of competence. Teachers were able to use most of the expected materials each day, students were engaged during the lessons, there were no major obstacles that prevented completion of key components of the materials, and all teachers completed their modules in the expected time.
Data Sources
Data collected during the TWD implementation included notes from the professional development sessions; lesson plans and related materials from the field implementation; pre/ post data literacy assessments for the overall TWD unit; content assessments for the mathematics and science modules; field notes from classroom observations; student artifacts and reflections on the unit; and teacher and principal interview transcripts that were provided to the project team by an external evaluator. For the purposes of this article, only the following data sources were analyzed to answer the research questions posed:
Pre/post data literacy assessments for the overall TWD unit. The overall data literacy assessment was a problem-based exercise that tested whether students could use appropriate data, data representations, and tools to answer data-based questions and evaluate data-based inferences, explanations, and arguments. It consisted of five questions about a problem situation that required interpretation of data from a table, synthesis of data between tables, manipulation of data to create common measures, interpretation of data presented in a narrative form, and an understanding of what data would be needed to answer questions more completely. The test instrument was designed by researchers on the TWD project staff with input from the TWD advisory board to establish validity of the items. It was administered to both the treatment and control groups at the same time, prior to the social studies module and following the English language arts module.
Content assessments for the mathematics and science modules. The mathematics and science content assessments were designed to assess students’ ability to answer questions more directly related to the content standards covered in these disciplines. They were administered immediately prior to and following their respective modules.
Data Analysis and Results
Learning gains in cross-disciplinary data literacy. To investigate data literacy across the entire unit (research question 1), an analysis of pre/post test data of the data literacy assessment indicated that the treatment and comparison groups were different at the outset, as indicated by a comparison of pretest scores, t(233.514) = 2.870, p < .005. The comparison group scored higher than the treatment group. This difference can be attributed to School 1, where the comparison group scored higher (t(48.767) = 3.225, p < .005), while there were no statistically significant differences in pre-test scores between the treatment and comparison groups in School 2. Given these preintervention differences, gain scores were analyzed to look for differences in improvement between the treatment and comparison groups to accommodate for the existing differences prior to implementation of the TWD curriculum.
On average, students who were exposed to the TWD curriculum (n = 114) had a gain score that was 3 points higher on a 15-point test than comparable students who did not engage with the TWD materials (n = 462). This difference was statistically significant: t(156.273) = 10.750, p < .001, d = 1.24 (very large effect). When comparing treatment and comparison groups, at School 1 the mean difference in gain scores between groups was 3.13, and at School 2 it was 2.27 (see Table 3). Both differences were statistically significant and yielded very large effect sizes (d = 1.27 and 1.00 respectively). These results are encouraging, also when considering that the treatment group scored lower on the pre-test than the comparison group.
Multiple Analysis of Variance (MANOVA) was used to determine gain scores (and related effect sizes) from pre- to posttest for each question individually. For the overall MANOVA, the Box M test yielded F(15, 167,841.2) = 6.172, p < .001, that is, the assumption of equality of variance was violated. Consequently, the MANOVA statistic reported here is for the corrected model: F(5, 570) = 32.92, p < .001, with a partial η2= .308. This indicates that approximately 31% of the difference in total gain scores between the treatment and comparison groups can be explained by the TWD intervention.
When analyzing each question separately, the requirement of homogeneity of variance for each question was violated, so again we used a corrected model for the between-subject tests (Table 4). The F-statistic for each of the tests is statistically significant at p < .001, and the partial η2 statistics indicate that Questions 2 and 4 explain the largest amount of variability in gain scores between the treatment and comparison groups (Question 2 explains 9.5% and Question 4 explains 14.4% of the total 31%).
TWD IMD Pre/Posttest Gain Scores by School
| School | Gain Scores | ||||||
|---|---|---|---|---|---|---|---|
| TWD | No TWD | Gain Score Difference | t | df | p | d | |
| 1 | 3.69 | 0.56 | 3.13 | 10.238 | 371 | .000 | 1.27 |
| 2 | 2.03 | −0.24 | 2.27 | 5.063 | 201 | .000 | 1.00 |
Focusing our analysis on Questions 2 and 4, we note that both of them required higher order thinking skills, including drawing conclusions from data interpreted across multiple tables (Question 2), and calculation of proportional data followed by interpretation of these calculations (Question 4). This provides support for the argument that the TWD materials aid in the development of data literacy skills among middle school students.
The results of this pre/posttest need to be interpreted with caution. There was a substantial size difference between the treatment and comparison groups (n = 144 and 462 students respectively), and homogeneity of variance and covariance were often violated. All of these can open the door to statistical imprecision or error.
Learning gains in disciplinary content. Pre/post testing in mathematics and science showed statistically significant gains in learning disciplinary content (research question 2; see Vahey, Rafanan, Patton, Swan, van ‘t Hooft, Kratcoski, & Stanford, 2012). Students in School 2 showed statistically significant gains across the entire mathematics test, t(24) = 4.899, p < .001, d = .56 (medium effect). Due to inconsistencies in test administration from pre- to posttest, only two items were scored on the mathematics test for School 1; both items showed statistically significant gains (Z = 3.16, p < .001 and Z = 4.70, p < .001 respectively).
In science, students in both schools also showed statistically significant gains, with t(84) = 12.665, p < .001, d = 1.36 (very large effect) for School 1. For School 2 the analysis yielded t(27) = 4.441, p < .001, d = .83 (large effect).
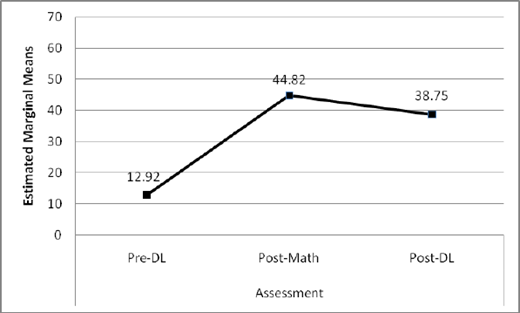
Impact of the PFL+ cycle on student learning of data literacy. In order to gauge the impact of the entire PFL+ cycle on student learning of data literacy (research Question 3), we looked across the whole TWD unit to determine where most of the learning took place: Did learning of data literacy skills happen during social studies and mathematics (the PFL framework), during science and English language arts (our PFL extension), or both (see Figure 1)? Because we had not administered the data-literacy pre/posttest following the mathematics module, we used the mathematics posttest instead, matching items from this assessment to items on the overall data literacy assessment (see Table 5); items were matched by content and skills tested. Scores from both instruments were converted to a common scale in order to conduct a repeated measures analysis. The repeated measures analysis was run using a data sample from School 1 (n = 80), and yielded a statistically significant Pillai’s Trace value of .709 (F = 95.203, p < .000, partial η2 = .709). Posthoc pairwise comparisons showed statistically significant gains from pre-data-literacy (1) to postmathematics assessments (2) and pre-data-literacy (1) to post-data-literacy (3), but a statistically significant decrease from postmathematics (2) to post-data-literacy (3) (see Figure 2 above).
Tests of Between-Subjects Effects for Gain Scores by Question Analysis
| Source | Question | Mean Square | df | F | p | Partial η2 |
|---|---|---|---|---|---|---|
| Corrected Model | 1 | 22.662 | 1 | 23.249 | .000 | .039 |
| 2 | 41.462 | 1 | 60.470 | .000 | .095 | |
| 3 | 25.121 | 1 | 17.727 | .000 | .030 | |
| 4 | 87.787 | 1 | 96.681 | .000 | .144 | |
| 5 | 10.383 | 1 | 29.866 | .000 | .049 |
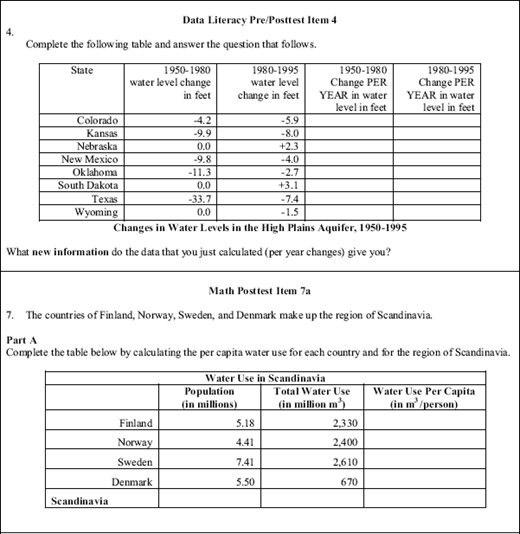
Matching Data-Literacy and Mathematics Assessment Items
| Data Literacy Assessment Item | Math Posttest Item | Content |
|---|---|---|
| 1 | 6 | Evaluate a quantitative argument |
| 4 | 5, 7A | Complete a table by creating a common measure |
| 5 | 3, 9 | Recognize the data needed to create a valid argument |
Similar patterns in the data emerged when analyzing individual items across the assessments. An exception was the pair data literacy 4-mathematics 7a (Figure 3), in which there were increases across the board, although not necessarily statistically significant ones (Figure 4). We can conclude from this analysis, albeit cautiously, that the TWD curriculum using the PFL+ cycle caused gains in data literacy knowledge and skills overall, with the gains occurring in the first half (social studies and mathematics). While we found that scores decreased in the second half, this decrease may be attributed to the fact that items on the data literacy assessment tended to be more difficult than those on the mathematics assessment. We are particularly encouraged by the findings from the data literacy 4-mathematics 7a pair of items, because
the content of these items (proportional reasoning) was the focus of the TWD unit;
out of all of the items paired, the data literacy 4-mathematics 7a pair was the closest match in both content and difficulty level.
Discussion and Conclusions
In this study we investigated the use of an interdisciplinary curriculum to increase the crossdisciplinary data literacy of middle school students. We chose data literacy as the focus of our study for two reasons. First, an understanding of data literacy is vitally important for active participation as informed citizens in today’s society. Second, students of middle school age are developmentally prepared for such a complex topic and need a positive, active, and interdisciplinary learning environment to take full advantage of their learning potential. We developed the curriculum with both middle school students as well as the current organization of middle school in mind. What made our approach unique from others was the use of the Preparation for Future Learning (PFL) framework.
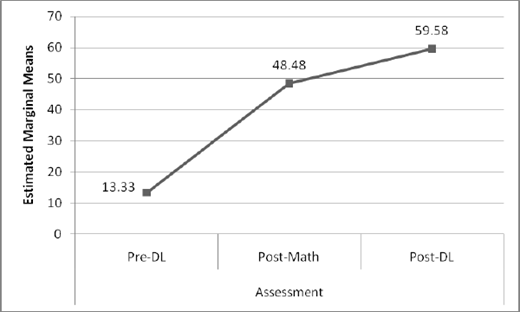
Repeated Measures Analysis Data-Literacy (DL)Mathematics Assessments: Item Pair Data Literacy 4-Math 7a
Repeated Measures Analysis Data-Literacy (DL)Mathematics Assessments: Item Pair Data Literacy 4-Math 7a
We found that middle school students who used the TWD curriculum had higher learning gains in data literacy skills than students who followed the regular curriculum. Second, similar differences were apparent in learning gains in mathematics and science. Third, the data show that most data literacy-based learning gains occurred in the social studies and mathematics modules, while more research needs to be done to determine the learning gains made in the science and English language arts modules.
These findings suggest that projects that use the TWD approach can work well when learning activities are integrated across multiple disciplines. Furthermore, this study provides a theoretically and empirically grounded basis for using the PFL framework as the basis for developing instructional materials that use real-world data to develop middle grades students’ data literacy across the curriculum. The study also yielded a collection of freely available curricular materials and related data sets that can be used by others in the implementation of cross-disciplinary data literacy instruction.
Based on the results from this study, future work will include additional inquiry into the PFL+ cycle and its impact on student learning, with a focus on how teachers use cross-disciplinary links across modules and how studentmade links between the various disciplinary modules can be made more explicitly visible. Increased understanding in these areas will then enable us to adjust the curricular and related professional development materials to stress the importance of the PFL+ cycles and their role in educating middle school students about data literacy in relevant and meaningful ways.
Acknowledgments
The research reported on in this paper was funded by the National Science Foundation under Grant No. NSF ESI-0628122. Any opinions, findings, and conclusions or recommendations expressed in this paper are those of the authors and do not necessarily reflect the views of the National Science Foundation. We would like to thank the teachers, students, and advisory board members who participated in the TWD project, as well as the editor and reviewers of the Middle Grades Research Journal for their thoughtful comments during the review phase.
