


In this article, we examine the effects of a mathematical problem-solving instructional program on the frequency and types of errors made by middle school students with and without learning disabilities (LD). The intervention was randomly assigned at the school level, which resulted in 177 students in the treatment group and 117 students in the comparison group. Seventh- and eighth-grade students completed 2 different 10-item problem-solving assessments, one prior to the intervention, and the second a month later. Using error analysis, we coded 5 typical mathematical errors made by students during problem solving: operation, computation, careless, unidentified, and omission. Independent analysis of each of the 2 time points using ANOVA showed that, prior to the intervention, students who received treatment performed similarly to students who did not receive treatment with regard to total errors made; further, no difference was found on the total number of errors made between low-achieving students and students with LD. Following intervention, students who received the treatment made statistically significantly fewer operation, computation, unidentified, and total errors than students who did not receive the treatment. Also, students with LD who received the treatment made fewer total errors than low-achieving students who received the treatment. Implications of findings for classroom practice and directions for future research are discussed.
Over the last decade, the landscape of the workforce has changed dramatically. Particularly in the fields of science, technology, engineering, and mathematics (STEM), job opportunities are increasing even in a time of economic downturn (National Math and Science Initiative, 2011). However, American students continue to struggle in foundational STEM fields. According to the Trends in International Mathematics and Science Study 2011, for Grade 8, only 7% and 10% of United States students attained the “advanced” benchmark in mathematics and science, respectively, and only 30% and 40%, respectively, attained the “high” benchmark; percentages for leading nations, meanwhile, ranged from 30-50% for the advanced benchmark and 70-80% for the high benchmark. As a result, foundational STEM concepts have been incorporated into middle and high school instruction in the United States. For a better understanding of how STEM concepts have been integrated into the mathematics standards, consider reading the article in this issue titled STEM Integration in Mathematics Standards (Capraro & Nite, this volume). According to Basham and Marino (2013), STEM education reflects interdependence among its fields (i.e., science, technology, engineering, and mathematics). It utilizes a teaching approach that emphasizes inquiry-based learning, which allows students to gain a deeper understanding of contextual-ized problems (Basham, Israel, & Maynard, 2010; Basham & Marino, 2013). While each of the four fields stands alone, mathematics is considered essential to the development of STEM education (National Science Board, 2010). Further, student achievement in high school mathematics courses frequently predicts success in college majors for the other three fields (Atanda, 1999). That is, key mathematical ideas or skills are critical to developing proficiency in science, technology, and engineering. Problem solving represents one such skill.
The National Council of Teachers of Mathematics (NCTM, 2000) defines problem solving as “engaging in a task for which the solution method is not known in advance” (p. 52). Though our study uses routine and close-ended word problems that may not immediately resonate with the NCTM definition provided above, it is important to note that problem solving is a subjective term that applies to a task but reflects the problem solver. In other words, mathematical word problems that may appear to be straightforward and procedural to a proficient problem solver may, for a struggling student, represent NCTM’s conceptualization of problem solving (i.e., “a task for which the solution method is not known in advance”); as the population of interest in the present study was students with and without disabilities who were low-achieving in mathematics as well as their average-achieving peers, we assumed that the problems selected aligned with NCTM’s definition. As the goal of the intervention was to support students with poor problem solving abilities gain the cognitive and metacognitive strategies needed to understand, analyze, and ultimately solve word problems, they are developing skills critical to inquiry-based learning and thus STEM education. Starting in kindergarten, students must demonstrate the ability to build new mathematical knowledge, solve problems in mathematics as well as other contexts, and apply and adapt various problem-solving strategies effectively (NCTM, 2000). The importance of problem solving has been underscored as a critical skill for success in both higher education and the workplace (Hudson & Miller, 2006; NCTM, 2000; Wilson, 1993). Despite the call for an increased focus on the teaching of mathematical problem solving and for reformations in curriculum, American students continue to perform poorly in relation to other developed countries on measures related to problem solving (Vigdor, 2013). There has been a noticeable decline in U.S. middle school mathematics achievement from that of the elementary level (Reys, Reys, Lapan, Holliday, & Wasman, 2003; Xin, 2007). This is a problem because mathematics learning in the middle school years lays the foundation for algebraic and advanced mathematical learning (Xin, 2007), and algebra has long been recognized as the gatekeeper subject that impacts college readiness (Atanda, 1999). There has been an increased emphasis on problem solving in recent years, as it is linked to improved thinking and reasoning and is critical to the ability to solve problems encountered in daily life (Hudson & Miller, 2006; Wilson, 1993).
Mathematical problem solving in the middle school years is particularly important, as it bridges the foundational skills learned in the elementary grades (e.g., conceptual knowledge of the four arithmetic operations in application) with the higher order, multistep problems that integrate problem solving and complex mathematical topics such as calculus and geometry. It is at the middle school level where problems first begin to incorporate difficult concepts such as probability, proportional reasoning, and rational numbers (Jitendra, Star, Rodriquez, Lindell, & Someki, 2011). As problem solving is difficult for students across ability levels but particularly so for students with learning disabilities (LD), a failure to gain proficiency in this skill translates to a cumulative struggle in mathematics overall. Ultimately, this struggle extends to other areas where mathematical proficiency is important, and the trend of students incapable of pursuing a career in STEM fields continues.
The development of students’ mathematical understanding often co-occurs with their production of mathematical errors (Ashlock, 2006). Knowing whether a student has worked a problem correctly or incorrectly does not always provide sufficient information on which to base instruction. To provide instruction that will lead to solid mathematical learning and understanding, teachers need to identify the types of errors produced by students and the reasoning processes that lead to such errors (Bray, 2011). According to Lannin, Arbaugh, Barker, and Townsend (2006), “creating an environment where students can learn from their errors is paramount for supporting their mathematical learning” (p. 186). At a broader level, educators need to identify programs of instruction that are effective in reducing typical errors for students with and without LD (e.g., Spangler, 2011). The purpose of this study is to identify students’ typical errors in the area of mathematical problem solving and to evaluate the impact of the problem-solving intervention on the reduction of different types of errors for students with and without LD.
Analyzing Students’ Errors
According to Ashlock (2006), error patterns emerge when a decision is executed regularly which does not consistently result in a correct solution; students’ decisions are frequently formed when they learn computational procedures in school and are strongest when the incorrect procedure occasionally produces an accurate response. The decision is reinforced, thus leading to continued application. This issue highlights the importance of error analysis, in that when a student applies an incorrect approach that yields a correct answer, both the teacher and the student may believe that an appropriate procedure has been mastered. In reality, this incorrect process is reinforced in the student’s mind by the teacher’s inadvertent approval of the “right” answer, resulting in the student’s continued use of a procedure that works only intermittently. Error analysis prevents both teacher and student misconceptions by expanding the analysis beyond the answer to the whole computational process.
Error Analysis and Remediation. Although error analysis is not a new analytical tool in the field of educational research, in recent years it has received greater attention by utilizing the information gleaned from students’ mistakes to guide remedial instruction (Allsopp et al., 2008; Durkin & Rittle-Johnson, 2012; Gordon, 2011; Riccomini, 2005; Uberti, Mastropieri, & Scruggs, 2004). For example, Spangler (2011) created a comprehensive program for analyzing students’ errors and then applying targeted interventions to remediate misconceptions related to working with fractions. In another recent study, Durkin and Rittle-Johnson (2012) examined whether or not offering “mis-examples” was effective in teaching students the correct method of solving decimal problems. Compared with a control group who only received “correct” examples, students who were exposed to incorrect problems demonstrated a greater depth of understanding of decimals. By providing incorrect examples and explicitly addressing possible errors, students were able to learn correct procedures and key concepts more effectively than simply demonstrating correct examples to students. Similar studies have examined error analysis (and the related intervention) focusing on one of the four arithmetic operations; however, no studies have established a way in which error analysis can be applied to mathematical problem solving. According to the NCTM (2000), problem solving is integral to all learning in mathematics. Analyzing students’ errors on written assessments provides researchers and educators with an understanding of students’ misconceptions when solving mathematical word problems. Further, these typical errors can be used to evaluate the effectiveness and appropriateness of current and future problem-solving interventions. The purpose of the present study is to do just that.
Students With Learning Disabilities
Error analysis can be a powerful tool to help teachers understand their students’ mathematical knowledge and identify where students with disabilities experience unique struggles. Students with LD commonly have deficits in mathematics performance beyond basic skills and computation; higher-order thinking skills such as problem solving are also a major challenge for them (Jitendra, DiPipi, & Perron-Jones, 2002). That is, while it has been documented that students with LD have deficits in the areas of basic facts, number sense, and acquiring concepts, they also consistently struggle in problem solving because of the proficiency necessary in the previously mentioned skills as well as skills particular to mathematical problem solving (Montague & Applegate, 1993). Additionally, they often “lack the necessary domain-specific or general problem-solving knowledge, often do not process information or apply knowledge effectively, experience difficulty selecting and implementing task-appropriate strategies, and lack self-regulation processes” (Montague, 1992, p. 230). This combination of learning struggles experienced by students with disabilities contributes to their exclusion from the STEM fields; only 5% of students with LD ever enter the STEM workforce (Leddy, 2010).
Previous research on students with LD has indicated that they are particularly vulnerable to making systematic errors within mathematics and can benefit greatly from instructional strategies geared towards remediating these specific error patterns (Allsopp et al., 2008; Gorden, 2011; Riccomini, 2005; Uberti et al., 2004). Errors made by students are sometimes more informative for teachers than correct answers (Allsopp et al., 2008). Gorden (2011) recognized that a critical feature of reform-based mathematics is “the importance of conceptual understanding, and analysis of errors can give much insight into that kind of understanding” (p. 39). In a practical application of error analysis, Uberti et al. (2004) conducted an action research study wherein the classroom teacher implemented individualized checklists based on analyses of student errors. Using a personalized “self-monitoring” checklist, students with disabilities who were struggling with multi-digit arithmetic problems were able to perform as well as their average-achieving counterparts. Overall, studies have indicated that students with disabilities benefit from interventions based on error pattern analysis as much if not more than their typically developing peers.
The Problem-Solving Intervention
In 1945, Polya described an overall framework for problem solving in his book How to Solve it: A New Aspect of Mathematical Method. He proposed that mathematical problem solving consists of four phases: (1) understanding the problem, (2) devising a plan, (3) carrying out the plan, and (4) looking back. These four phases are critical in teaching students how to be good problem solvers and are still being used today to teach problem solving to students (Polya, 2004). Researchers who incorporate Polya’s four phases into their problem-solving interventions have found that they improve students’ problem-solving performance (Charles & Lester, 1984; Hensberry & Jacobbe, 2012); however, the phases as stated are often not explicit enough for students who struggle, including those with LD. The mathematical problem solving instructional program used in the present study expands Polya’s four phases, emphasizing cognitive (i.e., the “to do”) and metacognitive (i.e., the “what am I doing/how am I doing it”) strategies (Montague, 2003).
The cognitive and metacognitive instructional routine is designed to teach students with LD how to understand, analyze, solve, and evaluate mathematical word problems by developing the strategies used by effective problem solvers (Montague, Warger, & Morgan, 2000). Previous research over the course of several decades has established the effectiveness of this intervention in improving the problem-solving skills of middle school students both with and without disabilities, specifically with regard to one- and two-step problems of varying syntactic levels (Montague, 1992, 2003, 2008; Montague & Dietz, 2009; Montague, Enders, & Dietz, 2011; Montague, Warger, & Morgan, 2000; Krawec, Huang, Montague, Kressler, & Melia de Alba, 2013). For the purpose of this study, problem solving is defined as solving word problems for which the solution path is not readily obvious. In order to solve these types of problems, students are taught the following seven cognitive processes and associated meanings: Read (for understanding), Paraphrase (your own words), Visualize (a picture or a diagram), Hypothesize (a plan to solve the problem), Estimate (predict the answer), Compute (do the arithmetic), and Check (make sure everything is right). Students are taught the acronym RPV-HECC as a mnemonic device. The students are also taught the metacognitive strategies of self-instruction, self-questioning, and self-monitoring (i.e., say, ask, check). See Figure 1. As students improve at solving word problems, they should eventually internalize the cognitive and metacognitive processes to speed up solution execution and become more accurate and more efficient problem solvers (Montague et al., 2000).
We address the following research questions:
What are students’ typical errors in the area of mathematical problem solving?
What are the effects of the problem-solving intervention on the frequency of mathematical errors made by middle school students?
What are the effects of the problem-solving intervention by students’ ability level on the frequency and types of the mathematical errors made by middle school students?
Method
This research study was completed in the context of a larger study on the effects of the problem-solving intervention, which enlisted four schools in a large school district in the southeast region of the United States. The schools were matched on socioeconomic status (using the percentage of students receiving free or reduced lunch) and school grade (state-assigned based on student performance on the yearly state assessments in reading and mathematics), resulting in two matched pairs, one high-performing and one low-performing. The treatment was randomly assigned to one school from each matched pair. The ethnic composition of the school district was 10% White, 57% Hispanic, 30% Black, and 3% other (e.g., Native American, Asian, etc.). All four schools were middle schools including Grades 6 to 8. Schools 1 (treatment) and 2 (comparison) had a school grade of A, no Title 1 status, and total enrollment of 1,150 and 1,066, respectively. Schools 3 and 4 had Title 1 status, but while School 3 (treatment) had a school grade of D and total enrollment of 140, school 4 (comparison) had a school grade of C, and total enrollment of 523. Each school administrator selected one seventh and one eighth grade general education mathematics teacher for the study. Only teachers who were certified in mathematics education and taught at least three classes including students with LD and low-achieving (LA) students were eligible. Students with LD were identified by the district, which used an IQ-achievement discrepancy of 1.5 standard deviations (a common standard for LD identification; see Fletcher, Stuebing, Morris, & Lyon, 2013), and scored a level 1 or 2 on the previous year’s state mathematics assessment. LA students were those who scored a level 1 or 2 on the previous year’s mathematics assessment and did not have a disability. Average-achieving (AA) students were those who scored a level 3 or 4 on the previous year’s mathematics assessment and did not have a disability. On the state assessment, levels 1 and 2 are below grade level, level 3 is at grade level, level 4 is slightly above grade level, and 5 is substantially above grade level. There were no students in the study who scored a level 5.
 The worksheet titled Solve it in upper case letters from R P V hyphen H E C C presents a 7 step problem solving strategy arranged in 2 columns. At the top, the title Solve it in upper case letters appears in bold uppercase letters, followed by R P V hyphen H E C C in smaller uppercase text. Below this, a blank line labeled name is provided. Each step is enclosed in a rectangular box and numbered from 1 to 7. Step 1 is labeled read for understanding and instructs reading the problem and checking for comprehension. Step 2 is labeled paraphrase your own words and guides rephrasing the problem and identifying key information. Step 3 is labeled visualize a picture or a diagram and suggests creating a visual representation. Step 4 is labeled hypothesize a plan to solve the problem and involves identifying steps and operations using symbols such as plus, minus, multiplication, and division. Step 5 is labeled estimate predict the answer and includes rounding and writing an estimate. Step 6 is labeled compute do the math and compares the result with the estimate. Step 7 is labeled check make sure everything is correct and prompts reviewing all steps and computations. Each step includes a say instruction, ask questions, and a check reminder. The layout uses horizontal lines to separate steps, bold headings for each step, and regular font for supporting text.
The cognitive and metacognitive processes that comprise Montague’s (2003) problem-solving intervention. Copyright by Exceptional Innovations. Permission to reprint this figure is granted.
The worksheet titled Solve it in upper case letters from R P V hyphen H E C C presents a 7 step problem solving strategy arranged in 2 columns. At the top, the title Solve it in upper case letters appears in bold uppercase letters, followed by R P V hyphen H E C C in smaller uppercase text. Below this, a blank line labeled name is provided. Each step is enclosed in a rectangular box and numbered from 1 to 7. Step 1 is labeled read for understanding and instructs reading the problem and checking for comprehension. Step 2 is labeled paraphrase your own words and guides rephrasing the problem and identifying key information. Step 3 is labeled visualize a picture or a diagram and suggests creating a visual representation. Step 4 is labeled hypothesize a plan to solve the problem and involves identifying steps and operations using symbols such as plus, minus, multiplication, and division. Step 5 is labeled estimate predict the answer and includes rounding and writing an estimate. Step 6 is labeled compute do the math and compares the result with the estimate. Step 7 is labeled check make sure everything is correct and prompts reviewing all steps and computations. Each step includes a say instruction, ask questions, and a check reminder. The layout uses horizontal lines to separate steps, bold headings for each step, and regular font for supporting text.The cognitive and metacognitive processes that comprise Montague’s (2003) problem-solving intervention. Copyright by Exceptional Innovations. Permission to reprint this figure is granted.
The intervention was introduced to the students over a 15-day intensive treatment. The students spent the first week memorizing the seven cognitive processes and reciting the metacognitive strategies shown in Figure 1. The students spent the next 2 weeks learning and practicing how to use the strategies to solve mathematical word problems as their classroom teachers modeled the problem-solving process for them (i.e., the RPV-HECC routine to solve mathematical word problems). After the intensive 15-day intervention, students continued to use the problem-solving routine throughout the rest of the school year whenever they encountered mathematical word problems. The instructional program was meant to be a supplement to the standard mathematics curriculum. The comparison students were not introduced to the components of the intervention and received only the instruction their mathematics teachers typically used to teach problem solving, which reflected instruction guided by textbook curricula (i.e., worked examples of the basic four-step problem-solving approach of understand-plan-solve-check). The focus of this paper is on the performance of students with and without LD in treatment and comparison conditions at two different time points throughout the study: at the beginning of the school year prior to intervention, and immediately following the 15 days of intervention.
Participants
Demographic information for the 294 participating students is presented in Table 1 by condition (treatment, comparison). All students were in either seventh or eighth grade. Information on students’ ability level, race/ ethnicity, gender, and socioeconomic status (as measured by free/reduced lunch) was also collected.
Measures
The measures used at the two time points were of similar content; that is, each measure contained 10 items consisting of two one-step, six two-step, and two three-step mathematical word problems using any combination of the four operations. Neither measure used fractions and both measures included five problems with decimals in the context of money. However, while measures were made parallel based on content and structure, they were not statistically equated prior to administration. Though different measures were given across time points, both the treatment and comparison groups received the same measure at each time point. The measures were developed to have comparable content to investigate intervention effectiveness, and the problems on the measures were selected from the intervention manual (Montague, 2003). The following are example problems from one of the measures of a one-, two-, and three-step problem:
One-step: On the day the Winston family arrived at the Olympic Games, there was a total of 426,000 visitors. The day before, there were 414,500 visitors. How many visitors were there at the Olympic Games on those 2 days?
Two-step: Anne and Susan were looking for articles for their science notebook. Anne found 14 articles and Susan found 11. Then, Susan spilled a glass of soda and ruined 6 of the articles. How many articles were left?
Three-step: Three pens and four notebooks cost $5.50. If each pen costs $0.50, how much does each notebook cost?
Student Demographic Data (n = 294)
| Treatment Group (n = 177) | Comparison Group (n = 117) | |
|---|---|---|
| Variable | n (%) | n (%) |
| Ability Level | ||
| Learning Disabled (LD) | 39 (22) | 12 (10) |
| Low Achieving (LA) | 66 (37) | 83 (71) |
| Average Achieving (AA) | 72 (41) | 22 (19) |
| Grade | ||
| Seven | 105 (59) | 81 (69) |
| Eight | 72 (41) | 36 (31) |
| Gender | ||
| Males | 91 (51) | 50 (43) |
| Females | 86 (49) | 67 (57) |
| Race/Ethnicity | ||
| White | 20 (11) | 12 (10) |
| Hispanic | 122 (69) | 35 (30) |
| Black | 31 (18) | 67 (57) |
| Other | 4 (2) | 3 (3) |
| Free/Reduced Lunch | ||
| Yes | 102 (58) | 78 (67) |
| No | 75 (42) | 39 (33) |
Error Analysis Codes
Identifying the Codes. As there was no previous research in error analysis and mathematical problem solving with which to replicate, the first author and a research assistant analyzed every incorrect problem on the student protocols. After discussion, a list of eight codes were identified. From that list, errors were aggregated until a consensus of five unique errors were identified: operation, computation, careless, unidentified, and omission. Beyond the evidence of these codes in data, they were further validated by error analysis codes from some of the literature reviewed. For example, computation errors, careless errors, and omission errors are used in error analyses related to basic computation (e.g., Ashlock, 2006; Clements, 1980; Van-lehn, 1990). Figure 2 provides a definition for each of the five categories of errors and includes an example from student work when appropriate.
Scoring the Protocols. Each problem that was not correct was analyzed using the five categories of errors. It is important to note that if a single problem contained more than one error, all errors associated with that problem were coded; thus, frequency of errors aggregated across the measure’s 10 problems resulted in a maximum potential of 10 in each of the five error categories per student.
Reliability and Validity. Intercoder reliability was initially established (after the codes were identified) by having the first author and a research assistant code five students’ measures at both time points. This coding was discussed until 100% agreement was reached. The process was repeated until over 90% agreement was achieved prior to discussion. All previously scored protocols were returned to the pool; the first author then scored 100% of the data while the research assistant scored 20% (i.e., 60 students) independently, resulting in 87% intercoder agreement. Intercoder agreement was calculated by taking the total agreements divided by the total agreements and disagreements multiplied by 100. Again, the theoretical basis of these codes and the presence of some of the codes in previous error analysis studies focusing on computation established their validity for use in mathematical problem solving.
 The chart contains 4 rectangular sections labeled operation error, computation error, careless error, and omission error. Operation error includes a problem about tony spending 51 dollars and receiving 14 dollars and 39 cents in change, with a subtraction response marked 51 point 27 minus 14 point 39 equals 36 point seventee17. Computation error includes a problem about selling an item for 4 dollars and 23 cents and spending 2 dollars and 77 cents, with a response showing 4 point 23 minus 2 point 77 equals 2 point 46, then adding 1 point 46 to reach 3 point 92. Careless error includes a problem about estimating salad cost with lettuce and tomatoes, with a response showing 3 point 60 plus 1 point 88 equals 5 point 48. Omission error is labeled but contains no student response. Each section includes a brief definition above the problem and response. All content is enclosed within a bordered layout.
Definition of Each of the Five Problem-Solving Error Types With Examples
The chart contains 4 rectangular sections labeled operation error, computation error, careless error, and omission error. Operation error includes a problem about tony spending 51 dollars and receiving 14 dollars and 39 cents in change, with a subtraction response marked 51 point 27 minus 14 point 39 equals 36 point seventee17. Computation error includes a problem about selling an item for 4 dollars and 23 cents and spending 2 dollars and 77 cents, with a response showing 4 point 23 minus 2 point 77 equals 2 point 46, then adding 1 point 46 to reach 3 point 92. Careless error includes a problem about estimating salad cost with lettuce and tomatoes, with a response showing 3 point 60 plus 1 point 88 equals 5 point 48. Omission error is labeled but contains no student response. Each section includes a brief definition above the problem and response. All content is enclosed within a bordered layout.Definition of Each of the Five Problem-Solving Error Types With Examples
Data Analysis
Preliminary Analyses. We conducted a series of chi-square analyses to determine whether there were any statistically significant differences between the treatment and comparison groups on demographic variables. Chi-square analyses showed no statistically significant differences between the two groups’ sample size proportions based on grade, gender, or free/reduced lunch. A statistically significant sample size proportional difference was found in regard to ethnicity for the treatment and comparison groups, specifically for the Hispanic and Black categories; that is, there was a higher percentage of Hispanic students in the treatment group than the comparison group, and there was a higher percentage of Black students in the comparison group than the treatment group. Despite this statistically significant difference, ethnicity differences were not accounted for in the analyses because previous research has shown that Hispanic and Black students perform similarly on tests of mathematics achievement (U.S. Department of Education, 2011).
Analyses of Variance. The dependent variables, namely operation, computation, careless, unidentified, and omission errors, represented a frequency count across the 10 word problems on each measure. In addition to the five types of mathematical errors, we also examined the total errors. Since the condition and ability group sizes differed, we conducted Levene’s test of equality of error variance at each time point for the five mathematical errors and the total errors made; the results were not statistically significant for careless and total errors at both time points, nor were they statistically significant for unidentified error at Time 1. Statistically significant differences detected by Levene’s test increased the likelihood of type I error; thus, to address the unequal group variance for the variables that were flagged by Levene’s test, we set a more stringent alpha level (i.e., _p < .025).
ANOVAs were completed for the five types of mathematical errors and the total errors with two factors (condition and ability) at both time points separately. Post-hoc analyses were conducted for any statistically significant findings with ability, with graphs for any statistically significant interaction. Finally, an ANOVA was completed by condition separately for each ability level.
The ANOVA tested the effects of condition, ability, and the two-way interaction between condition and ability on the dependent variables. When reporting effect size, the following ranges of partial eta-squared were used, as recommended by Kinnear and Gray (2008): small, .01 rp < .06; medium, .06 < < .14; and large, np < .14.
Results
Of the total 294 participants in the study, five participants did not take the measure at Time 1, and 15 did not take the measure at Time 2. The reasons for this missing data include late student and parent consent (in the case of Time 1), multiple absences, withdrawal from class or school, and suspension. All 294 participants took part in at least one of the two time points.
Preintervention
The following table shows the means and standard deviations for the five mathematical errors and total error by condition and ability levels.There were no statistically significant differences between students who received the intervention and students who did not receive the intervention at Time 1 on operation errors 288) = 2.64, p = .106], computation errors 288) = 0.28, p = .599], unidentified errors 288) = 0.81, p = .369], omission errors 288) = 0.71, p = .401], and total errors made [F(1,288) = 0.20, p = .654]. This similar performance was expected since the intervention was not yet given. There were, however, statistically significant differences between ability levels (i.e., LA, AA, LD) evident at Time 1 on operation errors [F(2, 288) = 5.17, p = .006, np = .035 (small effect)], computation errors [F(2, 288) = 4.28, p = .015, npp = .029 (small effect)], unidentified errors [F(2, 288) = 3.93, p = .021, npp = .027 (small effect)], omission errors [F(2, 288) = 5.36,_p = .005, n2p = .036 (small effect)], and total errors made [F(2, 288) = 17.53, p < .001, npp = .110 (medium effect)]. Post-hoc tests were conducted for the statistically significant differences between ability levels and showed that the statistically significant differences existed between AA and LD (-1.00), and LA and LD (-0.68) for operation error; between AA and LA (-0.39), and AA and LD (-0.71) for computation error; between AA and LD (-0.59) for unidentified error; between AA and LA (-0.48) for omission error; and between AA and LA (-1.97), and AA and LD (-2.58) for total error, where AA made the least amount of total errors. There were no statistically significant interaction effects between condition and ability level for total errors made [F(2, 278) = 1.46, _p = .234] or for any of the five errors. We see the same results for the five types of errors (operation, computation, careless, unidentified, and omission) as the results for the total errors for students with LD. That is, there are no differences by treatment condition at pretest but there is a statistically significant difference in treatment condition for omission errors with LA students and for careless errors with AA students.
Means and Standard Deviations for Pretest by Ability Group Status and Condition
| Condition | Ability Level | Operation Error 1 | Computation Error 1 | Careless Error 1 | Unidentified Error 1 | Omission Error 1 | Total Errors 1 |
|---|---|---|---|---|---|---|---|
| Comparison | LA | 1.22 | 1.44 | 1.25 | .85 | .30 | 5.06 |
| (1.265) | (1.245) | (.888) | (1.379) | (.828) | (2.614) | ||
| AA | .76 | 1.05 | 1.24 | .43 | .00 | 3.48 | |
| (.625) | (.921) | (1.261) | (.870) | (.000) | (1.887) | ||
| LD | 1.83 | 1.83 | 1.00 | 1.58 | .42 | 6.67 | |
| (1.801) | (1.403) | (1.044) | (2.021) | (.793) | (3.172) | ||
| Treatment | LA | 1.62 | 1.35 | .91 | .88 | .89 | 5.65 |
| (2.066) | (1.342) | (.956) | (1.593) | (2.106) | (2.737) | ||
| AA | 1.17 | 1.00 | .54 | .51 | .11 | 3.32 | |
| (1.195) | (.926) | (.734) | (1.054) | (.361) | (2.189) | ||
| LD | 2.16 | 1.68 | .82 | .92 | .13 | 5.71 | |
| (1.952) | (1.646) | (.834) | (1.566) | (.343) | (3.084) |
Postintervention
Table 3 shows the means and standard deviations for the five mathematical errors and total error by condition and ability levels. An analysis of variance was done for the five mathematical errors and total errors to see if there were any differences between the treatment and comparison groups. The results show that there were statistically significant differences between groups for the frequency of operation errors 278) = 11.11, p = .001, n2 = .039 (small effect)], computation errors 278) = 21.58, p < .001, np = .073 (medium effect)], unidentified errors 278) = 5.39, p = .021, n| = .019 (small effect)], and total errors 278) = 30.68, p < .001, r 2p = .101 (medium effect)]. There were also statistically significant differences among ability levels (i.e., LA, AA, LD) at Time 2 on operation errors [F(2, 278) = 9.12, p < .001, np = .063 (medium effect)], unidentified errors [F(2, 278) = 4.26, p = .015, r|2 = .030 (small effect)], and total errors made [F(2, 278) = 17.22, p < .001, r\p = .112 (medium effect)]. Post-hoc tests were conducted for the statistically significant differences between ability levels and, unsurprisingly, results showed that statistically significant differences in operation errors existed between AA and LA students (—1.10) and between AA and LD students (-1.69). Statistically significant differences were also found for unidentified errors between AA and LA students (—0.60), and for total errors between AA and LA (—2.95) as well as AA and LD students (—2.46), where AA students made fewer total errors. The interaction between condition and ability level was statistically significant for total errors: [F(2, 278) = 5.58, p = .004, r|2 = .039 (small effect)] (see Figure 3). Even though students in the treatment group produced statistically significantly fewer total errors than students in the comparison group, for students with LD the reduction of total errors was much greater in the treatment group than it was for LA students in the treatment group.
Means and Standard Deviations for Posttest by Ability Group Status and Condition
| Condition | Ability Level | Operation Error 2 | Computation Error 2 | Careless Error 2 | Unidentified Error 2 | Omission Error 2 | Total Errors 2 |
|---|---|---|---|---|---|---|---|
| Comparison | LA | 2.72 | 1.64 | 1.06 | 1.29 | 1.14 | 7.86 |
| (2.113) | (1.386) | (.972) | (1.774) | (1.430) | (2.681) | ||
| AA | 2.35 | 1.29 | 1.12 | .59 | .88 | 6.24 | |
| (1.367) | (1.448) | (.928) | (1.372) | (1.219) | (2.773) | ||
| LD | 4.58 | 2.17 | .67 | 2.08 | .58 | 10.08 | |
| (3.450) | (2.038) | (.651) | (2.968) | (.996) | (3.554) | ||
| Treatment | LA | 2.49 | .97 | 1.00 | .92 | 1.71 | 7.09 |
| (2.230) | (1.075) | (1.000) | (1.429) | (2.590) | (2.448) | ||
| AA | 1.30 | .59 | .88 | .51 | .86 | 4.14 | |
| (1.264) | (.960) | (.850) | (.901) | (2.109) | (2.691) | ||
| LD | 2.76 | .92 | .63 | .87 | .87 | 6.05 | |
| (2.223) | (1.124) | (.819) | (1.742) | (1.339) | (2.885) |
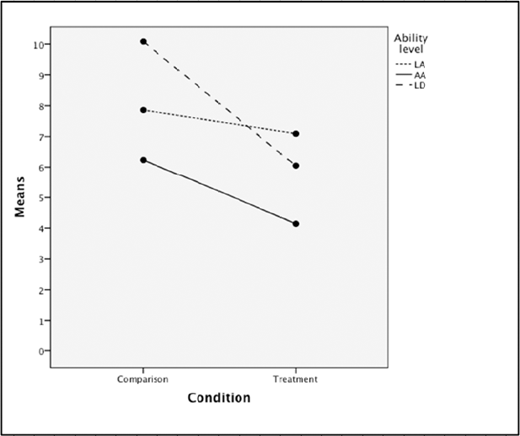
Average-achieving students in the treatment group did better (i.e., had statistically significantly fewer errors) than average-achieving students in the comparison group for operation error (p = .003), computation error (p = .018), and total error (p = .005). We see that students with LD in the treatment group made statistically significantly fewer computation errors (p = .009) and total errors (p < .001) than students with LD in the comparison group. Interestingly, there were no differences between low-achieving students in the treatment and comparison groups for total errors or for any of the five types of errors except computation error (p = .002).
Discussion
The purpose of the present study was to identify students’ typical errors in the area of mathematical problem solving and to determine the effects of a problem-solving intervention by ability level on the frequency and type of errors produced during problem solving. Overall, the results reflect the authors’ expectations: first, students in the treatment group made fewer overall errors than students in the comparison group, though each group produced the same number of errors prior to intervention; and second, AA students outperformed (i.e., produced fewer errors than) their LA peers with and without disabilities. It is also promising that, following treatment, students with LD in the treatment group made fewer errors than all students in the comparison condition, including their AA peers. However, the results of this study highlight two issues that warrant further attention.
Nonresponsiveness of Low-Achieving Students. There was a statistically significant interaction between ability and condition on total errors made; that is, though AA students and students with LD in the treatment group outperformed their respective comparison group counterparts, LA student scores on the posttest showed no statistically significant difference between conditions on total errors and four of the five types of errors (operation, careless, unidentified, and omission). This finding corroborates previous descriptive research (e.g., Krawec, 2014) as well as the important work of Brownell, Mellard, and Deshler (1993), which highlighted “difficulties in learning as the result of specific learning disabilities [as opposed to the] more general learning problems” of LA students (p. 155). The present findings illustrate the need for additional research into the differences in learning profiles for LA students and students with LD as related to mathematical problem solving.
Lack of Impact on Omission or Careless Errors. The findings related to specific errors showed that the problem-solving intervention may effectively remediate student errors related to the selection and utilization of the appropriate operation for average-achieving students, and increase accurate computational procedures for average-achieving students, low-achieving students, and students with LD. The problem-solving program also appeared to help students in the treatment group make statistically significantly fewer unidentified errors than students in the comparison group; that is, students who received the intervention were less likely to write an incorrect response without an indication of process. However, the intervention did not appear to effectively remediate omission or careless errors, where students failed to answer the question, or answered in the wrong form, provided incomplete answers, copied the information from the question incorrectly, et cetera. We anticipated that the number of careless errors would be reduced following treatment because the intervention includes a specific metacognitive component that prompts students to monitor their work (e.g., Did I use all the important numbers? Did I include the unit? Are the decimals or money signs in the right places?); however, results suggest that this component failed to prevent or correct these errors. It is possible that the difficulties experienced by students with LD may have confounded the effects of the intervention; previous research has indicated that students with LD often experience issues with inadequate prerequisite skills, poor working memory or low motivation (Ashcraft, Krause, & Hopko, 2007). Further research in this area would be useful to determine what students with LD struggled with these errors. Though the intervention did not effectively reduce omission and careless errors, it did reduce the operation, computation, and unidentified errors students made.
Overall, the results of this study support previous research establishing the effectiveness of the intervention on decreasing the number of overall errors made by middle school students on a selection of mathematical word problems (e.g., Krawec et al., 2013; Montague, 1992, 2008). The findings also support error analysis of written mathematical problem-solving tasks as an important and valuable method of evaluation for students with and without LD. The importance of problem-solving skills is underscored by NCTM (2000) and has been defined as an integral component of mathematics education. According to Wilson (1993), problem solving is an important component of mathematics that provides students with intrinsic motivation to solve real-world applied problems. Error analysis may provide teachers with a practical means of facilitating a deeper conceptual understanding of mathematics, paramount in becoming an effective problem solver (Bray, 2011; Lannin, Arbaugh, Barker, & Townsend, 2006; Spangler, 2011). Even though there are acknowledged criticisms of conducting an error analysis based solely on written mathematical tasks (Hollander, 1978), it is evident from this research that considerable information may still be garnered from written work alone, and conducting an error analysis based on written work can still improve teachers’ instructional knowledge of students’ thinking and learning and provide information on remediating students’ misconceptions about problem solving. The findings of the present study suggest that the problem-solving intervention was effective in remediating student errors related to computation, operation, and unidentified factors.
Limitations
Though the findings of this study support the use of error analysis to highlight specific errors students exhibit in a complex task and also corroborate previous successful findings on the problem-solving intervention (e.g., Montague, 2003; Montague & Dietz, 2009; Montague et al., 2011; Krawec et al., 2013), there are two limitations that must be noted. One limitation of this paper is that different measures (i.e., different problems) were used at each time point; hence, an analysis of the students’ mathematical errors before and after the intervention was not possible. Instead we examined each time point independently and focused on the cohort and ability level differences demonstrated in each group. Second, only one source (i.e., students’ written work) was used to identify and interpret errors. Corroborating our interpretations through interviews with participating students would have strengthened findings. Further, it may have clarified unexplained errors and perhaps revealed additional error types.
Implications
Based on the findings of the present study, it is clear that this intervention was effective in reducing the errors (and thus improving the performance) in mathematical problem solving of students of varying ability. Compared to typical classroom instruction on mathematical problem solving, students taught using the intervention reduced errors related to the selection of an operation that cannot lead to the correct solution, the inaccurate use of an effective arithmetic procedure or strategy, and a wrong answer with no solution or justification. When such an intervention is identified that can improve student performance on a key area of mathematics (i.e., problem solving), then it is critical that curricular/instructional changes be made. Along with strong number-sense skills and estimation ability, problem solving transcends the mathematics domain and is a requisite skill for other fields (i.e., STEM). It follows to reason, then, that lack of proficiency in a skill such as problem solving essentially blocks the pipeline to STEM careers; with the national push for increased participation of students in these jobs, we as educators must address the building blocks that make a STEM future an actual possibility for students. Problem solving is one such building block, and the intervention described in this study is an effective starting point.
Future Research
The importance of increasing overall mathematics achievement of students and providing effective methods of teaching problem solving skills cannot be overstated (Vigdor, 2013). Given the current state of affairs for students with and without disabilities in higher education and the lack of students pursuing careers in STEM fields, methods for increasing the understanding of mathematics in context need to be brought to the forefront of educational research (NCTM, 2000). Future research should focus on the development of a more detailed coding rubric of the types of computation errors that middle school students make while problem solving allowing practitioners to target their instructional strategies effectively. Further, it would be worthwhile to conduct an analysis of other types of interventions that reduce these errors. Most students have an idea or conception of how to solve mathematical problems; however, these ideas or concepts are often flawed. Describing and reducing the frequency and types of mathematical errors that students make is important for increasing student achievement (e.g., Bray, 2011; Clements, 1980; Lannin, et al., 2006; Riccomini, 2005; Spangler, 2011). Additionally, the findings of this study highlight the need to research why students who receive comprehensive problem-solving instruction fail to reduce the number of careless and omission errors. Finally, it is worth noting that several of the previous research studies cited that supported the effectiveness of error analysis have been small in scale and have included some form of student interviews (Bray, 2011; Lannin et al., 2006). The use of such interviews may then shed more light on exactly what is happening during the production of unidentified and omission errors.
Acknowledgment: The authors are grateful to Dr. Marjorie Montague for allowing us to use data from the first year of her Solve It! Intervention Project and for her support.

