


The study aims to test the applicability of a variant of the model proposed by Hockerts (2017) for assessing the social entrepreneurial intention (SEI) of male and female students. It extends the model by incorporating the university's environment and support system (ESS) as an additional more distal construct. The university's ESS, coupled with the experience with social, cultural and environmental issues can affect SEI by influencing the more proximal precursors of empathy towards others, perceived self-efficacy, perceived community support and social, cultural and environmental responsibility.
A structured non-disguised questionnaire was administered to students at a Canadian university. A sample of 485 usable responses was analysed by means of second-order structural equation modelling.
The results provide confirmation that the proposed model is a multi-group invariant and appropriate for analysing the SEI of male and female students. They also show that the university's ESS helps predict SEI indirectly through the complete mediation of the more proximal antecedents.
The questionnaire is limited to universities with social innovation and entrepreneurship initiatives.
Outcomes of the study can help universities assess the efficacy of their social innovation and entrepreneurship initiatives for instilling a social entrepreneurial mind-set in students. Consequently, universities will be better equipped to raise the perceptions of venture feasibility and desirability, thus increasing students' perceptions of opportunity.
The study advances the social entrepreneurial knowledge of the university's effect on the precursors of SEI.
Introduction
Social entrepreneurs play an important role in the economic and social developments of the communities in which they operate (Mair and Noboa, 2006). They are a special type of entrepreneur, driven by a variety of motives, including the alleviation of poverty, hunger or illiteracy; the improvement of human health; the reparation of social, legal or economic injustice; and the preservation of the environment for future generations (Vidal, 2005; Austin et al., 2006). Despite their varied motivations, the one common denominator among all social entrepreneurs is the utilisation of limited resources in new and creative ways to generate social value, as opposed to the maximisation of personal and shareholder wealth (Zadek and Thake, 1997). Social entrepreneurs are also different from philanthropists, in that they do not use their excess wealth to support worthy causes by sponsoring their favourite not-for-profit organisations, but rather mobilise the scarce resources necessary to address a problem that both the free market and government failed to solve (Khanin, 2011). As the term can have different meanings for different people (Dees, 1998; Zahra et al., 2009), the study defines a social entrepreneur as a person who recognises an opportunity, demonstrates creativity and assumes risk to pursue a social mission. Given the relevance of social entrepreneurs in today's society, many educational institutions are starting to encourage more students to participate in social entrepreneurial initiatives, i.e. engage in social entrepreneurial behaviour (Miller et al., 2012; Hockerts, 2015).
Consistent with the provincial government's efforts to support social enterprises as a means to increase the social and economic viability of communities in the province, a Canadian university has been investing in developing the resources to promote social innovation in the province. For example: it created a Centre for Social Enterprise to nurture social entrepreneurs, strengthen social enterprises and drive social innovation in the province, and its Faculty of Business Administration launched a Master of Business Administration in Social Enterprise and Entrepreneurship to train the next generation of business leaders who are committed to sustainable and social business practices. Consequently, there is a need for systematic approaches to evaluate the impact of these and other initiatives at the student level. The study argues that universities can play a key role in the social entrepreneurial intention (SEI) of students by providing support mechanisms to help them in translating their ideas into viable business models that may further expand into successful social ventures. The outcomes of the study can help universities assess the efficacy of their social innovation and entrepreneurship initiatives for instilling a social entrepreneurial mind-set in students.
The study aims at understanding the influence of the university's environment and support system (ESS) in shaping the SEI of male and female students, i.e. their intent to become a social entrepreneur. The study fills a gap in the literature by identifying the various motivational factors related to the university's entrepreneurial ecosystem that could shape the SEI of students. That is, the situational and contextual elements that may affect the intent of students to become socially and environmentally responsible entrepreneurs. The study proposes a methodology grounded in theory that can help universities design their educational and other interventions aimed at encouraging more students to consider social entrepreneurship as a viable career choice after graduation (Smith et al., 2010; Miller et al., 2012). More specifically, based on the works by Hockerts (2017) and Mair and Noboa (2006), the study tries to understand the differences in the influence of the university's ESS on the precursors of the SEI of male and female students. Although males are more likely to start social enterprises than females in general, the male/female ratio of social entrepreneurship is not as pronounced as in commercial entrepreneurship and it can vary tremendously across countries (Terjesen et al., 2016).
By understanding their social entrepreneurial efficacy, universities will be better equipped to raise the perceptions of venture feasibility and desirability, thus increasing students' perceptions of opportunity. The remainder of the paper consists of five sections: Section 1 – conceptual model and proposed hypotheses, Section 2 – methodological design, Section 3 – data analysis, Section 4 – discussion and Section 5 – conclusion.
Conceptual model and proposed hypotheses
The study follows a cognitive approach (Baron, 2004) by applying a customised SEI model based on the one proposed by Hockerts (2017). Hockerts (2017) based his model on Ajzen's (1991) theory of planned behaviour (TPB) as proposed by Mair and Noboa (2006). According to the original TPB, to understand behaviour (e.g. starting a new social venture), it is essential to understand intention. In turn, to understand intention, it is necessary to understand the precursors (antecedents) of intention, i.e. attitude towards behaviour (ATB), subjective social norm (SSN) and perceived behavioural control (PBC). The TPB predicts that the more favourable the ATB and SSN, and the greater the PBC, the stronger the person's intention to perform the behaviour (Kolvereid, 1996). Drawing from the TPB, Mair and Noboa (2006) adapted the model of entrepreneurial intention proposed by Krueger and Carsrud (1993) and Krueger et al. (2000) and translated it to the context of social entrepreneurship. They proposed that, similar to a commercial entrepreneur, social entrepreneurs develop their intention to start a social enterprise after experiencing the perception of feasibility (PBC) and desirability (ATB) and a propensity to act (Shapero and Sokol, 1982). In their model of SEI, Mair and Noboa (2006) replaced the three antecedents of intention (ATB, SSN, PBC), with four equivalent precursors of intention: empathy with marginalised people, feeling of moral obligation, ability to effect change and perceived availability of support. Hockerts (2015) developed and validated measures of four of the constructs identified by Mair and Noboa (2006) as antecedents of SEI. He redefined the antecedents as empathy with marginalised people, a feeling of moral obligation to help marginalised people, a high level of self-efficacy concerning the ability to effect social change and perceived availability of social support. Hockerts (2015) was able to demonstrate nomological validity by showing that, as specified by Mair and Noboa (2006), empathy and moral obligation are positively associated with perceived desirability and self-efficacy, and social support with perceived feasibility of starting a social venture. More recently, Hockerts (2017) refined his previous work and included prior experience with social problems as an additional variable. Hockerts' (2017) model has been the subject of reliability and validity analyses and applicability and tested in educational and other settings by its original author.
There is growing evidence in the literature that contextual and situational factors, e.g. the university's ESS, affect entrepreneurial intention by influencing the precursors of intention such as ATB and PBC (e.g. Krueger and Carsrud, 1993; Boyd and Vozikis, 1994). Situational variables typically have an indirect influence on intention by influencing key attitudes and general motivation to behave (Krueger et al., 2000). Trivedi (2016) has identified three motivational factors of the university's ESS that might influence the precursors of entrepreneurial intention. He suggested that targeted cognitive and non-cognitive supports, and, to a lesser extent, the general educational support, seem to have a positive correlation with the precursors of entrepreneurial intention. In addition to entrepreneurship education, many aspiring entrepreneurial universities provide additional support mechanisms such as intellectual property protection, technology transfer, business start-up coaching and business incubation services that are necessary for entrepreneurial activity (e.g. Tijssen, 2006; Audretsch, 2014). Bazan et al. (2019) have successfully applied a variant of Trivedi's (2016) entrepreneurial intention model to understand the influence of the university's ESS on the precursors of the entrepreneurial intention of students. Following a similar rationale, the study posits that contextual and situational factors such as the university's ESS will also affect the SEI of male and female students. Thus, the study proposes the model of SEI depicted in Figure 1. This model specifies and describes the governing rules and measurement properties of the observed variables.
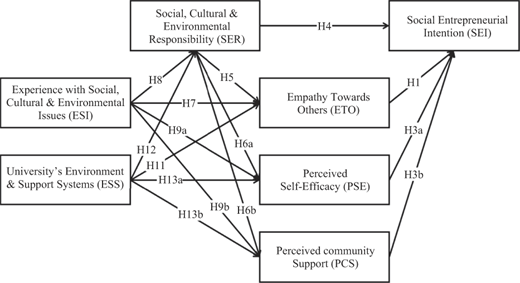
In Figure 1, empathy towards others (ETO) is a proxy for ATB of the TPB. In the TPB, ATB refers to the degree to which the person has a favourable (or unfavourable) assessment of the behaviour (desirability). Empathy has been extensively studied in the context of helping behaviour (Oswald, 1996; Borman et al., 2001). Empathy is an essential trait of social entrepreneurs (Dees, 2012) and, similar to ATB, it has been regarded as an important antecedent of SEI (Mair and Noboa, 2006; Dees, 2012). ETO as a precursor of SEI is based on the premise that desirability will develop after a person is able to imagine the feelings or mental state of another person in need of compassion (Mehrabian and Epstein, 1972; Preston et al., 2007). It is also based on the premise that individuals with high levels of empathy are more likely to develop intentions to become social entrepreneurs as a way to assist others in need (Bacq and Alt, 2018). In the work of Hockerts (2017), ETO includes both cognitive empathy (conscious drive to recognise and understand another person's emotional state) and emotional empathy (subjective state resulting from emotional contagion) or the ability to recognise and react to another person's emotional state. Thus, the study formulates the following hypothesis:
ETO positively influences SEI.
Perceived self-efficacy (PSE) and perceived community support (PCS) are proxies for PBC of the TPB, i.e. internal and external loci of control. PBC refers to the overall perceived level of ease (or difficulty) of performing the behaviour (feasibility). Ajzen (2002) argued that there is clear and consistent evidence for distinguishing between internal PBC (PSE) and external PBC (PCS). He also argued that there is sufficient commonality between self-efficacy (PSE) and controllability (PCS) to suggest a two-level hierarchical model for PBC. Thus, in Ajzen's (1991) TPB, PBC is the overarching, superordinate construct that is comprised of two lower-level components: PSE and PCS. Drawing from Ajzen's (2002) rationale, Mair and Noboa (2006) and Hockerts (2017) used PSE and PCS as proxies for PBC of the TPB. Self-efficacy is widely considered to be a key antecedent of entrepreneurial intention (Boyd and Vozikis, 1994; Bullough et al., 2014). Self-efficacy allows a person to perceive the creation of a (social) venture as a viable behaviour (Piperopoulos and Dimov, 2015; Ip et al., 2018). Community support refers to the relationship that social entrepreneurs build with like-minded stakeholders in pursuit of the mission, e.g. social capital (Estrin et al., 2013; Chan, 2016). Strong PSE and PCS regarding starting a new social business will generally lead to a strong intention to perform the behaviour. Thus, the study formulates the following hypotheses:
PBC is composed of two basic elements: PSE and PCS.
PBC positively influences SEI.
Social, cultural and environmental responsibility (SER) is a proxy for SSN of the TPB. SSN refers to the perceived social pressure to perform (or not to perform) the behaviour (compliance). The results in the literature have shown that SSN exerts a strong influence on both ATP and PBC (Autio et al., 2001; Souitaris et al., 2007). Personal moral values and standards have been identified as essential attributes of social entrepreneurs (Bornstein, 2005; Yiu et al., 2014). Perceived moral beliefs have been found to be important factors of a person's behaviour (Kaiser, 2006; Rivis et al., 2009). Therefore, social entrepreneurs often behave based on their sense of moral values. Mair and Noboa (2006) call this construct moral judgement and interpret this sentiment through the lens of ethical principles that appeal to justice, human equality and respect for the dignity of the individual (Kohlberg, 1971). On the other hand, Hockerts (2017) calls his construct moral obligation and argues that moral obligation can better measure the extent to which moral judgement will lead to moral intent. That is, moral judgement is a precursor of moral obligation, which in turn is a precursor of moral intent (Haines et al., 2008). Today, millennials make up the vast majority of the university student population and are the most concerned generation when it comes to environmental sustainability and social issues. Therefore, the study agrees with Hockerts' (2017) rationale and extends the concept to encompass all sentiments of responsibility and stewardship towards social, cultural and environmental issues. Thus, the study formulates the following hypotheses:
SER positively influences SEI.
SER positively influences ETO.
SER positively influences PBC.
Experience with social issues was identified by Hockerts (2017) as a predictor of SEI. He argued that past experience such as family exposure (Carr and Sequeira, 2007; Chlosta et al., 2012) and work experience (Kautonen et al., 2010) have been already identified as one of the predictors of entrepreneurial intention. By the same token, prior experience such as participation in recycle programmes or community service and knowledge of social issues have been recognised as predictors of prosocial behaviour – which is always preceded by prosocial intention (Vining and Ebreo, 1989; Ernst, 2011). The study adopted the more general construct experience with social, cultural, and environmental issues (ESI) as an indirect (distal) antecedent of SEI by affecting the more direct (proximal) precursors ETO, PSE, PCS and SER, which together act as mediators between ESI and SEI. Thus, the study formulates the following hypotheses:
ESI positively influences ETO.
ESI positively influences SER.
ESI positively influences PBC.
ESI positively influences SEI through the mediated effect of ETO, SER and PBC.
The study focuses on the influence of the university's ESS on ETO, PSE, PCS and SER, and ultimately on SEI. The university's ESS corresponds to contextual conditions – exogenous influences or more distal factors – that could affect, similar to ESI, the SEI of students indirectly via their influences on more proximal, motivational factors (Fishbein and Ajzen, 2010). There is growing evidence that the university context has some influence on the entrepreneurial intention of students (e.g. Bae et al., 2014; Shirokova et al., 2016). The traditional way in which universities may affect the SEI of students is through the offering of social entrepreneurship education programmes. The impact of social entrepreneurship education programmes on the precursors of SEI of students has been the subject of several studies in the past (e.g. Kwong et al., 2012; Smith and Woodworth, 2012). The investigation of other aspects of the university's ESS is less common in the literature to date. It is clear that the elements of the university's ESS are efficient ways of developing social entrepreneurial competencies of students and motivating them to consider a social entrepreneurial career (e.g. Henderson and Robertson, 1999; Kraaijenbrink et al., 2010). Furthermore, similar to Trivedi's (2016) argument, the study posits that the university's ESS is composed of three basic elements: entrepreneurial training (ET), start-up support (SS) and entrepreneurial milieu (EM). Thus, the study formulates the following hypotheses:
The university's ESS is composed of three basic elements: ET, SS and EM.
The university's ESS positively influences ETO.
The university's ESS positively influences SER.
The university's ESS positively influences PBC.
The university's ESS positively influences SEI through the mediated effect of ETO, SER and PBC.
Many researchers have studied gender differences in (commercial) entrepreneurial intention by analysing the influence of several intrinsic and extrinsic factors on the antecedents of entrepreneurial intention (Dabic et al., 2012; Bagheri and Lope Pihie, 2014; Arshad et al., 2016; Arora and Jain, 2019). The vast majority of these studies have determined that there exists a difference between the entrepreneurial intentions of males and females. Based on previous results in the literature, the study anticipates that the SEIs of male and female students will also differ. Thus, the study formulates the following hypothesis:
There will be noticeable difference between the SEIs of male and female students.
Table I summarises the hypothesised connections among the constructs of the model. The arrows represent a direct, positive influence of one variable on another variable. To test the formulated hypotheses, the study uses second-order structural equation modelling (SEM).
Hypotheses of the study
| Hypothesis | Influence |
|---|---|
| H1: ETO positively influences SEI | ETO → SEI |
| H2: PBC is composed of PSE and PCS | |
| H3 (H3a and H3b): PSE and PCS positively influence SEI | PBC → SEI |
| H4: SER positively influences SEI | SER → SEI |
| H5: SER positively influences ETO | SER → ETO |
| H6 (H6a and H6b): SER positively influences PBC | SER → PBC |
| H7: ESI positively influences ETO | ESI → ETO |
| H8: ESI positively influences SER | ESI → SER |
| H9 (H9a and H9b): ESI positively influences PBC | ESI → PBC |
| H9c: ETO, PBS and SER mediate the influence of ESI on SEI | |
| H10: ESS is composed of ET, SS and EM | |
| H11: ESS positively influences ETO | ESS → ETO |
| H12: ESS positively influences SER | ESS → SER |
| H13 (H13a and (H13b): ESS positively influences PBC | ESS → PBC |
| H13c: ETO, PBS and SER mediate the influence of ESS on SEI | |
| H14: SEI will be different for male and female students |
Methodological design
To collect the data, the study designed a structured non-disguised questionnaire shown in the Appendix. The questionnaire uses validated scale items used in previous studies to measure the constructs, i.e. ETO, PSE, PCS, SER, ESI, SEI (Hockerts, 2015, 2017) and ESS (Trivedi, 2016, 2017; Bazan et al., 2019). A panel of experts in social enterprise and entrepreneurship reviewed the scale items in the questionnaire and adapted them to the local context. Before administering the survey, the Interdisciplinary Committee on Ethics in Human Research reviewed the study proposal and found that it complied with the university's ethics policy. Prior to administering the survey to the target population, the questionnaire was administered to a random sample of 20 students to check for precision of vocabulary, ease of completion and possible ambiguity (Trivedi, 2016; Zollo et al., 2017). The convenience sampling method was used to collect the data from undergraduate and graduate students (there were 17,403 students enrolled in the university for the 2018–2019 academic year). The sample size was based on requirements for analysing the predictive model using SEM. As higher level of power for the study may be gained by increasing the number of responses, the study chose to use the recommendations by Krejcie and Morgan (1970) and set the target for the sample population to 380 students. To administer the survey, a cover letter was attached to every questionnaire explaining the purpose of the study, the confidentiality agreement and instructions for completing the questionnaire. The items in the questionnaire were measured using a Likert scale from “1” (total disagreement) to “7” (total agreement). Incentives were provided for students who completed the survey. The software package SPSS 25 and AMOS 25 was used to analyse the data.
Data analysis
The data for the study were collected during the months of March and April of 2019. The survey collected 587 responses with an average completion rate of 90.3 per cent. The study first performed a thorough screening of the data to detect the following. Missing data: 64 rows were deleted for missing more than 5 percent of entries. Unengaged respondents: 13 rows were deleted based on pattern of responses and time to completion. Data imputation: given that the Little's Missing Completely at Random (MCAR) test failed to reject the null hypothesis that the values were missing completely at random, 17 rows were imputed using the expectation maximisation (EM) algorithm for each category of measurement variables, separately. Data normality: a few variables showed skewness and kurtosis slightly larger than the prescribed threshold of ±2. This was somewhat expected, given the wording of some of the scale items, e.g. “Everybody needs to protect the environment for future generations”. Thus, the study used bootstrapping with 1,000 samples and 95 per cent bias-corrected confidence level to calculate standard errors (Bollen and Stine, 2006; Preacher and Hayes, 2008) and compared them to the standard errors obtained through the maximum likelihood (ML) approach. Influential outliers: based on the Mahalanobis with a chi-square distribution, 25 rows were deleted from the dataset (Aguinis et al., 2013). Table II shows the demographics of the final dataset. The dataset is composed of 485 rows corresponding to 243 males, 228 females and 14 who declined to state their gender.
Demographics of the sample
| Gender | Male | Female | N/A |
|---|---|---|---|
| Study | 50% | 47% | 3% |
| University as a whole | 43% | 57% | |
| Programme of study | Undergraduate | Graduate | N/A |
| Level of study | 67% | 31% | 2% |
| University as a whole | 78% | 22% | |
| Residence | Canada | Overseas | N/A |
| Permanent residence | 60% | 39% | 1% |
| University as a whole | 85% | 15% | |
| Number of programmes in the sample | 69 | ||
| Number of programmes in the university | 121 | ||
| Average years in their programme | 2.50 years | ||
| Average age of sample | 24 years |
Second-order model
The study used second-order confirmatory factor analysis (CFA) to test for H2 and H10. The second-order models in Figure 2 represent the assumptions that the common underlying higher-order constructs ESS and PBC can account for their seemingly distinct but related constructs. Second-order CFA was used to discern whether the university's ESS has three different dimensions (sub-constructs) and whether PBC has two different dimensions. The overall fit of the CFA model is very good by the following fit parameters (FP) and their thresholds: chi-square, p-value < 0.05; RMSEA (root mean square error of approximation) (LO 90, HI 90) < 0.05 good, 0.05–0.10 moderate, >0.10 bad; GFI (goodness of fit index) > 0.95 great, >0.90 good; AGFI (adjusted goodness of fit index) > 0.90 great, >0.80 good; CFI (comparative fit index) > 0.95 great, >0.90 traditional, 0.80 permissible; TLI (Tucker–Lewis index) > 0.90; IFI (incremental fit index) > 0.90; chi-square/df < 3 good, <5 permissible and PNFI (parsimonious normed fit index) > 0.50.
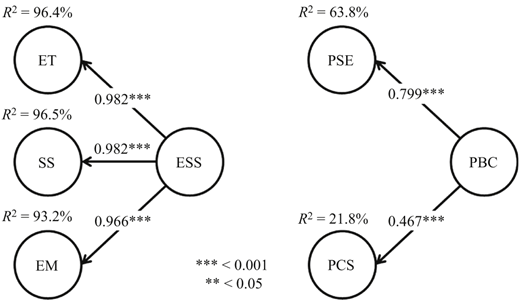
Left: ESS is a second-order construct, while ET, SS and EM are first-order constructs. Right: PBC is second-order construct, while PSE and PCS are first-order constructs
Left: ESS is a second-order construct, while ET, SS and EM are first-order constructs. Right: PBC is second-order construct, while PSE and PCS are first-order constructs
Table III shows the model fit summary for both second-order models. The unstandardised regression weights are all significant by the critical ratio test (>±1.96, p < 0.001) and the standardised regression weights are high. These results confirm that the ESS and PBC constructs load well on their three and two sub-constructs, respectively, and that the contribution of ESS and PBC on their three and two dimensions, respectively, are good. Thus, the results support H10, i.e. ESS consists of three sub-constructs (ET, SS and EM), and H2, i.e. PBC consists of two sub-constructs (PSE and PCS).
Model fit summary for the second-order models
| Measure | ESS | PBC |
|---|---|---|
| Absolute fit | ||
| Chi-square, p-value | 60.614, < 0.05 | 23.806, < 0.05 |
| RMSEA (LO 90, HI 90) | 0.054 (0.037, 0.072) | 0.064 (0.035, 0.094) |
| GFI | 0.972 | 0.984 |
| Incremental fit | ||
| AGFI | 0.950 | 0.959 |
| CFI | 0.986 | 0.964 |
| TLI | 0.979 | 0.933 |
| IFI | 0.986 | 0.965 |
| Parsimonious fit | ||
| Chi-square/df | 2.425 | 2.976 |
| PNFI | 0.678 | 0.505 |
Mediating variables
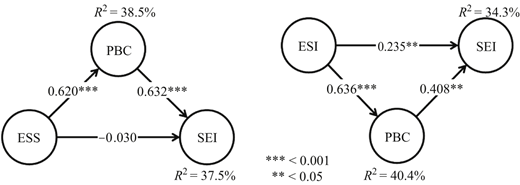
The study used mediation modelling to test for H9c and H13c. The study assumes that ESI and the university's ESS do not influence SEI directly but rather indirectly through the more proximal antecedents ETO, SER and PBC. To assess whether ETO, SER and PBC mediate the effect of ESI and ESS on SEI, the study first assessed whether ESI, ESS and the mediators have (individually) a direct and significant effect on SEI. The reason for testing direct effects separately is twofold (Judd and Kenny, 2015). First, for mediation to occur, all direct effects that constitute an indirect effect have to be substantial. Second, mediation can be inconsistent, i.e. there could be suppression of effects (MacKinnon et al., 2000; Maassen and Bakker, 2001). Furthermore, the knowledge of the relative importance of a specific mediator can further refine the understanding of the pathways through which an initial variable exerts an effect on an outcome (Ledermann and Macho, 2015). The individual models for the isolated effect of ESI, ESS, ETO, SER and PBC (individually) on SEI fit the data very well by the FP. Table IVa shows that the standardised regression weight between each antecedent and SEI is significant at the p < 0.001 level.
Results of the mediation modelling tests
| a. Isolated effects on SEI by individual factors | |||||
|---|---|---|---|---|---|
| Lone effect | ESI | ESS | ETO | SER | PBC |
| SEI ← | 0.474*** | 0.359*** | 0.394*** | 0.274*** | 0.587*** |
| b. Standardised indirect effects involving ESS and ESI | |||||
|---|---|---|---|---|---|
| Path | Effect | Lower | Upper | SE | P |
| ESS → ETO → SEI | 0.101 | 0.052 | 0.175 | 0.029 | 0.001 |
| ESS → SER → SEI | 0.045 | 0.019 | 0.089 | 0.017 | 0.001 |
| ESS → PBC → SEI | 0.392 | 0.202 | 1.240 | 0.210 | 0.000 |
| ESI → ETO → SEI | 0.065 | −0.159 | 0.181 | 0.090 | 0.419 |
| ESI → SER → SEI | 0.042 | 0.016 | 0.082 | 0.018 | 0.007 |
| ESI → PBC → SEI | 0.259 | 0.131 | 0.662 | 0.134 | 0.001 |
Afterwards, the mediators were introduced to assess whether their influence has a significant effect on SEI and whether it reduces the effect of ESI and ESS on SEI. If the lone effect of ESI and ESS on SEI reduces but is still significant, the mediator exerts partial mediation. However, if the direct effect reduces and is no longer significant, the mediator exercises complete mediation. The mediation models for the direct effect of ESS and ESI on SEI coupled with the indirect effect through the mediators fit the data very well by the FP. When the mediators ETO and SER were introduced, these mediators reduced the effect of ESS and ESI on SEI but remained significant at the p < 0.001 level. Thus, ETO and SER (individually) exert only partial mediation of ESS and ESI on SEI. However, when the mediator PBC was introduced, the mediator reduced the effect of ESS and ESI on SEI, and they were no longer significant at the p < 0.001 level. Thus, PBC exerts complete mediation of ESS and ESI on SEI supporting H9c and H13c. Figure 3 depicts the effects of the mediator PBC once it is included in the model. Table IVb shows the indirect effect of ESS and ESI on SEI that flows through the mediators. The indirect effects of ESS and ESI on SEI are statistically significant at the p < 0.05 level, except for the one that flows through ESI → ETO → SEI.
Measurement model
The original model in the study assumes that relations exist between the SEI of students and each of the proximal precursors of intention and between these and ESI and the university's ESS. In addition, the model suggests that relations exist between SER and ETO, SER and PBC. The study expressed these relations in the model in terms of the hypotheses in Table I. The discussion on mediation above suggests that indirect relations also exist between ESS and SEI and between ESI and SEI. Before testing these hypotheses with second-order SEM, the study defined a measurement model to verify that the 27 measurement variables reflect the seven unobserved constructs reliably. The study used second-order CFA using ML fitting functions (and bootstrapping) to determine the overall fit of the measurement model. The parameter summary and notes for the model show that the input covariance matrix generated from the 27 measurement variables in the model contains 378 distinct sample moments and 73 distinct parameters to estimate resulting in a model with 305 degrees of freedom (378 – 73).
Validity and reliability were tested by using the results obtained in the second-order CFA analysis and compared to the consensus values (Byrne, 2001; Hair et al., 2010). For convergence validity, the study compared the average variance extracted (AVE) for each factor with the recommended threshold >0.50. All of the AVE values were higher than the threshold, except for a few that were a fraction lower. For construct validity, the study compared the fitness indices for the model to their acceptable thresholds: χ2 = 696.513 with 305 degrees of freedom, CMIN/DF = 2.295, p < 0.05, CFI = 0.928, GFI = 0.900, AGFI = 0.877, TLI = 0.917, IFI = 0.928, PNFI = 0.764 and RMSEA (LO, HI) = 0.051 (0.046, 0.057). Thus, the overall fit of the measurement model was good. For discriminant validity, the study compared the correlations between exogenous constructs with the recommended threshold <0.85. All of the correlations between exogenous constructs were lower than the threshold. In addition, the study checked that the square root of the AVE values was greater than the inter-construct correlations, and that the AVE values were higher than the maximum shared variance (MSV) and the average shared variance (ASV). For internal reliability, the Cronbach alpha for each factor was compared with the recommended threshold >0.70. All of the Cronbach alpha values were higher than the threshold, except for a few that were a fraction lower. For composite reliability, the study compared the composite reliability (CR) for each factor with the recommended threshold >0.60. All of the CR values were higher than the threshold, except for one that was a fraction lower. In summary, given the discussion above and the fact that the unstandardised regression weights were all significant by the critical ratio test (>±1.96, p < 0.001), the model seems to fit the data well.
Group invariance
One of the questions that the study wants to examine is whether the pattern of structural relations hypothesised in the path model follows the same dynamics for male and female students. In investigating gender differences in the path model, it is necessary to first test whether the factor structure represented by the posited measurement model is the same for both groups (Ho, 2014), i.e. through common factor analysis. Cross-group validity of the measurement model was checked by performing a series of tests where the demands for the equivalence of the measuring model were increased gradually to check for invariance. The study followed the recommendations by Blunch (2013) and used RMSEA as the main fit measure. It was already mentioned above that the unconstrained model fits the data well based on the RMSEA indicator. Table Va shows that RMSEA is also small across all the increasingly more constrained models.
Results of the group invariance tests
| a. Fitness of the different models by the RMSEA measure | ||||
|---|---|---|---|---|
| Model | RMSEA | LO 90 | HI 90 | PCLOSE |
| 0) Unconstrained | 0.037 | 0.033 | 0.041 | 1.000 |
| 1) Measurement weights | 0.037 | 0.033 | 0.041 | 1.000 |
| 2) Structural weights | 0.037 | 0.033 | 0.041 | 1.000 |
| 3) Structural covariances | 0.038 | 0.034 | 0.041 | 1.000 |
| 4) Structural residuals | 0.037 | 0.033 | 0.041 | 1.000 |
| 5) Measurement residuals | 0.040 | 0.036 | 0.043 | 1.000 |
| Independence model | 0.126 | 0.123 | 0.129 | 0.000 |
| b. Incremental fit measures. Assuming Model 0 (unconstrained) to be correct | |||||||
|---|---|---|---|---|---|---|---|
| Model | DF | CMIN | P | NFI | IFI | RFI | TLI |
| 1) Measurement weights | 18 | 21.207 | 0.269 | 0.004 | 0.004 | −0.002 | −0.002 |
| 2) Structural weights | 20 | 21.506 | 0.368 | 0.004 | 0.004 | −0.002 | −0.002 |
| 3) Structural covariances | 41 | 71.719 | 0.002 | 0.012 | 0.013 | 0.001 | 0.001 |
| 4) Structural residuals | 46 | 75.200 | 0.004 | 0.013 | 0.014 | 0.000 | 0.000 |
| 5) Measurement residuals | 73 | 178.492 | 0.000 | 0.03 | 0.033 | 0.01 | 0.011 |
| c. AIC for the six models | ||
|---|---|---|
| Model | AIC | BCC |
| 0) Unconstrained | 1,300.821 | 1,340.468 |
| 1) Measurement weights | 1,286.028 | 1,320.788 |
| 2) Structural weights | 1,282.327 | 1,316.543 |
| 3) Structural covariances | 1,290.540 | 1,319.054 |
| 4) Structural residuals | 1,284.021 | 1,311.177 |
| 5) Measurement residuals | 1,333.313 | 1,353.137 |
| Saturated model | 1,512.000 | 1,717.296 |
| Independence model | 6,051.956 | 6,066.620 |
To verify the fit of the various models, the study also looked at the incremental fit measures given in Table Vb, constructed from several tables of marginal chi-square test for hierarchical models. The chi-square-difference test shows that Models 1 and 2 are not significant at any level, while models 3, 4 and 5 are significant at the p < 0.05 level. Furthermore, by adding increasing restrictions, the differences for indicators NFI, IFI, RFI and TLI changed very little for Models 1 and 2. From an information theoretic standpoint, the Akaike information criterion (AIC) in Table Vc shows that Model 2 would be the best model (Akaike, 1998; deLeeuw, 2011) among the non-significant models. In evaluating the hypothesised models, the AIC measure takes into account both model parsimony and model fit. Simple models that fit well receive lower scores, whereas poorly fitting models get higher scores (Ho, 2014). The discussion above provides confirmation that the measuring model shows invariance up to Model 2 (structural weights). Thus, the model is appropriate for use in the multi-group analysis.
Structural model
The study used second-order SEM to test for H1 through H13. The group invariance test of the measurement model above confirmed that the structural model could be used to evaluate and compare the two groups of students. For this, the study used the factor structure assessed in the measurement model, i.e. four factors with three measurement indicators each, one factor with two sub-factors with three measurement indicators each, one factor with three sub-factors with three measurement indicators each and multi-group analysis applied simultaneously to the male and female samples as depicted in Figure 4. To test the assumption that the path model holds for both male and female students, the study followed the recommendations by Ho (2014) and required that the pattern of relationships (i.e. the path coefficients) be the same for both groups. However, it did not require the unique variances and covariances for male and female students to be group-invariant. The rationale behind this assumption of group-invariant path coefficients is that, although it is probably reasonable to assume that the observed and unobserved variables have different variances, covariances and regression weights among male and female students, the process by which the two groups arrived at their decision about SEI may be similar. If the path coefficients are the same for male and female students, then the same path coefficients can be used for both groups, which simplifies the prediction of the endogenous variables from the model's exogenous variables (Ho, 2014) (see Figure 5).
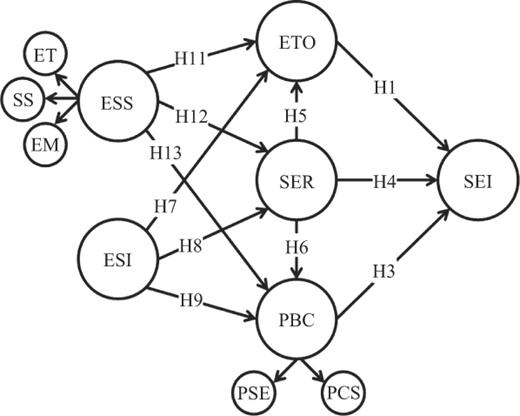
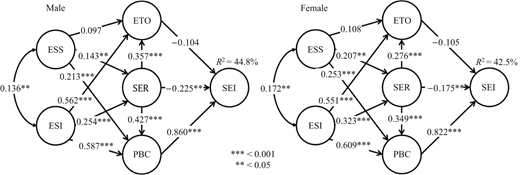
Structural path models for male and female students with standardised path coefficients
Structural path models for male and female students with standardised path coefficients
The two covariance matrices generated from the two datasets contain 756 sample moments. For the unconstrained model, there were 140 distinct parameters to estimate and 616 degrees of freedom (756 – 140). For the constrained model, there were 127 distinct parameters to estimate and 629 degrees of freedom (756 – 127). Table VI presents a model fit summary for the unconstrained and constrained path models. Both models fit the data quite well.
Model fit summary for unconstrained and constrained models
| Measure | Unconstrained | Constrained |
|---|---|---|
| Absolute fit | ||
| Chi-square, p-value | 1,038.203, < 0.05 | 1,045.786, < 0.05 |
| RMSEA (LO 90, HI 90) | 0.038 (0.034, 0.042) | 0.038 (0.034, 0.042) |
| GFI | 0.860 | 0.858 |
| Incremental fit | ||
| AGFI | 0.828 | 0.829 |
| CFI | 0.919 | 0.920 |
| TLI | 0.908 | 0.911 |
| IFI | 0.921 | 0.922 |
| Parsimonious fit | ||
| Chi-square/df | 1.685 | 1.663 |
| PNFI | 0.724 | 0.738 |
Table VIIa shows the nested model comparison statistics for the two models assuming that the unconstrained model is correct. The comparison indicates that the chi-square difference value for the two models is 13.876 (1045.786 – 1038.203), which with 19 degrees of freedom (629 – 616), is not significant at the p < 0.05 level. Therefore, the two models do not differ significantly in their goodness of fit. Table VIIb presents the AIC measures for the two competing models. Based on the model comparisons findings, and assuming that the constrained model is correct, the constrained model's estimates are preferable over the unconstrained model's estimates (Ho, 2014).
Results of the nested model comparison
| a. Nested model comparisons. Assuming the unconstrained model to be correct | |||||||
|---|---|---|---|---|---|---|---|
| Model | DF | CMIN | P | NFI | IFI | RFI | TLI |
| Constrained | 13 | 7.583 | 0.870 | 0.001 | 0.001 | −0.003 | −0.003 |
| b. Akaike information criterion for the two competing models | ||||
|---|---|---|---|---|
| Model | AIC | BCC | BIC | CAIC |
| Unconstrained | 1,318.203 | 1,356.221 | – | – |
| Constrained | 1,299.786 | 1,334.273 | – | – |
| Saturated model | 1,512.000 | 1,717.296 | – | – |
| Independence model | 6,051.956 | 6,066.620 | – | – |
Table VIII presents the unstandardised regression weights (RW) and standardised RW (SRW) for male and female students for the constrained model. Of the 11 coefficients associated with the paths linking each gender-based model's exogenous and endogenous variables, nine are significant by the critical ratio test (>±0.96, p < 0.05), while two are not significant. Table VIII depicts the path coefficients for male and female students along with the covariances and their significances. The relations hypothesised by H3, H4, H5, H6, H7, H8, H9, H12 and H13 are significant at the p < 0.05 or p < 0.001 levels. The relations hypothesised by H1 and H11 are not significant.
RW and SRW
| Path | RW | SE | CR | P | SRW male | SRW female | Label |
|---|---|---|---|---|---|---|---|
| SER ← ESS | 0.202 | 0.065 | 3.137 | 0.002 | 0.143 | 0.207 | H12 |
| SER ← ESI | 0.482 | 0.122 | 3.943 | *** | 0.254 | 0.323 | H8 |
| ETO ← ESS | 0.046 | 0.026 | 1.741 | 0.082 | 0.097 | 0.108 | H11 |
| PBC ← ESS | 0.051 | 0.014 | 3.69 | *** | 0.213 | 0.253 | H13 |
| ETO ← ESI | 0.356 | 0.069 | 5.147 | *** | 0.562 | 0.551 | H7 |
| PBC ← ESI | 0.187 | 0.037 | 5.114 | *** | 0.587 | 0.609 | H9 |
| ETO ← SER | 0.119 | 0.029 | 4.156 | *** | 0.357 | 0.276 | H5 |
| PBC ← SER | 0.072 | 0.017 | 4.211 | *** | 0.427 | 0.349 | H6 |
| SEI ← ETO | −0.412 | 0.44 | −0.936 | 0.349 | −0.104 | −0.105 | H1 |
| SEI ← SER | −0.297 | 0.148 | −2.003 | 0.045 | −0.225 | −0.175 | H4 |
| SEI ← PBC | 6.736 | 1.409 | 4.781 | *** | 0.860 | 0.822 | H3 |
Finally, to test for H14, the study estimated the factor means using a common factor analysis model of the data from both populations. As it is not possible to estimate the means of every factor for both populations, the study followed the approach by Sörbom (1974) to estimate the differences in factor means across populations. The method also provided a test of significance for differences in the factor means. To test the null hypothesis that the factor means are the same for male and female students, the RW and intercepts were set as equal and the factor means for male students were fixed to zero. The common factor analysis model fits the data well by the FP and the unstandardised RW are all significant by the critical ratio test (>±1.96, p < 0.001). As the factor means for male students was fixed to zero, Table IX shows the factor means for the difference between both populations. The university's ESS seems to affect female students more than male students by a value of 0.181**, although the difference does not seem very large judging by their standard deviations (male, 0.779*** and female, 0.913***). The SEI of female students seems to be larger than that of the male students, 0.269, which is approaching significance (p = 0.057). Again, the difference does not seem very large judging by their standard deviations (male, 1.547*** and female, 1.398***). These results provide support for H14.
Discussion
The study tested the applicability of a variant of the model proposed by Hockerts (2017) for assessing the SEI of male and female students. The data analysis supports the hypothesised connections among the constructs of the model listed in Table I, with the exception of H1 and H11. Table X presents the squared multiple correlations showing the amount of variance in the endogenous variables accounted for by the exogenous variables. For male students, the university's ESS and the student's ESI account for 10.7 per cent of the variance of SER, while the university's ESS, the student's ESI and SER account for 61.9 and 83.4 per cent of the variances of ETO and PBC, respectively. For female students, the joint influence of the university's ESS and the student's ESI account for 18.9 per cent of the variance of SER, while the university's ESS and the student's ESI and SER account for 56.5 and 87.1 per cent of the variances of ETO and PBC, respectively. Together, PBC, SER, ETO, ESI and ESS account for 44.8 and 42.5 per cent of the variances of the SEI of males and female students, respectively. (Note: these results do not imply causation.)
Squared multiple correlations
| Group | SER | PBC | ETO | SEI |
|---|---|---|---|---|
| Male students | 0.107 | 0.834 | 0.619 | 0.448 |
| Female students | 0.189 | 0.871 | 0.565 | 0.425 |
Of the three paths influencing the SEI of students, only two are statistically significant, i.e. SER (male: β = −0.225***, female: β = −0.175**) and PBC (male: β = 0.860***, female: β = 0.822***), where PBC seems the most influential. The university's ESS seems to have a significant positive effect on the precursors SER (male: β = 0.143**, female: β = 0.207**) and PBC (male: β = 0.213***, female: β = 0.253***), where the influence on PBC seems to be the strongest. This could mean that students perceive that the university is contributing to their PSE by providing them with the knowledge necessary to start a social enterprise and that the university is part of their community support, PCS. Furthermore, the indirect effect of ESS on SEI that flows through the ETO, SER and PBC is positive and significant for male (0.188**) and female (0.213**) students. The ESI of students seems to have a significant and important positive effect on the precursors ETO (male: β = 0.562***, female: β = 0.511***), SER (male: β = 0.254***, female: β = 0.323***) and PBC (male: β = 0.587***, female: β = 0.609***). This strong influence of the students' ESI on the precursor of SEI translate into a positive and significant indirect effect on SEI of male (0.473**) and female (0.469**) students. Two out of three immediate precursors of SEI are significant, SER (male: β = −0.225**, female: β = −0.175***) and PBC (male: β = 0.860***, female: β = 0.822***), where PBC seems the most influential. Table XI shows the standardised indirect effects of ESS and ESI that flow through the different paths in the model. All of the indirect effects from ESS and ESI are positive and significant at the p < 0.05 level, which highlights the importance of these distal antecedents.
Standardised indirect effects involving ESS and ESI (male, female)
| Path | Effect | Lower | Upper | SE | P |
|---|---|---|---|---|---|
| ESS → SER → PBC | 0.061, 0.072 | 0.017, 0.019 | 0.142, 0.163 | 0.029, 0.035 | 0.007, 0.008 |
| ESS → SER → ETO | 0.051, 0.057 | 0.013, 0.012 | 0.121, 0.142 | 0.026, 0.030 | 0.007, 0.008 |
| ESS → SER + PBC → PSE | 0.203, 0.228 | 0.105, 0.123 | 0.320, 0.349 | 0.054, 0.058 | 0.001, 0.001 |
| ESS → SER + PBC → PCS | 0.126, 0.137 | 0.058, 0.060 | 0.224, 0.275 | 0.045, 0.052 | 0.001, 0.001 |
| ESS → SER + PBC + ETO → SEI | 0.188, 0.213 | 0.082, 0.094 | 0.301, 0.326 | 0.054, 0.059 | 0.002, 0.002 |
| ESI → SER → PBC | 0.108, 0.113 | 0.056, 0.056 | 0.206, 0.206 | 0.034, 0.037 | 0.000, 0.001 |
| ESI → SER → ETO | 0.091, 0.089 | 0.044, 0.044 | 0.174, 0.172 | 0.031, 0.029 | 0.001, 0.000 |
| ESI → SER + PBC → PSE | 0.514, 0.505 | 0.361, 0.334 | 0.687, 0.668 | 0.085, 0.086 | 0.002, 0.002 |
| ESI → SER + PBC → PCS | 0.318, 0.304 | 0.215, 0.199 | 0.446, 0.456 | 0.060, 0.062 | 0.001, 0.002 |
| ESI → SER + PBC + ETO → SEI | 0.473, 0.469 | 0.277, 0.355 | 0.621, 0.580 | 0.085, 0.059 | 0.003, 0.001 |
Conclusion
The study developed a systematic methodology based on second-order SEM to test the applicability of a variant of the model proposed by Hockerts (2017) for assessing the differences in SEI of male and female students. It extended the model by incorporating the university's ESS as an additional more distal construct, which together with ESI affect SEI by influencing the more proximal factors of ETO, SER, PSE and PCS. The results of the study provided confirmation that the proposed model is multi-group invariant and appropriate for analysing the SEI of male and female students. They also show that the university's ESS helps predict SEI indirectly through the complete mediation of the more proximal antecedents. Furthermore, the study was able to show that the university's ESS can be modelled as a higher-order construct that can account for the seemingly distinct, but related sub-constructs: ET, SS and EM.
The study advances the social entrepreneurial knowledge of the university's effect on the precursors of SEI. The results of the study have implications for aspiring entrepreneurial universities in general and universities with social innovation and entrepreneurship initiatives in particular. They enable a better understanding of the influence that the university's ESS has on the antecedents of the SEI of male and female students. Previous studies have conjectured that the environment could significantly affect SEI, but none of them has studied the influence that the university's entrepreneurial ecosystem has on the antecedents of SEI of male and female students. In addition, the study provides a template for related studies that can be conducted in other universities. Furthermore, as the overall results of the study are consistent with similar research done by others, further analysis of the data can be used to improve the current entrepreneurial ecosystem for male and female student entrepreneurs. In particular, results from the study will serve as a baseline for future research and longitudinal studies in the Canadian university. The study will be refined to re-assess the influence of the university's ESS antecedents of the SEI of male and female students on a regular basis (bi-yearly or every four years).
The study is subject to some limitations. Similar to previous studies in the literature, the present study focuses on intentionality. It is clear that intentions may not turn into actual behaviours in the future. Currently, there is no other accurate way to measure SEI. Thus, the study takes the statements of respondents about their SEI as a reliable source of information. The study based the collected data on the perceptions of the students. It is possible that a difference between “perception” and “reality” exists. However, it is equally important to analyse how students perceive the university's ESS because these might shape their SEIs (Turker and Selcuk, 2009). The questionnaire is limited to universities with social innovation and entrepreneurship initiatives. These limitations do not invalidate the conclusions of the study.
The authors acknowledge the support from Atlantic Canada Opportunity Agency (ACOA), Newfoundland and Labrador's Department of Tourism, Culture, Industry and Innovation (TCII), the Memorial Centre for Entrepreneurship (MCE) and the Centre for Social Enterprise (CSE). The authors appreciate the logistic support they received from the Memorial University of Newfoundland Students' Union (MUNSU) and the Graduate Students' Union (GSU) at Memorial University of Newfoundland. The corresponding author also acknowledges the additional support provided by the Office of the Vice-President (Research), the Office of the Dean of Engineering and Applied Science and the Office of the Dean of Business Administration at Memorial University.
References
Appendix
Questionnaire Items
ETO: refers to the degree to which the person is able to intellectually recognise and emotionally share the feelings of others.
ETO1 – When thinking about disadvantaged people, I try to put myself in their shoes
ETO2 – Seeing disadvantaged people makes me want to help them
ETO3 – I feel compassion for marginalised people
SER: refers to the cognitive process that motivates a person to help others or the environment in pursuit of a mission.
SER1 – It is everybody's responsibility to help disadvantaged people
SER2 – Everybody has an obligation to help solve the problems that society faces
SER3 – Everybody needs to protect the environment for future generations
PSE: refers to the perceived level of self-confidence to succeed in specific situations or perform a task.
PSE1 – I can make a contribution to address one of society's problems
PSE2 – I can figure out ways to help solve a problem that society faces
PSE3 – Everybody can contribute to solving the problems in society
PCS: refers to trust and cooperation that can be derived from the person's network.
PSS1 – People will support me if I wanted to start a social enterprise
PCS2 – People will help me if I plan to address a problem in society
PCS3 – It is possible to attract funders for a new social enterprise
SEI: represents the intention of students to start a social venture.
SEI1 – I expect that in the future I will be involved in launching a social enterprise
SEI2 – My professional goal is to become a social entrepreneur
SEI3 – I am seriously thinking about starting a social enterprise in the future
ESI: represents the familiarity of the person with social or environmental issues.
ESI1 – I have experience working on a problem faced by society
ESI2 – I have volunteered with a social enterprise in the past
ESI3 – I am familiar with the problems that society faces
University ESS: represents the entire entrepreneurial ecosystem in the university.
ESS1 – MUN provides a creative atmosphere to develop ideas for a social enterprise
ESS2 – MUN creates awareness of social entrepreneurship as a possible career choice
ESS3 – MUN provides networking opportunities for social entrepreneurial students
ESS4 – MUN provides students with the knowledge needed to start a social enterprise
ESS5 – MUN offers experiential learning related to social enterprise
ESS6 – MUN arranges workshops and conferences on social entrepreneurship
ESS7 – MUN has many resources to help students to start of a social enterprise
ESS8 – MUN arranges mentoring services for social entrepreneurial students
ESS9 – MUN provides students with ideas to start a new social enterprise

