This research aims to investigate how the social and spatial properties of Sydney’s social housing units have evolved over four socially defined eras (1890–1939, 1940–1969, 1970–1999 and 2000–present). It asks three questions as follows: (1) Which syntactic and dimensional shifts characterise each era? (2) How changing social contexts and delivery modes influence housing form? (3) What lessons can inform contemporary design practice?
This research analyses the syntactic and dimensional characteristics of 45 social housing units in Sydney, constructed between 1914 and 2020. A computational approach is employed, combining justified plan graph analysis with plan area properties derived from archival drawings.
The results show a correlation between the integration values of the “private” and “communal” sectors and their corresponding area ratios. Notably, the private sector’s integration during the “Golden Age” (1940–1969) and its connectivity and mean depth in the “Deceleration” era (1970–1999) differ significantly from other eras.
The study’s findings, including adaptive-JPGs, reveal how past layouts responded to social dynamics, offering lessons for contemporary design. The combined evolution of syntactic and dimensional properties in housing plan layouts over time has not previously been examined in such a comprehensive manner. Beyond contributing to digital design knowledge, these insights inform future planning strategies for developing adaptable and effective social housing solutions.
1. Introduction
The design of social and affordable housing has evolved over time and across countries, presenting both challenges and opportunities for building and urban development (Bican, 2023; Ha, 2008; Zanardo, 2018). Specifically, digital design knowledge derived from 2D plan layouts can inform design recommendations and support the generation of optimised spatial configurations (Park et al., 2023; Wang and Duan, 2023). This approach enables data-driven insights that enhance decision-making processes, contributing to more efficient, functional and sustainable housing solutions in response to contemporary social demands. While recent studies leveraging machine learning support floor plan analysis and design automation using 2D drawings (Çelik, 2024; Park et al., 2023), socio-spatial properties have been insufficiently addressed in existing knowledge-based systems. As such, the design knowledge of social housing in this region over time offers valuable insights into its historical context, forming a foundation to inform contemporary practices and future policies.
Two significant knowledge gaps are apparent in past social housing research about Australian cases in general and Sydney cases in particular. First, there have been no computational studies of the changing social structures – the socio-spatial configuration of the plan – embedded in the standard social housing unit, the apartment. Past literature identifies four significant eras in Sydney social houses – 1890–1939, 1940–1969, 1970–1999 and 2000–present – each shaped by specific factors. Second, the dimensional (measured plan area) properties of these apartments, specifically the area and types of space set aside for various functions, have been largely ignored. In response, this study asks, “How have the social and spatial properties of social housing units in Sydney evolved over time?” Three sub-questions guide the analysis:
Which syntactic and dimensional attributes distinguish the four socially defined eras?
How do spatial patterns reflect shifts in social context and housing delivery approaches across eras?
What transferable design principles emerge for current housing practice?
To answer this question, the present research undertakes a three-stage analysis of 45 unit plans (including 1-, 2- and 3-bedroom types) from 20 housing projects collected for analysis, with the earliest work completed in 1914 and the most recent in 2020. This research adopts a four-era classification based on key social and demographic transitions, such as economic depression, post-war growth, urban densification and multicultural population shifts, that influenced the planning and delivery of social housing (Wheeler, 2021; Yang et al., 2022).
The three stages in the research are (1) syntactic measurement using justified plan graph (JPG) analysis of four socio-spatial properties, (2) dimensional measurement of floor area and the area of each functional sector and (3) statistical and ANOVA analysis to assess the degree of correlation between the two groups of data. Finally, based on qualitative and quantitative analyses, four typical adaptive-JPGs are identified. The following section provides a short overview of Sydney social housing before identifying the 45 apartments and then describing the method used. Thereafter, the results are reported and discussed. The paper concludes by revisiting the research question, discussing the limitations of the method and the implications of the results.
2. Background
Recent literature highlights the socio-spatial evolution of social housing across multiple international contexts, from European post-war estates to Asian megacities (Ha, 2008; Bican, 2023). In New South Wales (NSW), Australia, social housing was officially established with the inception of the Housing Act in 1912 (Wheeler, 2021). However, examples of housing with similar objectives have existed for several decades before this. Sydney’s social housing has been the subject of a range of previous studies, encompassing affordability and residualisation (Morris, 2018), inclusivity (Massola and Howard, 2023), economic stability (Randolph et al., 2018) and health (Garrett, 2019). Despite this, research about the design of social housing in Sydney is largely qualitative in nature, examining, for example, “use of space”, “physical scales” and “perception of space” but not the planning of apartments (Baker and Oppewal, 2023; Zanardo, 2009).
Social housing can be defined as “government-subsidised, long-term, rental housing for people on very low incomes with a housing need” (NSW Gov, 2024a). Additionally, it is an umbrella term encompassing public housing, community housing and Aboriginal housing in Australia (O'Flynn, 2011). Social housing is intended to provide safe and affordable accommodation for households experiencing financial stress (Groenhart and Burke, 2014; Yates, 2013). Its purpose is to reduce homelessness, improve health and well-being and promote community stability and social inclusion (Ben Haman et al., 2020). The creation of social housing stimulates the economy, and its existence facilitates increased workforce participation (Pawson et al., 2020). Despite its importance, Australia, in general, and NSW in particular, are experiencing a significant social housing shortage. As of late 2024, there are 57,401 households – 48,744 general applicants and 8,657 priority applicants – on waiting lists for social housing in NSW (NSW Gov, 2024b). That makes the NSW social housing waitlist, focused on the state’s capital Sydney, the longest in Australia (Morris et al., 2023). These pressures have also driven several decades of housing reform guidelines in NSW, culminating in the introduction of State Environmental Planning Policy No 65 (SEPP 65) in 2002. It aimed to enhance the design quality of residential flat developments by establishing not only numerical objectives for design properties (such as access to natural light and ventilation) but also social aspects (visual and acoustic privacy and safety through design) and a consideration of phenomenological factors, such as a sense of safety or community.
Although the present study is not policy-focused, each era broadly aligns with shifts in governance structures and housing models, such as the implementation of SEPP 65, adding institutional texture to the social narrative. A growing body of Australian research has also focused on design-performance mismatches in recent developments (Yang et al., 2024), reinforcing the value of longitudinal socio-spatial analysis.
3. Materials and methods
3.1 Case selection
Historians have identified four distinct eras in Australia’s relatively short (approx. 150 years) engagement with social housing (Wheeler, 2021; Yang et al., 2022). These eras are characterised as the “Formation”, “Golden Age”, “Deceleration” and “Contemporary Developments” periods, each shaped by significant social events. The earliest social housing in Australia dates to the late 19th century, with significant growth during the Great Depression and following the First World War, a time known as the Formation era (1890–1939). The subsequent Golden Age (1940–1969) saw increased social housing production. However, in the Deceleration era (1970–1999), there was a rapid decline in production rates and reduced government investment. After 2000, supported by partnerships with the “not-for-profit” sector and enlightened policy, a diverse range of social housing schemes were built, now grouped under the heading “Contemporary Developments” (2000–present). These social shifts coincided with key policy developments, such as the Housing Act (1912), post-war Commonwealth–state housing agreements and funding contractions in the late 1990s, which indirectly shaped the volume and typology of social housing delivered in each era (Pawson et al., 2020; NSW Gov, 2024a).
For the present research, 5 buildings from each era (20 total) were chosen for analysis. With several thousand social housing properties in Sydney, this is not a representative sample of the whole population but is more significant as a subset. Each selected case had to meet four criteria: (1) designated social housing located within the “City of Sydney” region, (2) substantially “new build”, (3) low- or medium-rise and (4) a typical floor area less than 2000 square metres. Thus, this research is concerned with purpose-designed, medium-density housing of the era, much of it representing pattern-book or “best practice” approaches used in variations across multiple locations. For each of the 20 buildings, typical 1-, 2- and 3-bedroom units were identified, though not every plan included all three types. Ultimately, 11 × 1-bedroom, 20 × 2-bedroom and 14 × 3-bedroom cases were identified, totalling 45 cases for this study. Table 1 identifies the buildings, their era, the number of storeys and the numbers of 1-, 2- and 3-bedroom units in each.
3.2 Method
The most widely accepted method for measuring and comparing the socio-spatial properties of a set of architectural plans is a space syntax technique called JPG analysis. Space syntax is a configurational theory in architecture and urban studies (Hillier, 1996; Lee and Ostwald, 2020) that also offers a mathematical approach to understanding the structure of space and the socio-spatial forces that gave rise to this structure. A unique feature of “syntactic” research is that it is essentially, if not solely, focused on configurational properties without reference to dimensional properties. That is, space configuration affects how buildings and built environments are formed and function. Space is not just a neutral background for human activities; it shapes societies and cultures into “objective” realities. Importantly, human behaviours and social interactions create their own spatial forms, embedding space into these activities. Thus, human activities (moving, meeting, avoiding, communicating, etc.) are not simply behaviours in space but spatial patterns themselves (Hillier, 1996). Following this logic, the properties of spatial configuration shape and reflect human behaviours, connecting space to social properties.
Space syntax methods are often used to mathematically identify (1) how spatial configurations convey socio-spatial meaning and/or (2) what kind of social relationships are embedded in spatial configurations. The first step in syntactical analysis is topological abstraction, wherein the built environment being studied is converted into a network of connected spatial units. This is represented as a graph in which the spatial units are graph nodes, and the connections between them are graph edges. Once the graph is formed, it can be subjected to mathematical analysis. Space syntax has three standard computational techniques: axial line analysis, convex space analysis (including variations of JPG analysis) and isovist analysis (or visibility graph analysis), corresponding to three methods of abstraction: axial lines (modelling movement), convex spaces (modelling inhabitation and social connection) and isovists (visually defined and connected regions).
The JPG, also known as a “justified graph” or “justified permeability graph” (Hanson, 1998; Lee et al., 2018; Ostwald, 2011), is a variation of convex space analysis. It is employed to investigate the spatial configuration and genotypes of a series of connected spaces representing self-contained social interaction locations. It is common in housing research (Hanson, 1998) and research focusing on the interiors of buildings (Lee et al., 2022, 2023). Variations of it have been used to study social housing (Elizondo, 2022; Obeidat et al., 2022), architect-designed housing (Benrós et al., 2012; Dawes et al., 2023; Lee et al., 2018) and the evolution of historical housing types (Amini Behbahani et al., 2016; Fallah Tafti and Lee, 2022; Zeng et al., 2020). In most cases, the JPGs are constructed of functionally defined spaces (living rooms, bedrooms, etc.) rather than following a strict “convex space” partitioning procedure, which would, for example, separate a small window-seat alcove from the living room it is attached to.
3.3 Syntactic measures
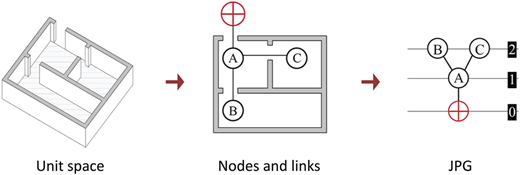
There are three steps to generate a JPG. First, identify the root, usually the “outside world” – the unit entrance in this research. It is denoted by a circle with a cross inside and placed at the base of the graph at level 0 (see ⊕ in Figure 1). Second, identify all the functional rooms as different nodes and their connections (links). Third, arrange these nodes by their spatial hierarchy regarding movement and connectivity. This means the nodes should be laid out on different levels based on the number of steps or depths required to reach each space from the root. Once the connectivity is defined, spaces directly connected to the root are at level 1, those connected to them are at level 2 and so on.
From each of the 45 JPGs developed in this research (see examples in Figure S1 in the Supplementary Material), this study measures four syntactic properties: connectivity (C), control value (CV), mean depth (MD) and integration (1). These properties are the most used in previous studies and are among the most validated against empirical data (Lee et al., 2023). Each of these syntactic properties reflects critical social dimensions:
Connectivity (C) measures the number of immediate neighbouring spaces relative to the origin space (Hillier and Hanson, 1984). This means a space with high connectivity tends to be more accessible and central to movement. For example, a highly connected functional room (e.g. a corridor or living room) will likely see more social interaction.
CV measures the degree to which an origin space controls access to its immediate neighbours. A higher CV indicates a space which is more accessible (Hillier and Hanson, 1984). Spaces with high control values serve as control points and regulate movement, as people must pass through them to reach other spaces. A typical example is a unit corridor, which is connected to several private functional rooms (e.g. bedrooms, bathrooms, and toilets). The CV of space i is calculated as follows:
where k means the number of spaces connected to the origin space i and means the connectivity value of space j.
MD is calculated by dividing the total depth – defined as the sum of all spaces’ minimum depths from the origin space – by the number of spaces, excluding the origin space (Hillier and Hanson, 1984). A high MD value indicates that a space is deeper within the system, making it relatively more challenging to access. However, in terms of social interaction, having a high MD could potentially offer greater privacy. The MD of space i is calculated as follows:
where n means the number of nodes in the system and means the shortest Euclidean distance of any two points in space i and space j.
Integration (i), a normalised measurement of distance, describes the accessibility from the origin space to all other spaces (Hillier and Hanson, 1984). Highly integrated spaces are socially central, as they accommodate the most interaction and activity due to their high accessibility. The i of space i is calculated as follows:
where value for n spaces can be extracted from Hillier and Hanson (1984, p. 112).
For the present research, Depthmap X (version v0.8.0) is employed to measure the four syntactic properties. Although this research measures the syntactic properties of each room, it presents results based on sectors due to their complexity. For example, a communal sector is a sum of semi-public, semi-private and transfer spaces; thus, 4 syntactic properties across three sectors, a total of 12 syntactic variables, were calculated. Furthermore, although MD and i values can be regarded as normalised values for comparison, this research reports their z-values (individual data – mean)/standard deviation for this purpose.
3.4 Dimensional properties
For the 45 apartments, original architectural floor plans were sourced from the Sydney City Archives. They were digitised and scaled; then, dimensions were extracted and compared with written dimensions (for this research, pre-metric measures, feet and inches, are converted). The original room functions were also recorded (Table 2). Minor dimensional discrepancies were noted in some plans, but they had negligible impact (<1%) on overall measures. The actual use of rooms and subsequent minor modifications are beyond the scope of this research. As such, this analysis is of the approved apartment plans. To assist the analysis, and in accordance with privacy gradient theory and past JPG research (Alexander et al., 1977; Lee and Ostwald, 2020; Lee et al., 2018; Ostwald and Dawes, 2018), all functional rooms are categorised into four types: “private”, “semi-public”, “semi-private” and “transfer” sectors. In addition, spaces are grouped and categorised as “communal”, “outside” and “other” sectors, which include non-habitable spaces such as cupboards, closets and sculleries (see Table 2).
3.5 Variables
For correlation analysis, syntactic data (C, CV, i and MD) and dimensional data (area and proportion of different functional sectors/rooms) are supplemented with three additional variables: unit type, era and total floor area (TFA). Unit types are coded as 1, 2 and 3, representing 1-, 2- and 3-bedroom units, respectively. The era of construction is coded 1, 2, 3 and 4, representing the four distinct periods into which social housing is historically grouped. TFA is also reported and analysed. While all syntactic values are standardised (using z-values), the TFA and proportion of function room types are displayed as specific numerical values. There are 12 syntactic variables after standardisation and six dimensional variables. For convenience, abbreviations for different variables and functional rooms are listed in Table S1 in the Supplementary Material. Correlation and one-way ANOVA analysis are used to understand the relationships between variables and explore their statistically significant differences.
3.6 Adaptive-JPG
An adaptive-JPG is a flexible, configurable JPG that focuses on the spatial arrangement of various functional sectors (see also Figure S1 in the Supplementary Material). In this type of JPG, a dashed node represents potential function rooms, as some unit plans may share identical private or communal configurations but differ in the arrangement of auxiliary spaces (e.g. cupboard, laundry and scullery). Similarly, dashed links indicate potential connections between functional rooms. This approach allows the adaptive-JPG to reflect the flexibility of diverse spatial configurations and functional requirements. The generation process of the adaptive-JPG is similar to that of the JPG described in Figure 1, but it is constructed based on the spatial depth of each functional sector outlined in Table 2.
In the collected cases, the main difference in adaptive-JPGs lies in whether the primary connection space is a relatively large and open area in the communal sector (e.g. living room, dining room or both) or the transfer sector within the communal sector (specifically referring to transitional spaces such as an entry or corridor), which serves as the main link between individual rooms and the entrance. Based on these observations, all unit plans and their corresponding adaptive-JPGs can be categorised into two types in this study: those with the transfer sector (i.e. entry or corridor) as the primary connection space and those with the living room as the primary connection space. Lastly, adaptive-JPGs that represent more than three historical JPGs over time are categorised as types.
4. Results
The following section presents the quantitative findings in two parts. It firstly outlines the syntactic and dimensional results across the four eras and then examines how these patterns reflect wider social and historical changes in Sydney’s social housing.
4.1 Syntactic and dimensional results
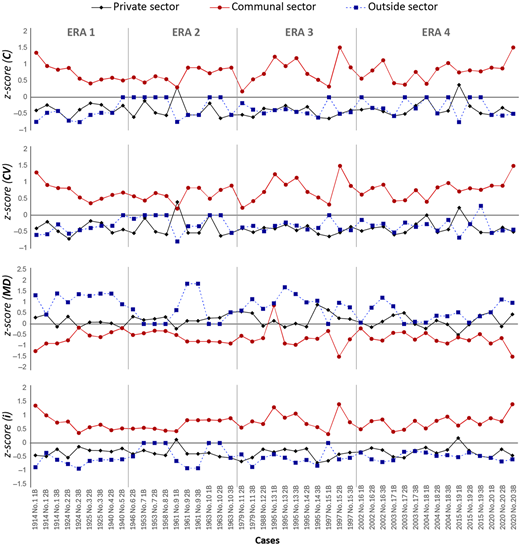
Figure 2 illustrates the standardised syntactic values of three functional sectors (private, communal and outside sectors) across four distinct eras for the 45 cases (see also Table S2 in the Supplementary Material). In terms of connectivity, a degree of fluctuation exists across the eras, with the outside sector consistently showing higher values, especially towards the more recent eras. The private and communal sectors exhibit relatively stable connectivity, with only slight variations over time. For CV, the differences between the functional sectors are less pronounced, though the outside sectors tend to have higher CV values across all four eras. There are occasional spikes, particularly for the private sector, most noticeably between Era 2 and Era 3. The MD data show that outside sectors remain consistently higher across all eras compared to private and communal sectors. Private and communal MD values are relatively steady, with minor fluctuations over time, suggesting a consistent spatial relationship in those sectors across the periods. Lastly, for integration, the graph shows that the communal sectors maintain generally higher i values than the private and outside sectors, which have more subtle variations. The pattern of the outside sector’s “integration” appears more dynamic, especially during Eras 3 and 4.
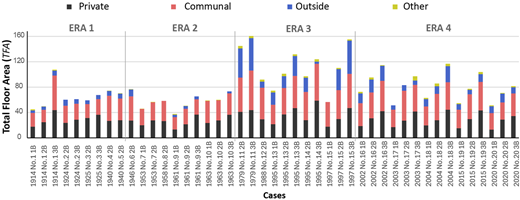
Figure 3 reports TFA values for different functional sectors, segmented across the four eras. The areas and ratios of each functional sector are reported in Table S3 in the Supplementary Material. As shown in the bar chart, in Era 1, the TFA values fluctuate modestly, with a peak of 107.57 m2 in “1914 No.1 2B”, indicating larger private and communal spaces compared to other cases in the same era. The trend in Era 2 shows a general increase in TFA, with a notable peak in “1961 No.9 1B”, where private sectors dominate the space, followed by a decline in “1963 No.10 1B”. Era 3 sees a considerable rise in the TFA, particularly in “1995 No.13 2B”, which shows the highest TFA of 160.68 m2, driven primarily by increased communal and outside sectors. This era also shows a more varied distribution of private, communal and outside sectors compared to previous periods. Finally, Era 4 maintains a relatively stable TFA, with slight fluctuations. However, “2015 No.19 1B” stands out with a peak of 103.87 m2, reflecting a balanced distribution between private and communal sectors. In summary, the figure highlights a trend towards increasing TFA in later eras, particularly in communal and outside spaces, suggesting evolving design priorities over time.
4.2 Computational relationships between syntactic and dimensional data
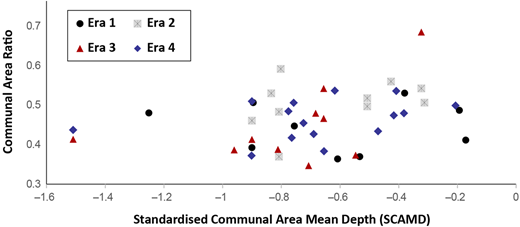
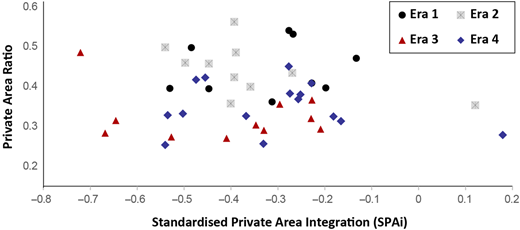
Correlation analysis was conducted to capture the computational relationship between syntactic and dimensional data (see also Table S4 in Supplementary Material). The scatter plots in Figures 4 and 5 also illustrate the relationships. Moderate correlations were observed in the 45 plan layouts between standardised communal area mean depth (SCAMD) and communal area ratio (CAR) (r = 0.344, p < 0.05) as well as standardised private area integration (SPAi) and private area ratio (PAR) (r = −0.386, p < 0.05). Thus, a higher SCAMD is associated with a larger proportion of communal space, while a higher SPAi corresponds to a larger proportion of private space.
There was a moderate positive correlation between TFA and Era (r = 0.326, p < 0.05), suggesting that the size of apartments has increased over time. However, interestingly, a moderate negative correlation exists between the PAR and TFA (r = −0.407, p < 0.01), indicating that the PAR decreases as the TFA increases. In addition, PAR and unit type exhibited a moderate negative correlation (r = −0.356, p < 0.05), meaning larger units (in terms of bedrooms) tend to have lower PARs. There was a strong positive correlation between TFA and unit type (r = 0.604, p < 0.01), confirming the logical result that, as the number of bedrooms increases (from 1- to 3-bedroom units), the TFA also increases. There was a moderate positive correlation between era and TFA and a strong negative correlation with PAR. Additionally, the PAR had a moderate negative correlation with TFA, indicating that while the TFA increases, the PAR goes down over time. This result implies that, while the absolute size of the private area may still increase, it takes up a smaller proportion of the TFA in larger units. The connections between these variables of dimensional data are evident. With the development of modernisation and the widespread adoption of certain equipment (such as central air conditioning, heating, etc.), along with the constant population growth, TFA has shown a positive correlation and a growing trend over time. The open-plan layout (which may include L, D and K) began to appear frequently starting in Era 3. To be more specific, as the TFA increased over time, communal spaces, including semi-public spaces (L and D), semi-private spaces (K) and transfer spaces (C), expanded. In contrast, the proportion of private spaces (B, Ba and T) decreased in relation to the overall floor area, showing a negative correlation.
In comparing dimensional and syntactic data, the CAR and SCAMD show a moderate positive correlation (Figure 4). This indicates that as the CAR increases, the SCAMD also increases. This is likely because larger communal sectors often require more steps (like corridors) to connect different functional spaces, making them spatially “deeper” in the system. Thus, as communal sectors expand, they become less spatially connected and integrated within the housing layout. In contrast, the PAR and SPAi show a moderate negative correlation, meaning that as the PAR increases, the SPAi decreases (Figure 5). This is likely because smaller private spaces (e.g. combined bathroom and toilet spaces) are laid out more efficiently, increasing their integration.
4.3 Socio-spatial patterns over time
In ANOVA, analysis was undertaken to investigate whether the syntactic and dimensional data of the selected housing cases changed across the four eras. The results indicate that TFA (F(3, 41) = 11.837, p = 0.000), SPAi (F(3, 41) = 5.261, p = 0.007) and standardised private area mean depth (SPAMD) (F(2, 27) = 5.822, p = 0.002) show significant differences across the eras, suggesting that these properties of the cases have evolved or changed meaningfully over time (see also Table S5; homogeneous subsets are in the tables in the Supplementary Material). However, the other variables (e.g. unit type, PAR, CAR, etc.) do not show significant differences between eras.
Post hoc tests (Table S5) are employed to accurately identify the significant differences among the variables and control the overall error rate. For the present research, the Duncan test demonstrates that Subset 1, Era 1 (M = 58.3170), and Era 2 (M = 66.0811) are not significantly different from each other. However, Era 1 appears again with a mean of 66.0811, indicating that it overlaps with the mean of Era 4 (M = 80.9280). Era 3 (M = 113.0155) significantly differs from other eras, as it stands alone in a separate subset. In terms of significance, Subsets 1 and 2 share a significance of 0.432, meaning there is no significant difference between them; similarly, Subsets 2 and 3 (Sig. = 0.137) do not have significant differences. The Scheffe and significance test results correspond to the Duncan test, showing the same structure.
The SPAi data of Era 2 is significantly different from other eras, meaning that the accessibility of private spaces (bedrooms and bathrooms) in Era 2 is better compared to other eras. This is because of the rise of modern materials and design paradigms that promoted functional zoning and efficient spatial layouts. Era 1 shares no significant differences with Era 4, but it serves as a bridge between Eras 4 and 3 as per the Duncan results, showing its characteristics are intermediate between these eras. Indicated by both the Duncan and Scheffe tests, Era 1 (M = −3.921) and Era 4 (M = 3.2150) of Subset 2 have no significant differences, whereas Era 2 (M = −4.4655) of Subset 1 shows a strong difference due to its distinct separation. Within Subset 3, Era 1 holds the same mean value as in Subset 2, showing an overlap that bridges the characteristics between Eras 3 and 4. Lastly, the SPAMD data for Era 3 significantly differ from those of Eras 1, 2 and 4, whereas Era 1, 2 and 4 share similar characteristics in the SPAMD results. This implies that Era 3, with its more compartmentalised spaces and duplex-style apartments, caused private sectors to become less accessible compared to communal sectors. This led to higher SCAMD values, meaning communal sectors became spatially deeper in the layout of the units. As shown by both the Duncan and Scheffe tests, Era 3 (M = −0.7914) differs from the other eras due to its distinct separation in Subset 1, once again confirming that the spatial configuration of Era 3, characterised by duplex apartments and more rooms, led to greater depth in the system, distinguishing it from the other eras. In Subset 2, Era 1 (M = 0.14309), Era 2 (M = 0.3319) and Era 4 (M = 0.2505) indicate no significant differences, as they are grouped together. In summary, ANOVA analysis indicated that (1) TFA in Era 3 is significantly different compared to the other eras, (2) SPAMD in Era 3 significantly differs from the other eras and (3) standardised private area integration (SPAi) in Era 2 shows a significant difference from the other eras.
4.4 Typical adaptive-JPGs
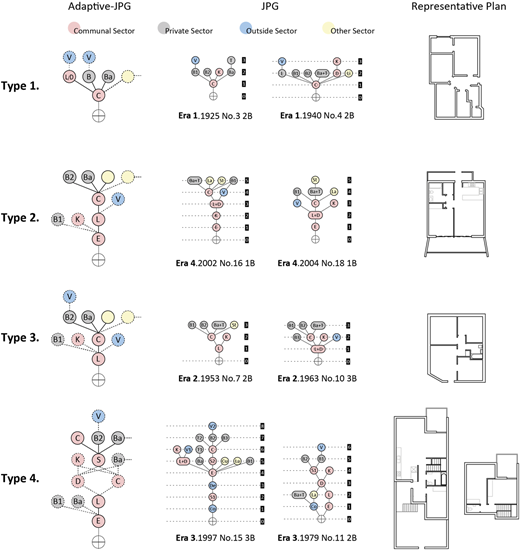
From the 45 JPGs of Sydney’s social housing units, 4 adaptive-JPG types are developed, as illustrated in Figure 6 (see also Table S6). Ranges of syntactic and dimensional properties for four adaptive-JPG types are in Figure S1. Historical JPGs of Sydney’s social housing relating to four adaptive-JPG types in the Supplementary Material).
Adaptive-JPG Type 1 features a corridor as the primary connection space, resulting in a compartmentalised configuration that achieves a well-balanced integration of private and communal sectors. It boasts the highest unit integration among the four genotypes, with an average integration value of 1.3449, being a design optimised for connectivity and accessibility. In contrast, Type 2 has the living room as its primary connection space, incorporating an entrance and a side corridor. This design is more segregated and exhibits a relatively private structure, characterised by a second-lowest integration value of 1.1090, suggesting a greater focus on privacy within the unit. Type 3, also centred on the living room, combines it with a side corridor, creating the most private and introverted of the four designs. It has the highest PAR, averaging 44.47%, and is the second deepest in terms of the private sector. The spatial characteristics indicate a more individualised layout than Type 2, with greater depth and separation. Lastly, Type 4, designed as a dual-level townhouse, emphasises privacy by having the living room serve as the primary connection space. It has the lowest unit integration of the four genotypes, with an average value of 0.9223, reflecting a planning layout that prioritises a secluded and complex layout, further enhancing the sense of privacy within the space.
5. General evaluation and discussion
Socio-spatial factors, especially those related to demography and economy, have shaped the changing architectural paradigms. Changes in dimensional data (the area ratios of different functional sectors) lead to changes in syntactic data (e.g. the integration, connectivity and MD of different functional sectors). Meanwhile, the primary demographic groups applying for social housing in Australia include highly vulnerable individuals with lower socioeconomic status, people with health problems and disabilities, the elderly, single-parent families and Indigenous Australians (Freund et al., 2023; NHSAC, 2024; Pawson and Lilley, 2022). Social housing is intended to provide critical support for individuals and families facing financial hardship, health issues or social challenges, acting as a key “safety net” (Prentice and Scutella, 2020). Given that different family structures have varying needs, it is essential for future social housing to integrate past housing paradigms to offer more diverse and inclusive design solutions. By drawing on historical models while addressing contemporary social dynamics, future housing developments can better accommodate a broader range of households, ensuring that social housing remains adaptable and responsive to changing societal needs. For this reason, this research has proposed four typical adaptive-JPGs in Figure 6, which were developed from the JPGs of Sydney’s social housing units over time.
In Era 1, the consistent application of Type 1 (see Figure 6) with compartmentalised spaces dominated due to practical factors, like fire prevention in kitchens. Over time, advances in materials and technology reduced the need for enclosed spaces such as cupboards, sculleries and open fireplaces. By Era 2, Type 3 layouts became common, influenced by large property developers, population growth, shifting family structures and increased homeownership. Open-plan layouts gained popularity, especially in private and commercial housing, as communal sectors grew larger and more integrated. For example, living, dining and kitchen spaces often merged into a single open space, unlike earlier layouts that kept the kitchen partly separated by partitions or furniture (see Type 2 in Figure 6). This layout also created greater “depth” within the unit by increasing the steps needed to access all communal sectors.
As illustrated in Figure 3, the TFA in Era 3 is generally higher than in other eras, driven by the post-World War II economic boom and advancements in construction technology, such as concrete slabs and columns, which facilitated the development of larger apartment buildings. These apartments became more cost-effective in response to rising population and land costs. During this period, demographic and economic changes popularised dual-level apartment units (see Type 4 in Figure 6), resulting in a deeper private space (B + Ba) with a relatively greater SPAMD value. Furthermore, these private functional rooms established more topological connections with communal sectors, including staircases and corridors, leading to increased standardized private area connectivity (SPAC) values. With the rise of modernisation, the elimination of small, non-habitable spaces and the post-war surge in immigration and marriage rates, Era 2’s layouts managed to maintain privacy in private spaces while beginning to explore larger open spaces. Consequently, the accessibility of private areas (SPAi) in Era 2 improved compared to Era 1, which had overly centralised corridors (high integration); Era 3, with its numerous duplex cases (low integration) and Era 4, which excessively emphasised openness (high integration).
These typical adaptive-JPGs provide valuable insights into how past designs responded to social dynamics, offering lessons that, combined with contemporary insights, can guide future housing developments to accommodate diverse households and remain adaptable to evolving needs. For example, single professionals might prioritise the efficient use of space and time. In this case, the highly concentrated spatial configuration from Era 1 (see Figure 6, Type 1, and the corresponding layout, Case 3 2B) could serve as an inspiration for future designs, providing compact yet functional living arrangements suited to modern urban lifestyles. In contrast, individuals with disabilities, whether living alone or with a caregiver, require large, open spaces to allow for flexible movement and activities. Therefore, the design principles from Era 4, which blend expansive communal sectors with smaller private rooms to ensure high accessibility and integration of all functional sectors, offer a valuable reference point (see Figure 6, Type 3, where the living room is the primary space). This approach ensures that future social housing designs meet the needs of disabled occupants by fostering both accessibility and inclusivity.
Families with multiple children require privacy between adults and children, as well as a space that accommodates children’s activities. While all eras feature multiple bedrooms, Era 3’s spatial configuration is distinct due to the widespread adoption of dual-level apartments. In this layout, auxiliary bedrooms (e.g. Bedroom 2 and Bedroom 3) and bathrooms/toilets (e.g. Bathroom 2 and Toilet 2) are often situated on the first level. At the same time, communal sectors (e.g. living and dining room) are located on the ground floor. This layout has a relatively higher spatial depth due to the inclusion of staircases and corridors that connect these auxiliary functional rooms. Such a configuration improves privacy by creating more separation between private and communal spaces, which could be a preference for families with multiple children. Additionally, while current social housing stock in Sydney is often associated with poor living conditions and overcrowding, future designs must address not only affordability but also physical and mental well-being. The unique trait of Era 3’s configuration, better zoning for isolation and privacy, could reduce the transmission of illnesses and offer residents more mental comfort. To be more specific, the clear distinction between primary and auxiliary spaces in both private and communal spaces (e.g. master and auxiliary bedrooms, living room and multiple corridors) makes it suitable for future housing design, especially in response to pandemics like COVID-19 (see Type 4, the dual-level case, in Figure 6 and the layout of Case 15 3B). For couples or single-parent families (with one child), an open space and transition spaces (corridors) are needed to ensure appropriate accessibility (integration) of private sectors. Therefore, Era 2’s adaptive-JPG could be resurrected in future designs (see Type 3 in Figure 6 and the layout of case 7 1B).
The open-plan layout, which integrates communal functional rooms (living and dining rooms, kitchens) into a single zone, has dominated since the post-1940s period, particularly during Era 3 (1970–1999). In response to contemporary lifestyles, this strategy will likely continue, as the findings indicate a moderate positive correlation between TFA and CAR. On the contrary, the PAR decreases when TFA increases, as these two syntactic properties share a moderate negative correlation. This trend may continue due to rising land costs and population growth, particularly in dense urban environments like Sydney. It may also lead to a design focus on more efficient and adaptable private sectors (bedrooms, bathrooms and toilets). In Era 3, the increased SCAMD indicates an increasing complexity of spatial configurations. The dual-level unit design that emerged during this era is commonly incorporated into modern townhouse designs. This trend might continue in terms of the advancements in construction technology, population increase and pandemic prevention in the future. The modern design of private spaces (bedrooms, bathrooms and toilets) displays a trend towards more integrated spaces, where private rooms have neighbouring communal functional rooms (e.g. corridors and living spaces). Higher private area integration (SPAi) could be a future design focus, shaping the balance between openness and privacy through better spatial integration of private and communal sectors. Due to the limited sample size, the results may not be fully accurate or representative. For precision, further research with larger samples is recommended.
Property developers follow standardised apartment layouts in their designs, which meet minimum regulations and save costs. However, a highly integrated unit does not necessarily mean a good design. In a building layout, rooms or areas with higher MD might be more private or less accessible, which could be desirable for functions requiring seclusion or security. Proper isolation at home has recently been considered an important discussion, especially after the COVID-19 pandemic. Many researchers studying social housing have proposed the idea of a flexible layout (using sliding doors or movable partition walls) in response to the isolation issue and the ongoing unfit and/or unhealthy layout design in Sydney (Yang et al., 2024). However, this may ensure a variety of spatial configurations and high accessibility, but it does not fundamentally solve the noise problem in the home (considering that materials such as sliding doors are not soundproof), let alone the perception of safety and/or privacy. There is no “best” layout for social housing because different family structures and needs must be met. However, from a typical adaptive-JPG perspective, spatial configurations that combine open spaces with corridors tend to adapt more broadly to various situations, as they could comprehensively address privacy and house daily activities.
6. Conclusion
This research has examined the social and spatial changes that have occurred in the planning of apartments in Sydney social housing over time. Specifically, this paper has revealed (1) a growing trend towards open-plan layouts, (2) a decrease in PAR over time, (3) the increasing complexity of spatial configurations starting from Era 3 and (4) a recent increase in private area integration.
In densely populated cities like Sydney, future social housing design should focus on the efficient use of space, particularly in the arrangement of spatial depth and accessibility to cater to the diverse needs of households. Large, open communal spaces can promote social interaction and flexible use, while private sectors should be optimised for efficiency, with an emphasis on enhancing their connectivity to communal spaces. Incorporating slightly more complex spatial configurations may also provide greater flexibility in space usage.
This paper contributes to the understanding of social housing design by offering insights into the evolution of socio-spatial patterns across four historically and socially defined eras. It highlights significant design shifts, including the increasing use of open-plan layouts, the declining proportion of private space and the growing complexity of spatial configurations in more recent housing developments. The study shows how changes in apartment layouts reflect broader shifts in household structures, design norms and expectations of shared living. Through the computational analysis of syntactic and dimensional properties in 45 social housing apartments, the study identifies specific trends such as higher integration in communal areas and deeper spatial arrangements in duplex-type dwellings. These findings not only reveal how spatial configurations have changed over time but also underscore the need to balance openness with privacy, especially in high-density housing environments.
The adaptive-JPGs presented in this study provide a novel approach to visualising the representative spatial structure of social housing. These models can support design thinking and inform future planning by revealing typical spatial logics and their evolution. They also provide digital design knowledge that can guide the development of housing solutions that are both spatially efficient and socially responsive. Looking ahead, the methodology and findings of this research can be extended through the analysis of larger and more diverse housing datasets across different geographic and policy contexts. Further research could also explore how these spatial patterns influence lived experience, well-being and long-term adaptability in social housing. In this way, the study lays a foundation for evidence-based design approaches that better meet the evolving needs of diverse households.
The supplementary material for this article can be found online.