


This exploratory study examined the usage of a Bayesian network to evaluate the teaching performance of university teaching assistants in an e-learning (or e-training) session. The researchers built a 3D virtual realitybased classroom for teaching training, and collected performance data from 23 volunteer international teaching assistants. The researchers assessed the teaching performance of lecturing, interaction with students, and classroom management, and developed a data-driven competency model. We coded the recorded teaching performance data every 30 seconds, and used the coded frequency of each teaching facet performance to calibrate the conditional probability tables for the Bayesian network development. The outcome network would potentially help the development of an intelligent agent that evaluates a teaching assistant’s real-time teaching performance and adaptively provides varied scaffolds or prompts. We examined this specific case as an example of mining the data generated in a 3D virtual reality-based e-learning environment for both instructors and learners.
Introduction
In many American universities and colleges, academic departments are hiring numerous graduate students to work as teaching assistants (TAs). The teaching assistants share the university teaching loads. In addition, serving as teaching assistants may help prepare the graduate students, especially doctoral students, for possible future faculty work. Spalter-Roth and Scelza (2009), based on the American Sociological Association’s (ASA) survey of department chairs from 549 departments of social programs across the country, report that 22.7% and 16.7% of departmental courses were taught by graduate teaching assistants between 2001 and 2006. If considering courses mentored or assisted (not directly taught) by the TAs, we may anticipate even higher percentages accordingly. Graduate students at American universities come from all over the world, and bring cultural diversity to those campuses. However, international graduate-level students differ in culture background and teaching abilities. It is critical to evaluate, train, and prepare them for varied teaching tasks in a classroom (Arshavskaya, 2015; Zhou, 2009). Many universities organize workshops or training sessions for teaching assistants to promote their teaching skills. Normally, such workshops and training sessions place a lot of demands on physical space, manpower, time management, and other resources. For instance, at the university of one of the authors, one specific office in the graduate school is in charge of the orientation and training for new international teaching assistants. The orientation and training takes place in classrooms, and the international TAs will receive the orientation and training in a cohort manner at some prescheduled time throughout the semester.
E-learning may be a solution to train the TAs, as it helps save manual and physical resources. In recent years, modern information and communication technologies have enabled computer systems to replicate or mimic the real world in a 3D environment. An example is virtual reality (VR), a computer-generated system in which users are able to interact with the combination of computer-generated models and simulations (Pan, Cheok, Yang, Zhu & Shi, 2006; Virtual Reality, n.d.). Computer network technology also enables people around the world to share common educational resources in an e-learning environment. Moreover, modern e-learning is not only online web-based texts and videos, but may also incorporate the interactive 3D VR-based scenarios. Researchers and practitioners across disciplines, like medical science and educational technology, have been applying VR in different circumstances. Adamovich, Fluet, Tunik, and Merians (2009), Cho et al. (2013), Nagendran, Gurusamy, Aggarwal, Loizidou, and Davidson (2013), and Sugden et al. (2012) utilized VR in surgical, muscular, and rehabilitation trainings. Barkand and Kush (2009), Ke et al. (2015), Vogel, Greenwood-Ericksen, Cannon-Bowers, and Bowers (2006), and Xu and Ke (2016) conducted VR-based instruction and training to a variety of students and learners. A 3D VR environment may provide the users with a sense of immersion or presence (Steuer, 1992). Such an environment may motivate and engage its users (Bouta & Retalis, 2012; McGrath, Wegener, McIntyre, Savage, & Williamson, 2010; Pan et al., 2006; Tiala, 2007), and may also facilitate conceptual comprehension and skills practice by offering audio, visual, and tangible experiences (Tolentino et al., 2009).
E-learning is essentially a digitalized learning solution that produces a large amount of electronic data. The data may provide us with technical, pedagogical, and social information about the participants, and their actions, in the e-learning context. Researchers and practitioners in different disciplines are interested in mining the data from diverse perspectives. In education research, people are curious about mining e-learning data to examine how learners perform in a learning scenario, interact with the learning materials and the peers, and to determine whether there are any learning effects (e.g., Dominguez, Yacef, & Curran, 2010; Dráždilová, Martinovic, Slaninová, & Snášel, 2008; Farhan, Zahra, Iqbal, & Aslam, 2014; Mohamad & Tasir, 2013). In our study, we constructed a 3D virtual classroom to provide teaching training for international teaching assistants from varied academic disciplines. The current article focuses on exploring the potential of using data mining or learning analytics methods to evaluate a TA’s teaching competency so that one can design and develop learner-adaptive scenarios and scaffolds for future TA training.
Two popular 3D VR platforms, SecondLife and OpenSimulator, are frequently used by researchers in the instructional technology field for education and training purposes. SecondLife is a commercial for-profit platform that provides 3D VR services, in which thousands of VR environments with different themes exist. OpenSimulator is a noncommercial open source 3D VR platform that offers similar functionalities as SecondLife, and is free. We hosted our own OpenSimulator platform and created a virtual classroom that resembled a variety of real university teaching scenarios. In a teaching training session, we asked one international TA to play the role of a teacher. The TA gave a mini lecture on a topic of his/her own expertise to a group of virtual students. Each TA had an avatar in the virtual classroom. Microsoft Kinect was used to capture and broadcast a trainee’s live body gestures and movements in the virtual classroom. Such embodied interactions were designed to enhance the immersion of the training environment. We called this training setting a mixedreality immersive learning environment (MILE). One of our ultimate goals in this MILE project was to make a “smart” virtual classroom that could adjust its training scenarios in real time according to how a TA performed teaching. In other words, we aimed to add some basic artificial intelligence into the system so that the training session was able to adjust itself to accommodate the TA’s varied teaching competencies. To realize it, we needed to evaluate the teaching competency of a TA during the training session so that the training scenarios or tasks could be adjusted.
We employed Bayesian networks to accomplish the aforementioned goal of data-driven teaching evaluation. A Bayesian network (BN) is a combination of statistics and graph theories. It provides a means of visualizing a complex probability distribution through a graph that encodes the conditional independence properties (Almond, Mislevy, Steinberg, & Yan, 2015; Ben-Gal, 2007; Millán, Loboda, & Pérez-de-la-Cruz, 2010). It maps the conditional probabilities and joint probabilities of the evidential events into directed acyclic graphs, which is popular in research fields like statistics, artificial intelligence, and machine learning. In a BN, each node represents a random variable of interest, and the directional edges disclose the probabilistic relationships and dependencies among the corresponding nodes. The mathematical deduction of BNs is rigorous, and the calculations are intuitively understandable. Normally, the marginal and conditional probabilities in a BN are calculated and estimated by existing computational methods and models, and the complexity of calculation is often a matter of the scale of the network (nodes of interests involved and interconnected). As the calculation power of computer technology increases dramatically, BNs become more and more cost-efficient in solving problems like prediction and assessment across disciplines. In the field of education, BNs have been widely adopted in evaluating learners’ attitudes and behaviors (Arroyo & Woolf, 2005; Xenos, 2004), modeling students’ learning styles (Carmona, Castillo, & Millán, 2008; García, Amandi, Schiaffino, & Campo, 2007), and assessing students’ learning effects (Millán, Descalço, Castillo, Oliveira, & Diogo, 2013; Wang, Shute, & Moore, 2015).
For this study we constructed a simple BN and applied teaching performance data from 23 volunteer TAs to train the network. The outcome network, in future, can act as an intelligent agent that evaluates an incoming TA’s real-time teaching performance so that different training scenarios or tasks can be assigned to the TA adaptively based on his/her teaching performance levels (high, moderate, and low in this study).
Methodology
The MILE Settings
The purpose of the study discussion in this article was to explore the usage of a BN to evaluate international TAs’ teaching competency in an MILE training session. The MILE consisted of a virtual classroom as shown in Figure 1.
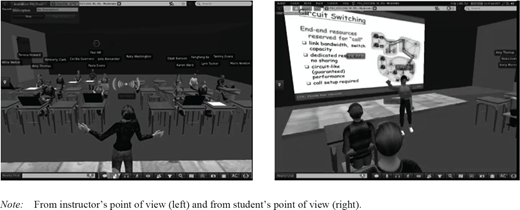
The TA practiced lecturing in the virtual classroom. At the same time, the TA was also prompted to interact with the students and to manage classroom issues. Using OpenSimulator and Kinect, the TA could control his/her avatar teacher to talk and to move in real time. As Figure 1 shows, there were also virtual students in the same classroom. Most of the students were computer-generated nonplayer characters programmed to interact with the teacher at a randomly selected sequence. Others were live ones controlled by peer trainees who would challenge the avatar teacher based on the lecturing content and performance. The study recorded all instances of the TAs’ teaching performance within the virtual classroom and utilized the data for the analyses.
The Participants
Twenty-three international teaching assistants (12 female and 11 male) participated in this study as volunteers. Among the participants, four were master’s level students and 19 were doctoral level students. In one teaching session, a TA lectured on a topic of his/her choice for about 20 minutes. Two researchers were on-site doing the in-field observation and monitoring the technical issues. All participants’ teaching sessions were screen and video recorded.
Variables of Interest and Competency Model Development
Researchers have been examining teaching competencies for a long time (e.g., Carter, 1990; Seung, 2013; Wilkerson & Irby, 1998). Traditionally, focus has been placed on teaching competencies as evidenced in various teaching tasks, such as the mastering of content knowledge, communicating with students, engaging students effectively, managing the classroom, evaluating learning achievements, and so on. Based on a review and synthesis of the existing literature on teaching competencies, the current study tried to evaluate the teaching competency via three major facets— lecturing, interaction with students, and classroom management. We conducted a qualitative, categorical analysis of the recordings of participants’ teaching performance to synthesize core categories of tasks (or evidential skills) for each of the three facets. Based on the literature and the coding results, we constructed an initial competency model of teaching competence. Lecturing consisted of four subskills: content structuring, contextualization, lecture aids and gesturing. Interaction with students comprised two subskills: checking on understanding of students and answering questions. For classroom management, we found four modes in which the TAs dealt with classroom management issues: normative, coercive, retreatism, and remunerative (Ratcliff et al., 2010). We then constructed our BN based on the data related to these entries.
Construction of the Bayesian Network
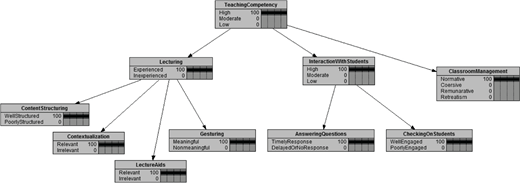
We aimed to build a BN that graphed the marginal and conditional probability distributions among the variables of interest. The nodes in the BN represented the variables, and the unidirectional arcs among the nodes demonstrated how the variables were dependent on each other (Almond et al., 2015; BenGal,2007; Millán et al., 2010). In our network, the first level node, teaching competency, was the focus competency (or construct). We regarded lecturing, interaction with students, and classroom management as the three major components of teaching competency and made them the second level nodes in the BN. The third level nodes consisted of six componential variables. The three levels of variables form the competency model for the study. Table 1 shows the detailed competency model with the levels of variables.
| First Level Node | Second Level Nodes | Third Level Nodes |
|---|---|---|
| Teaching competency | Lecturing | Content structuring |
| Contextualization | ||
| Lecture aids | ||
| Gesturing | ||
| Interaction with students | Answering questions | |
| Checking on students | ||
| Classroom management |
It was necessary to build the attributes for each node. Summarizing views from the experienced teachers and the literature (e.g., Ratcliff et al., 2010; Seung, 2013), we decided to associate the following attributes to each node:
Teaching competency—high, moderate, low
Lecturing—experienced, inexperienced
Interaction with students—high, moderate, low
Classroom management—normative, coercive, remunerative, retreatism
Content structuring—well structured, poorly structured
Contextualization—relevant, irrelevant
Lecture aids—relevant, irrelevant
Gesturing—meaningful, nonmeaningful
Answering questions—timely response, delayed/no response
Checking on students—well engaged, poorly engaged
We assigned binominal attributes to a majority of the competency nodes. Most of the corresponding attributes were self-explanatory. For classroom management, we aimed to see how a TA reacted to a student’s misbehaviors (e.g., answering a mobile phone in class) during a lecture. When misbehaviors happened, normative meant a TA followed the general classroom management practice, retreatism indicated a TA simply ignored the misbehavior, coercive implied a TA dealt with the issue with strong force or serious consequences, and remunerative suggested a TA would treat a student for ceasing to do something. For gesturing, we regarded a TA’s visible body movements and gestures as part of the instructional activities. Gestures would facilitate the cognitive process of both presenters and the listeners/learners. So, Sim Chen-Hui, and Low Wei-Shan (2012) studied the gestures, and looked at gestures from two general categories, meaningful and nonmeaningful gestures. Gestures such as representational, metaphoric, and pointing gestures carried semantic meanings or concrete content so that they were meaningful. Beating gestures were nonmeaningful because they only happened with rhythms of the speech discourse, without either concrete or abstract meaning related to the speech content. We examined the TAs’ gestures as meaningful and nonmeaningful during their instructional processes.
With the competency model, we initiated a BN as shown in Figure 2.
Bayesian Network Based on the Competency Model
Bayesian Network Based on the Competency Model
Data Acquisition and CPT Construction
After constructing the competency model and the structure of the Bayesian Network, we then defined the probability distributions for each individual node in the network. For some of the nodes we consulted the experienced teachers for the initial probability distribution. For the rest of the nodes we fed the nodes with the data collected from the 23 participants. The software we used for the BN construction was Netica 64bit for Windows (Version 5.15; Norsys, 2014).
From Experienced Teachers’ Views
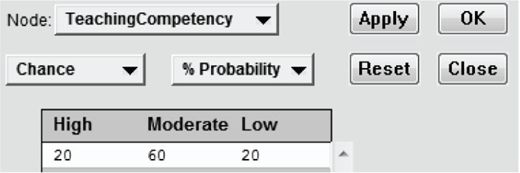
The initial probability distribution table for teaching competency, and the conditional probability tables (CPT) for lecturing and interaction with students came from the review and judgment of a panel of experienced teachers. We supposed that the teaching competency of the volunteer TAs follow a high, moderate, and low distribution of 20%, 60%, and 20%, and assigned the initial probability distribution to the node teaching competency as follows.
Our panel of experienced teachers informed us that TAs with different teaching competencies normally acted differently when lecturing and interacting with students. The panel further helped us set the conditional probabilities for such two competencies based on their experience. For example, for TAs with high teaching competency, 90% of their performance was experienced in lecturing, and they showed a high (90%) degree of interactions with the students. For TAs with moderate teaching competency, 50% of their performance was experienced, and they acted well (75%) when interacting with students. Empirically, the TAs’ performance followed the following conditional distributions.
From the Collected Data
All the other CPTs for the rest of the nodes originated from the data collected from the 23 participants. We carefully analyzed the video recordings of all the lectures and made an Excel sheet based on the competency model as shown in Table 2. We then observed and coded what a TA did every 30 seconds. Whenever a TA’s instructional activity fell into an entry during a 30-second period, we marked the corresponding place on the checklist with a “1”and listed the evidence.
| Video Source: (TAName)_Teaching and Refleciton_VideoCam_Big Screen_best data_090920. mp4 | ... | Time Stamp i | Time Stamp i+1 | ... | ||||
|---|---|---|---|---|---|---|---|---|
| Competency | Subskills | Attributes | ... | Action check | Evidence (Salient observation notes or quotation from participants) | Action check | Evidence (Salient observation notes or quotation from participants) | ... |
| Lecturing | Lecturing aids | Relevant | ... | 1 | “next slide is ...” (reading/explaining the texts on the slide) | ... | ||
| Irrelevant | ... | 1 | Sth. unrelated | ... | ||||
| Content structure | Well structured | ... | 1 | “The third step I am going to talk about is ...” | ... | |||
| Poorly structured | ... | ... | ||||||
| Contextualization (e.g., using examples) | Relevant | ... | 1 | “If one day you are going to be a teacher, ... someone just STAND and SIT DOWN ...” | ... | |||
| Irrelevant | ... | ... | ||||||
| Gesturing | Meaningful | ... | 1 | Showing the body movements of STAND and SIT DOWN. | ... | |||
| Nonmeaningful | ... | ... | ||||||
| Student interaction | Checking on students | Well engaged | ... | 1 | “Alright, does this answer your question?” | ... | ||
| Poorly engaged | ... | 1 | ... | |||||
| Question-answering | Timely response | ... | 1 | “What is it Paula?” “Paula, go for it.” | ... | |||
| Delayed or no response | ... | ... | ||||||
| Class management | Normative | ... | 1 | “IT’S OK, because we are college students. BUT...” | ... | |||
| Coercive | ... | 1 | “Don’t do that!”/”Go downstairs. You should go OUT.” | ... | ||||
| Retreatism | ... | ... | ||||||
| Remunerative | ... | ... | ||||||
Marginal Probabilities of Teaching Competency
Marginal Probabilities of Teaching Competency

Conditional Probabilities for Lecturing and interaction With Students
Conditional Probabilities for Lecturing and interaction With Students
When starting to code, we randomly picked up video recordings from 8 participants and independently coded them based on the coding protocol. We then sat together and discussed each of our own coding entries one by one until we reached the consensus on each single entry. By doing so, all coders developed a common understanding of our coding protocol and achieved interrater reliability when coding the rest of the data. We then randomly divided the other 15 recordings into 3 equal parts and each of us independently coded 5 recordings.
After coding each TA’s teaching performance, we constructed another Excel sheet with cumulative counts of each type of action for all the TAs, as shown in Table 3. For each TA, we were interested in the action frequency counts and percentages. For instance, for contextualization, a TA would normally give some examples or provide some scenarios to help students understand certain ideas. We evaluated whether the example or scenario was relevant to the content or not, and marked the corresponding places. By adding all the numbers together, we got the sum of the instructional actions related to contextualization.
| ... | TA k | TA j | ... | |||||||
|---|---|---|---|---|---|---|---|---|---|---|
| Competency | Subskills | Attributes | ... | Action Counts | Individual Sum | Percentage | Action Counts | Individual Sum | Percentage | ... |
| Lecturing | Lecturing aids | Relevant | ... | 9 | 81.82 | 4 | 66.67 | ... | ||
| Irrelevant | ... | 2 | 11 | 18.18 | 2 | 6 | 33.33 | ... | ||
| Content structure | Well structured | ... | 8 | 88.89 | 8 | 72.73 | ... | |||
| Poorly structured | ... | 1 | 9 | 11.11 | 3 | 11 | 27.27 | ... | ||
| Contextualization (e.g., using examples) | Relevant | ... | 12 | 80.00 | 23 | 82.14 | ... | |||
| Irrelevant | ... | 3 | 15 | 20.00 | 28 | 17.86 | ... | |||
| Gesturing | Meaningful | ... | 23 | 53.49 | 20 | 38.46 | ... | |||
| Nonmeaningful | ... | 20 | 43 | 46.51 | 32 | 52 | 61.54 | ... | ||
| Student interaction | Checking on students | Well engaged | ... | 3 | 100.00 | 4 | 66.67 | ... | ||
| Poorly engaged | ... | 0 | 0.00 | 2 | 6 | 33.33 | ... | |||
| Questionanswering | Timely response | ... | 6 | 85.71 | 6 | 75.00 | ... | |||
| Delayed or no response | ... | 1 | 7 | 14.29 | 2 | 8 | 25.00 | ... | ||
| Class management | Normative | ... | 2 | 28.57 | 4 | 44.44 | ... | |||
| Coercive | ... | 3 | 42.86 | 3 | 33.33 | ... | ||||
| Retreatism | ... | 0.00 | 0 | 0.00 | ... | |||||
| Remunerative | ... | 2 | 7 | 28.57 | 2 | 9 | 22.22 | ... | ||
If the cumulative numbers of relevant and irrelevant contextualization were x and y respectively, we reached the two percentages of relevant and irrelevant actions by dividing them with the sum, x/(x+y)%, and y/(x+y)%. For example, in Table 3, 80% of TA k’s efforts to offer the students a proper context were relevant, whereas 20% were irrelevant. For those subskills without observations at all, we treated them as uniformly distributed (½to ½in our case). The same strategies applied for every TA’s lecture analysis.
According to the law of large numbers, when we have enough or a large number of samples (n), we may use the frequency of the occurrence of a certain event to represent the probabilities of that event. In our case, the 23 participants might not be regarded as large numbers, but we may still use the frequencies (the percentages) of the different entries/events to approximate the corresponding probabilities. Specifically, we used the frequency or percentage by which a TA performed each of the actions to construct the corresponding CPT of each node. First, we judged into which category a TA falls at the top level, i.e., whether his/her teaching competency was high, moderate, or low.
We used two criteria to categorize the participants. Criterion one related to the opinion of experience teachers on the teaching competency distribution (20%, 60%, and 20%). For criterion two, we added all the percentages related to the positive performances of each TA and sequenced them in descending order. We picked the four TAs with the highest cumulative positive percentages as the participants with high teaching competency, and five TAs with the lowest cumulative positive percentages as the ones with low teaching competency. The other 14 participants fell into the category of TAs with moderate teaching competency. Pursuant to this, we calculated the CPTs for the second-level nodes.
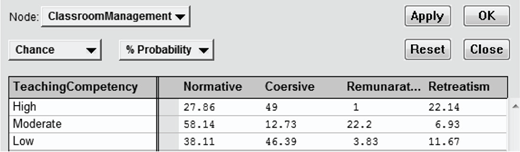
Using Classroom Management as an example, for those five TAs with low teaching competency, we added their cumulative frequency counts and percentages in each of the four attributes and took the averages (Table 4).
| Attributes | Cumulative Frequencies | Averages (Divided by 5) |
|---|---|---|
| Normative | 20% + 25% + 55.56% + 0 + 90% | 38.11% |
| Coercive | 40% + 37.5% + 44.44% + 100% + 10% | 46.39% |
| Retreatism | 6.67% + 12.5% + 0 + 0 + 0 | 3.83% |
| Remunerative | 33.33% + 25% + 0 + 0 + 0 | 11.67% |
We did the same for those TAs with high and moderate teaching competencies. We then filled in the CPT for classroom management with the average results accordingly, as shown in Figure 5. We applied similar strategies to every other node to create their individual CPT tables.
Conditional Probability Table for Classroom Management
Conditional Probability Table for Classroom Management
After compiling, we succeeded in training our BN with the existing data.
Discussions
Interpretation of Results
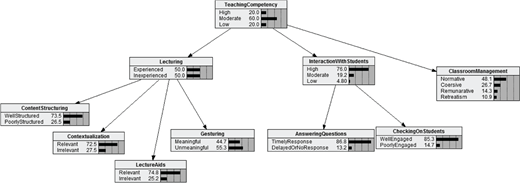
With the help of Netica (Version 5.15; Norsys, 2014) software, we constructed a graph with the nodes as listed in the competency model, and filled in each node with the corresponding marginal and conditional probabilities. After compiling, we developed the BN as shown in Figure 6.
The Bayesian Network in the MILE TA Training Project
The Bayesian Network in the MILE TA Training Project
From the tree-shaped network, we can see the relationship among the nodes. More importantly, from bottom up, we can estimate the instant performance of each node based on the attributes of the lower level nodes, because each of the nodes is related to the others through the conditional probability distribution. Within a certain time period, when the performance of a TA is fed into, and calculated, by our network, we can estimate how the TA is performing in teaching during that time period, so that we will adjust the training scenario and scaffolding accordingly.
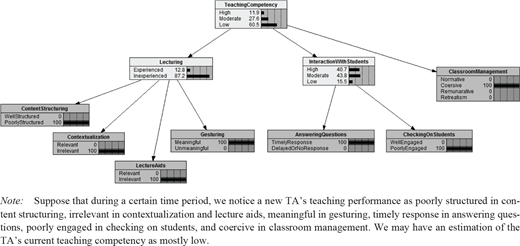
To explain this further we present a scenario. Suppose that during a certain time period, we notice a new TA’s teaching performance as poorly structured in content structuring, irrelevant in contextualization and lecture aids, meaningful in gesturing, timely response in answering questions, poorly engaged in checking on students, and coercive in classroom management. When we adjust the corresponding nodal attributes in the network, we may notice that there is an 87.2% probability that the TA is potentially inexperienced in lecturing, and a 43.8% probability that a TA has moderate abilities to interact with students. We may further come to an estimation of the TA’s current teaching competency as mostly low with an estimated probability of 60.5%, as shown in Figure 7. For the future, we can adapt the training scenario with more practice activities and challenges to accommodate such a TA with low teaching competency.
Example of utilizing the Bayesian Network
Example of utilizing the Bayesian Network
Implications
The current article reports on an exploratory study on the usage of BNs to analyze the electronic data of a VR-based e-learning project, and to evaluate the target competency. This specific case can act as an in situ example of mining the data generated in a 3D VR-based e-learning environment for both instructors and learners.
In the current information age, data is the most frequently discussed term. Thanks to the increasing computational capabilities of computers, enlarging capacities of storage devices, and the expanding Internet, a tremendous amount of data is produced every second on this planet. How to analyze and make the data “talk” becomes crucial in today’s digitalized world. In the education field, modern-day elearners take advantages of the vast opportunities offered through computerized instructional and learning solutions. New technologies such as virtual reality provide extended possibilities to e-learners either in distance or local settings. Whenever interacting with an e-leaning system, e-learners will leave their digital foot prints (i.e., metadata), and these can be mined by researchers for all sorts of information. At the same time, people across disciplines have been exploring artificial intelligence, machine learning, and smart solutions that essentially utilize data and corresponding algorithms to assess, evaluate, and make decisions. Educational researchers have also been trying to understand and interpret the data that e-learners create, and to make use of this data to generate adaptive and better instructional activities (e.g., Millán et al., 2010; Schiaffino, Garcia, & Amandi, 2008; Xenos, 2004).
Limitations and Future Work
All studies have limitations. For this study, we relied on the perspectives of the experienced teachers in categorizing teaching competency into varied entries, counting the frequencies of the TAs’ actions, and setting up initial probability tables. Teachers may normally employ different types of instructional tactics and strategies in their daily teaching activities. There is a reasonable probability that the expertise and advice we received from our panel of experienced teachers could differ from that of the other teachers. At the same time, since the participating TAs came from different countries and varied in their disciplines, there could be other variables that might mediate the evaluation of teaching competency. The competency model table in this study was simplified to ease calculation. Consequently, the structure of the outcome BN lacked further relationships among the nodes. The training data from 23 participants may not be enough for the network to converge satisfactorily. And for the data analysis, assessing the data using a 30-second time unit may also appear to be arbitrary. Quantization error or noise could influence the reliability of the target model. Using a smaller time unit may lead to more abundant and precise data to train the network.
For the future study, we will recruit more participants to collect more infield data to train the network. Moreover, we will differentiate the competency model depending on different disciplines. With the developed BN model, we can construct varied scenarios to accommodate different teaching competencies. We will also further develop this MILE e-learning platform to add data-driven artificial intelligence to make the MILE scenarios and scaffolds selfadaptive to a TA’s teaching performance.
Conclusion
In this study, a VR-based 3D classroom was constructed to train international teaching assistants. We aimed to make such a training more efficient, adaptive, and automatic for both instructors and learners (or trainers and trainees). We quantized the qualitative data from 23 teaching practice sessions by real international TAs, and fed the data into a BN to build a model to evaluate and predict a TA’s teaching competency. Instructors (or trainers) normally work hard to design instruction that will fit learners’ needs, and may adjust instructions according to learners’ running needs. The study findings may inform about the possibility of automatic needs analyses for the instructors, and the affordance as to how basic artificial intelligence may be constructed in an e-learning system to adapt to learners of varied competencies. As for the learners (or trainees), they normally long for instant feedback on their learning activities. This study will inform learners about the approach to analyzing their own learning behaviors instantly, so that they may have a better understanding on how much they lack and what they still need to learn or practice.
In general, this study concentrated on elearners and their performance data in a 3D VR-based learning context. We collected and analyzed the data with a purposeful design, and conceptualized and visualized the data with a simple BN. The study implied possible solutions for the design of data-driven, adaptive, and individualized e-learning systems.
Acknowledgment: We greatly appreciate the contributions of all the volunteer international teaching assistants who spent their time participating in our study. Without any payment or gifts, they performed as though they were in their teaching practice. We also thank Dr. Russel Almond for his doctoral seminar on BNs.

