This study aims to investigate how regulatory frameworks and supervisory mechanisms influence management quality in banking systems, particularly in developing countries.
Using the multi-state Markov (MSM) panel data model, the study analyzes data from 107 banking systems between 2005 and 2021. Management quality is assessed via the cost-to-income ratio (CIR), with emphasis on how regulatory variables such as activity restrictions, deposit insurance, entry barriers, capital standards and supervisory structure affect its transitions.
Results show that stronger supervisory authority and institutional structure have a positive impact on both the CIR and its state transitions, suggesting improved management quality under effective regulation.
The main limitation of this study is its reliance on secondary cross-country data, which may involve reporting inconsistencies and diverse economic contexts. Using the CIR as the only proxy for management quality may overlook other managerial dimensions. Future studies could incorporate additional performance measures and country-specific analyses. The results indicate general patterns rather than causal relationships; therefore, generalization across regulatory settings should be done cautiously.
The findings offer practical insights for policymakers and regulators. Stronger supervision and improved institutional structures enhance efficiency and cost control. Reforms that improve transparency, capital standards and governance can promote banks' long-term sustainability, particularly in developing economies. Managers can also align internal operations with regulatory changes to improve financial performance and risk management.
Stronger regulatory frameworks and higher management quality enhance public trust and financial stability, especially in developing countries. Well-managed banks provide fair, sustainable and accessible services that support economic growth, reduce inequality and strengthen resilience to shocks. This study underscores the societal importance of effective regulation in promoting inclusive and accountable banking systems.
This study goes beyond estimating average determinants of management quality by modeling it as a dynamic multi-state process. Using an MSM panel framework, we quantify how regulatory and supervisory conditions change the probability of transitioning between management-quality states. Relative to Jamali (2019), this study partially replicates the transition-based empirical logic and several regulatory and supervisory explanatory variables, while shifting the dependent process from capital adequacy to CIR-based management quality and extending the analysis to the 2005–2021 period.
1. Introduction
Banking regulations aim to improve banks' performance by setting mandates and restrictions. Core regulatory and supervisory practices include capital adequacy, entry barriers, permissible activities, deposit insurance, supervisory authority and organizational structure (Barth et al., 2001, 2004, 2013a, b). Mismanagement is widely cited as the main cause of bank failures, with Graham and Horner (1988) emphasizing management quality as the key differentiator between failed and successful banks. Efficiency measured primarily through the cost-to-income ratio (CIR) is a central indicator of management quality (Hess and Francis, 2004). Studies by Hess and Francis (2004) provide comprehensive insights into efficiency measurement in banking. Research consistently identifies regulatory and banking policies as major determinants of management efficiency and performance (Hess and Francis, 2004). The regulatory landscape is shifting toward more customized approaches following global financial crises and misconduct issues. Declining globalization, rising trade tensions, technological progress and social priorities such as sustainability increasingly shape regulatory agendas (Strategy, 2020). Recent debates in banking policy suggest that the key issue is no longer whether regulation exists but whether supervisory design and enforcement can translate formal rules into better managerial discipline and operational efficiency. This distinction is especially important in developing economies, where legal rules may be broadly similar on paper yet enforcement capacity, supervisory independence and institutional credibility differ substantially. In such settings, the effect of regulation on management quality is likely to operate through the quality of supervision rather than through formal rule intensity alone. Consequently, financial institutions must enhance resilience, adaptability and responsiveness to these pressures. This study examines how banking regulatory frameworks affect management quality by addressing two key questions: (1) Which regulatory and supervisory aspects most influence management quality? (2) Can these influences trigger state transitions in management quality? Prior research has explored the impact of regulatory practices on banking performance (e.g. Banker et al., 2010; Delis et al., 2011; Agoraki et al., 2011; Barth et al., 2001, 2004, 2013a, b; Beck et al., 2006; Teixeira et al., 2014; Deli and Iftekhar, 2016; Gordon et al., 2014; Kupiec et al., 2016; Triki et al., 2017).
Using the CAMELS framework, management quality is a key banking performance dimension. Regulations and supervision improve it by restricting non-banking activities, limiting high-risk investments, enforcing capital adequacy and maintaining entry barriers to reduce costs and stabilize income (Pasiouras et al., 2009; Barth et al., 2004; Beck et al., 2006; Banker et al., 2010). The study focuses on which provisions impact CIR categorized into under-capacity (<50%), on-capacity (50–60%) and over-capacity (>60%) (Hess and Francis, 2004) and uniquely examines how regulations drive transitions among these states in developing countries, extending prior research on advanced economies (Chortareas et al., 2012). To clarify the relationship with prior work, our empirical model is built on the extant research by Jamali (2019), which examined how banking regulations and supervisory practices affect capital adequacy state transitions in developing countries. The model includes several explanatory variables employed by Jamali (2019), including capital regulation, supervisory power and supervisory structure. This research therefore replicates Jamali (2019) in part and offers new empirical insights by applying a related transition-based framework to a different dependent variable, namely management quality measured by the CIR, over a different period and with distinct empirical implications.
1.1 Research gaps and motivation
Despite extensive work on bank regulation and supervision, two gaps remain. First, most studies estimate average associations between regulatory arrangements and bank outcomes but provide limited evidence on whether regulation and supervision alter the likelihood that management quality improves or deteriorates over time. Second, this limitation is particularly relevant in developing economies, where institutional capacity and enforcement quality vary markedly across countries and regions. The 2005–2021 period further strengthens the relevance of this question because it spans the global financial crisis, post-crisis prudential reforms and the COVID-19 shock, all of which may have changed how supervisory practices affect managerial efficiency. These gaps motivate our focus on management quality as a dynamic multi-state process rather than a static performance outcome. The gap addressed here is therefore not the absence of a transition-based regulatory model, since Jamali (2019) has already applied such a framework to capital adequacy. Rather, the gap is that prior transition-based work has not examined whether the same regulatory and supervisory dimensions also shape movements in management quality. By focusing on CIR-based management-quality states, this study extends and partially replicates Jamali's (2019) framework in a new outcome domain.
1.2 Research contributions
This manuscript contributes by modeling management quality as a multi-state dynamic process and quantifying how regulation and supervision affect both management quality levels and transition probabilities across states. It also examines whether these effects vary across regions and institutional contexts in developing economies, translating the combined level-and-transition evidence into actionable guidance for regulatory design and risk-based supervision. Using multi-country panel data from 2005 to 2021, a period spanning major shocks and reforms, the study provides a broad evidence base that is rarely assessed jointly in this setting. Specifically, this paper seeks to address the following research questions:
To what extent do changes in regulations and supervisory practices affect the transition intensity matrix of management quality states?
How do the frequency distributions of transitions among management quality states manifest?
How are the transition probabilities of management quality states influenced by regulatory and supervisory changes?
2. Literature review
2.1 Banking regulations and supervisory practices
Barth et al. (2004, 2013a, b) compiled regulatory and supervisory data, mainly from 1999, aggregating survey responses into composite indices. This publicly available dataset serves as the foundation for this study, which adopts their classification framework to analyze banking regulations and supervisory practices.
Regulatory and supervisory conditions are measured using standard BRSS-based dimensions that capture how rules and enforcement shape bank incentives and discipline (Barth et al., 2001, 2004, 2013a, b). Capital requirements are summarized by indicators of overall and initial capital stringency, alignment with Basel risk-weighting and capital-ratio adjustments for credit and market risk exposures (Barth et al., 2004). Banking activity restrictions are included given mixed theoretical and empirical predictions: restrictions may limit excessive complexity (Triki et al., 2017) but can also reduce efficiency, scale economies and diversification, with evidence that overly strict limits may weaken performance (Djankov et al., 2002; Chortareas et al., 2012; Barth et al., 2013a, b). Following Barth et al. (2004), activity regulation covers limits on securities, insurance and real estate activities, as well as ownership links between banks and nonfinancial firms and an overall restrictiveness index (Barth et al., 2004). Entry regulation captures barriers that influence competition and innovation, measured by restrictions on foreign entry/ownership, statutory licensing requirements and the fraction of license applications denied (overall and by foreign vs. domestic applicants) (Ben Naceur and Omran, 2011; Barth et al., 2004). Deposit insurance is measured because it can reduce systemic crises yet weaken depositor discipline and encourage risk-taking; we use deposit insurer power, the ratio of insurance funds to total bank assets, and a PCA-based moral-hazard index (Barth et al., 1991, 2004). Supervisory enforcement is captured by official supervisory power (prompt corrective action, restructuring and insolvency authority), supervisory forbearance discretion and loan classification/provisioning stringency (Barth et al., 2004). Jamali (2019) used the Barth-Caprio-Levine regulatory and supervisory classification to study capital adequacy state transitions in developing countries. The present study draws on that prior work as a methodological and empirical foundation, particularly in the use of several regulatory and supervisory explanatory variables. However, the present application differs by examining management quality, proxied by CIR, rather than capital adequacy.
Supervisory experience and structure include supervisor tenure, supervisory independence from politics and banks and whether oversight is fragmented across multiple agencies (Barth et al., 2004). Indices are constructed via simple summation of binary items and via PCA using the first principal component (Barth et al., 2001, 2004, 2013a, b).
2.1.1 Recent developments in regulatory and supervisory practices
Recent research reinforces the view that the effectiveness of banking regulation depends not only on the formal stringency of rules but also on supervisory design, information quality and enforcement capacity. Bouteska et al. (2023) show that supervisory powers are positively associated with bank performance, whereas some formal restrictions may weaken performance if they are excessively constraining. Ma and Vadasz (2024) add that prudential regulation also has an informational role, as tighter requirements can alter the signals that banks send to creditors and thereby affect market discipline and incentives. At the cross-country level, De Vita et al. (2024) report that post-crisis prudential re-regulation did not necessarily harm bank cost efficiency, suggesting that tighter prudential frameworks can coexist with operational discipline. In parallel, recent policy work increasingly defines supervisory effectiveness in terms of timely risk identification, credible remediation and risk-based intervention, especially in an environment shaped by digitalization, climate-related risks and geopolitical uncertainty. These developments strengthen the relevance of examining whether supervisory power and structure affect not only the level of management quality but also its movement across states.
Recent developments after our sample endpoint reinforce, rather than weaken, the relevance of this study. The post-2021 period has been marked by the March 2023 banking turmoil, the 2024 revision of the Basel Core Principles for Effective Banking Supervision and a stronger supervisory focus on operational resilience, digitalization, climate-related financial risks, risk data aggregation and geopolitical shocks. These developments suggest that contemporary banking oversight increasingly depends not only on formal rules but also on supervisory credibility, early risk identification and the institutional capacity to enforce remediation. This broader context strengthens our focus on supervisory power and supervisory structure as central determinants of management quality.
2.2 Cost-income ratio and its states
The CIR, calculated as non-interest expenses divided by total income, serves as an “efficiency ratio” reflecting management quality (Hess and Francis, 2004). Recognized by the ABA Banking Journal and Asher (1994) as a key performance benchmark, CIR is used here to assess managerial and operational efficiency. This study examines how banking regulations and supervision affect CIR and whether changes in these frameworks improve management quality. Following Hess and Francis (2004), three CIR-based states are defined: under-capacity, on-capacity and over-capacity utilization. Table 1 summarizes the three CIR-based management-quality states used to classify banking systems in the multi-state Markov (MSM) model.
The CIR-based states underpin the multi-state Markov panel data model (MSM-PDM), which estimates transition intensities and probabilities between states. This allows the study to examine how management quality evolves under different regulatory and supervisory conditions.
2.2.1 Synthesis and research gaps
Prior research has established that regulation and supervision matter for bank outcomes; however, the evidence remains fragmented across three strands. The first strand focuses on average (static) associations between regulatory stringency and performance. The second emphasizes supervisory enforcement and governance but rarely links these mechanisms to management quality as an evolving capability. The third examines efficiency proxies (e.g. cost-to-income) yet typically treats them as levels rather than dynamic movements between better and worse operational states.
Building on these strands, two gaps remain. First, the literature provides limited evidence on whether regulation and supervision shape not only the level of management quality but also the probability of improving or deteriorating over time. Second, because developing economies differ substantially in supervisory capacity and institutional effectiveness, it is unclear whether the same regulatory tools operate similarly across institutional contexts and regions and whether major shocks and reforms imply regime-dependent effects. Addressing these gaps motivated the present study's research questions and hypothesis development.
2.2.2 Theoretical framework and hypothesis development
We conceptualize management quality as an efficiency-oriented managerial capability reflected in banks' operating cost discipline. Drawing on agency theory, regulation and supervision reduce information asymmetries and constrain managerial opportunism, thereby strengthening managerial effort, internal controls and resource allocation and improving operational efficiency. Complementarily, institutional theory suggests that the effectiveness of regulatory and supervisory tools depends on enforcement capacity: where legal effectiveness and supervisory resources are stronger, rules are more likely to translate into behavioral change, whereas in weaker institutional settings regulation may remain largely de jure. This framework directly addresses the study's motivating gaps by linking regulation and supervision to both (1) average management quality and (2) management-quality dynamics. Accordingly, we model management quality as a set of discrete states (based on the empirical distribution of the management-quality proxy) and examine how regulatory and supervisory conditions shape the probability of transitioning from weaker to stronger states (and vice versa) over time. These theoretical mechanisms guide the testable hypotheses presented below.
2.2.3 Testable expectations
E1: Stronger regulation is associated with higher management quality.
E2: Stronger supervision/enforcement is associated with higher management quality.
E3: Regulation and supervision increase the probability of improving transitions (from weaker to stronger states) and reduce deterioration transitions.
E4: These effects are stronger where institutional capacity is higher (or differ across regions).
3. Data and methodology
3.1 Data
The study's sample comprises 107 banking systems across developing countries, spanning the period from 2005 to 2021. This timeframe captures developments following the introduction of the Basel III regulatory framework.
3.2 Variable definitions
The study uses the CIR as the dependent variable within the CAMELS framework (Hess and Francis, 2004). Regulatory and supervisory variables follow Barth et al. (2001, 2004, 2013a, b), while control variables are drawn from World Bank data and prior studies. The general-to-specific (GETS) approach (Jamali, 2019; Clarke, 2014) refines the model by removing insignificant variables to produce a robust final specification. Consistent with the Editor's request for clarification, the empirical strategy should be understood as a partial replication and extension of Jamali (2019). It uses several explanatory variables from that study but applies them to a different dependent variable, a different state classification and a different sample period. Specifically, Jamali (2019) modeled capital adequacy state transitions over 2000–2012, whereas the present study models CIR-based management-quality transitions over 2005–2021.
3.2.1 Management quality
We proxy bank management quality using the CIR, defined as operating expenses relative to operating income. Lower CIR indicates stronger cost discipline and higher managerial efficiency; hence, improvements in management quality are reflected in a decline in CIR.
3.2.2 Control variables
To account for macroeconomic conditions and market structure, we include inflation (INFL) and the log of GDP as country-level controls and the Boone indicator (BOONE) as a measure of competition. These variables capture changes in the operating environment that can affect bank costs and revenues independent of regulation and supervision.
3.2.3 Regulatory and supervisory variables
We measure regulation and supervision using composite indices that capture capital regulation, entry restrictions, permissible activities, supervisory powers and supervisory independence/structure. These indicators operationalize the strength of the regulatory framework and the capacity of supervisors to enforce compliance and discipline managerial behavior.
The GETS procedure starts from a general unrestricted model (GUM) estimated in Stata, using a 90% estimation sample and a 10% holdout for out-of-sample checking. On the estimation sample, the model is repeatedly re-estimated after sequentially removing the least significant regressors (ranked by t-statistics) along multiple search paths (mmm, default five). After each deletion, the specification must pass panel-appropriate diagnostics (including tests for serial correlation in the idiosyncratic errors and a Lagrange multiplier test) and an F-test verifying that the restricted model remains valid relative to the GUM; failing specifications are discarded, and the algorithm moves to the next path. The iterative elimination continues until no further insignificant variables can be removed, after which candidate terminal models are re-estimated on the full dataset and pruned if any remaining insignificant variables persist. The final specification is then selected from the set of terminal models using encompassing criteria or an information criterion. This process ensures an optimized, statistically valid and theoretically sound model, reducing subjectivity and enhancing robustness. Equation (1) presents the final specification of control variables in this study.
Where is the CIR of banking system in year ; is inflation; is the (log) level of economic development; is the Boone indicator of competition; denotes the composite index of regulatory quality; , and represent capital regulation, entry restrictions and activity restrictions, respectively; captures supervisory power/enforcement and captures supervisory independence/structure. and denote (where applicable) entity and time effects and is the idiosyncratic error term. Table 2 provides an overview of all the variables included in this study, encompassing both the main variables and the control variables identified through the general-to-specific (GETS) process.
Although the CIR is widely recognized as a robust indicator of management quality, its use as a single proxy may overlook qualitative dimensions such as strategic decision-making, human resource competence and digital readiness. To mitigate this limitation, we complement CIR with regulatory and macroeconomic control variables that indirectly capture management discipline and adaptability. Furthermore, to minimize potential endogeneity and reverse causality concerns, we follow the two-step approach recommended by Baltagi (2021), where lagged independent variables are introduced in robustness checks and cross-sectional dependencies are tested using Pesaran's CD test.
3.3 Descriptive statistics
Descriptive statistics and a correlation matrix were computed to examine the dataset. Table 3 reports the descriptive statistics for the variables used in the empirical analysis. As shown in Table 3, CIR ranges from 10 to 166 with a mean of 52.18. Supervisory indicators (PCA_SUP_POW and PCA_SUP_STRUC) have low averages (−0.1 and 0.1) but relatively high volatility (1.34 and 1.04). Table 4 shows that correlations among regulation proxies range from −0.15 to 0.15, indicating that the independent variables capture distinct aspects of regulatory and supervisory frameworks.
3.4 Methodology
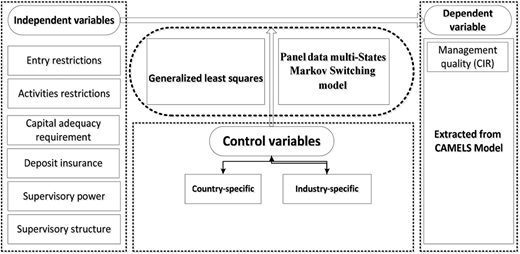
The study's methodology, based on the conceptual model in Figure 1, begins with generalized least squares (GLS) to assess the effects of regulatory, supervisory and control variables on banks' CIRs. It then applies an MSM-PDM to examine how these practices influence transitions in management quality states. Statistical tests were conducted at each stage to ensure robustness, with Figure 1 illustrating the overall framework and methodological steps.
3.4.1 Panel data regression estimation
The modeling of banking regulations and supervisory practices on management quality seeks to address two primary questions:
Do these regulations have significant and positive effects on management quality?
Do these effects lead to changes in the quality levels of banking management?
To answer the first question, panel data modeling and the GLS method are employed. For the second question, the MSM-PDM is applied.
In summary, the Lemer test confirms the panel structure, and the Hausman test selects random or fixed effects. Using the GETS method, a base model for GLS is established. Regulatory and supervisory variables are added individually and then collectively via PCA, with GLS estimating their effects. Finally, the MSM-PD model is applied to analyze how these variables influence management quality transitions. In the MSM-PDM, after creating the transition frequency matrix for the CIR states, the analysis proceeds to estimate transition intensities using the principal component analysis (PCA)-derived covariates.
3.4.2 Markov multi-state panel data model
Following Jamali's (2019) application of MSM panel modeling to banking regulation and state-transition analysis, the present study applies a three-state MSM-PDM to examine whether regulatory and supervisory variables drive transitions between management-quality states. The model treats regulations as explanatory factors influencing transition probabilities, allowing assessment of their impact on the dynamics of banking management quality. Management quality is observed annually and may improve or deteriorate over time, which motivates modeling it as a discrete-state process rather than a static outcome. Multi-state continuous-time Markov models provide a well-established framework for panel-observed processes in which states are observed at discrete time points, allowing estimation of transition intensities and transition probabilities between states. In addition, the MSM framework enables covariates (e.g. regulation and supervision measures) to enter the transition structure, which directly supports our research questions by quantifying how regulatory and supervisory conditions affect not only average management quality but also the probability of transitioning between management-quality states.
The movement on the discrete state space is governed by a transition intensity matrix : . These may depend on time , or, more generally, also on a set of individual-level or time-dependent explanatory variables . The intensity represents the instantaneous risk of moving from state to state :
The form a , matrix whose rows sum to zero, so that the diagonal entries are defined by . Here, we focus on fitting multi-state models (MSM) of this type to continuously observed processes, where the state of each individual is known at all times in the study period. This article focuses on multi-state models for panel data, in which the state is only known at a finite series of times to determine the probability and the intensity of banks' CIR state transition due to regulatory changes over time. Fitting multi-state models to panel data generally relies on the Markov assumption that future evolution depends only on the current state. That is, is independent of , the observation history of the process up to the time preceding t (Jackson, 2011).
The Markov model for panel data was first described by Kalbfleisch and Lawless (1985) and Kay (1986). The likelihood for this basic model, used in MSM, is calculated from the transition probability matrix . The the entry of , , is the probability of being in state at a time , given the state at time is . is calculated in terms of using the Kolmogorov differential equations (Kalbfleisch and Lawless, 1985). If the transition intensity matrix Q is constant over the interval (u, t + u), as in a time-homogeneous process, then , and the equations are solved by the matrix exponential of scaled by the time interval,
The matrix exponential is difficult to calculate reliably, as discussed by Moler and van Loan (2003a, b). It is defined by the same “power series” as the scalar exponential, except that each term in the series is defined by matrix products, not element-wise scalar multiplication. For simpler models, an analytic expression for each element of can be calculated in terms of entries of by hand or by using symbolic algebra software. The full likelihood is then the product of probabilities of transition between observed states, overall individuals and observation times (Moler and Van Loan, 2003a, b):
Each component is the entry of the transition matrix at the th row and th column, evaluated at . The likelihood is maximized in terms of to compute the estimates of, using standard optimization algorithms, as implemented in the optim function in R software (Jackson, 2011). Standard errors are computed from the Hessian at the optimum. Some of these optimization algorithms make use of the derivatives of the likelihood, which were given by Kalbfleisch and Lawless (1985).
In our paper, we have a set of covariates (comprising independent and control variables). The explanatory variables for a particular transition intensity can be investigated by modelling the intensity as a function of these variables. Marshall and Jones (1995) described a form of a proportional hazards model, where the transition intensity matrix elements which are of interest can be replaced by
The newly derived Q matrix is subsequently employed to determine the likelihood. The results of implementing this model using R software are presented in Section 4.2.
3.5 Robustness checks
To assess the stability of the main findings, we conducted several robustness checks. First, we re-estimate the panel model using one-year lagged regulatory and supervisory variables to reduce concerns about simultaneity and reverse causality. Second, because the multi-state results depend on the classification of CIR into discrete states, we re-estimate the Markov model using alternative CIR thresholds (including narrower and wider middle-state bands as well as quantile-based classifications). Third, we test whether the results are driven by exceptional macro-financial conditions by re-estimating the models on alternative samples, including specifications that exclude the 2020–2021 period and sub-period analyses. In additional checks, we also verified that the findings are not driven by extreme observations in CIR.
4. Empirical analysis and results
4.1 Estimating banks' CIR regression by GLS estimator
Table 5 shows that macroeconomic stability (GDP growth and inflation) influences cost efficiency (Model 1), while supervisory power improves management quality by reducing CIR inefficiency (Model 4). Institutional independence and supervisory experience enhance managerial discipline (Model 5) and combining these factors via principal components (Model 6) demonstrates their compound positive effect on management quality transitions. Overall, regulatory enforcement and institutional independence are key drivers of managerial performance in developing economies. According to Table 5, the base model reveals a positive and statistically significant relationship (at the 10% significance level) between economic growth (LOGGDP) and the dependent variable, the CIR. Specifically, for each unit increase in economic growth, the CIR, a proxy for management quality, rises by 7.06 units.
4.1.1 Interpretation of the GLS findings
The GLS results suggest that management quality is more closely related to the enforceability and institutional design of supervision than to the mere existence of formal restrictions. In practical terms, this means that supervisory effectiveness in developing economies may depend less on adding new rules and more on strengthening the authority, credibility and organizational coherence of supervisory agencies. Where supervisory institutions can intervene early, obtain reliable information and enforce corrective actions consistently, banks are more likely to adjust managerial behavior in ways that affect operating efficiency.
4.2 Fitting a multi-state capital model in R
In this section, we address the primary research questions using the regulatory and supervisory variables significantly associated with the CIR, specifically the official supervision structure and supervisory power, as highlighted in Table 5. The key questions are as follows:
What is the frequency distribution of management quality state transitions?
What is the momentum of management quality state transitions, as represented by the transition intensity matrix?
What are the transition probabilities between different management quality states over a 12-year period?
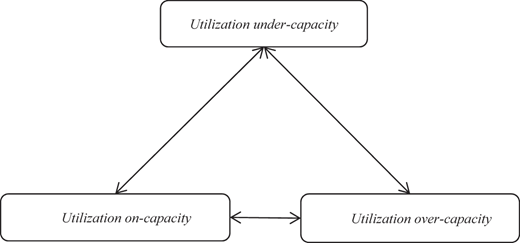
The study uses the MSM package in R to estimate the MSM model, following the approach of Sharples et al. (2003), who applied multi-state models to track disease progression. Here, the dependent variable, management quality measured via capital adequacy, is classified into three capacity utilization states: under-capacity, on-capacity and over-capacity (Hess and Francis, 2004). As shown in Figure 2, there are five distinct states among which each banking system can transition.
The MSM model data are organized by country, with a separate data frame containing each banking system's observed CIR state and the corresponding observation year. The findings show that on-capacity banks generally sustain favorable management quality, whereas over-capacity banks seldom reach the desired level. Details are provided in Table 6.
Setting the initial values: To find the maximized likelihood , we should determine a set of initial values for to start the search for the maximum likelihood. The likelihood is maximized using numerical methods, which need a set of initial values to start the search for the maximum. For reassurance that the true maximum likelihood estimates have been found, models should be run repeatedly starting from different initial values. However, a sensible choice of initial values can be important for unstable models with flat or multi-modal likelihoods. Table 7 shows the result in R.
Generate the transition intensity matrix: We now specify the multi-state model to be fitted to the data. A model is governed by a transition intensity matrix . We model the effect of significant explanatory variables, including covariates, supervisory power and supervisory structure, on the rates of transition, using a proportional intensity model. Now we have intensity matrix , which depends on a covariate vector . For each entry of , the capital state transition intensity for banking system at observation time is . The covariates are specified through the covariates argument to MSM. If is time-dependent, we assume it is constant between the observation times of the Markov process. Table 8 shows the results for this stage. We first estimate a baseline model without a covariate and then a model with a covariate for each state. The table also shows the critical value and a confidence interval for each state transition to . Running the model will result in an estimated transition intensity matrix with 95% confidence intervals. The first column shown in the output is the estimated transition intensity matrix , with the covariate z set to its mean value in the data. Confidence intervals are calculated from the covariance matrix of the estimates by assuming that the distribution is symmetric on the log scale. Table 8 provides further details on transitions between other states, along with appropriate interpretations for each scenario.
Table 8 shows that strong supervision greatly increases the likelihood of moving from under-to on-capacity utilization (transition intensity rises from 0.04 to 0.93), indicating faster recovery. In contrast, weak regulation is linked to higher transitions from on-to over-capacity, suggesting inefficiencies under lax oversight. Overall, stronger supervisory independence and enforcement reduce persistence in inefficient states. Transition probability matrices: This matrix is the probability for a state transition from time to using the covariate value at the time. To extract the estimated transition probability matrix within a given time (here 12 years), the function pmatrix.MSM is used in R. Table 9 shows the results for this stage.
Table 9 indicates that under-capacity banks have a 26% chance of improving, over-capacity banks persist in inefficiency (52%) and on-capacity banks remain stable in over 50% of cases.
4.2.1 Transition-based implications
The transition results add an important policy layer to the level estimates. A regulatory framework should not be evaluated only by whether it is associated with a lower or higher average CIR but also by whether it reduces persistence in weak states and increases the probability of movement toward the on-capacity state. This implies that regulators in developing economies should complement static performance monitoring with transition-based early-warning systems that identify banks trapped in inefficient states and target supervisory intervention before deterioration becomes persistent.
4.3 Robustness tests
The robustness tests confirm the stability of the main results. When the key supervisory and regulatory variables are lagged by one year, the coefficients retain their expected signs and remain economically meaningful, suggesting that the baseline results are not primarily driven by simultaneity. Likewise, the MSM estimates remain qualitatively similar when alternative CIR cut-off points are used to define management-quality states, indicating that the transition results are not an artifact of the baseline classification. Finally, re-estimating the models on alternative samples, including specifications excluding the 2020–2021 period, does not materially alter the main conclusion that supervisory power and supervisory structure are the most robust determinants of management-quality dynamics in the sample.
5. Conclusion
The study first estimates a panel data model linking banking regulation, supervisory practices and management quality in developing economies. The results show that LOGGDP is positively associated with CIR, while supervisory power and supervisory structure are the only regulatory dimensions with consistently significant effects. Specifically, a one-unit increase in supervisory power and supervisory structure is associated with changes of 0.260 and 1.113 units in CIR, respectively and their combined principal component remains significant in Model [6] (0.821). The second part of the study applies a MSM-PDM to examine whether regulation and supervision affect transitions across management-quality states. The transition frequency matrix shows limited successful movement toward the desired state: of 279 observed transitions, only 78 (about 27%) either moved to or remained in the target state. Persistence is strongest in the on-capacity state, where 51 of 78 transitions (about 65%) remained unchanged, while only 14 of 119 under-capacity cases and 13 of 100 over-capacity cases moved to the desired state. The transition probability matrix further shows that under-capacity banks have a 26% probability of moving to on-capacity, while over-capacity banks have a 27% probability of reaching on-capacity and a 52% probability of remaining over-capacity. Overall, the findings suggest that supervisory authority and institutional structure play an important role in shaping both management quality levels and their transitions over time. A further limitation is that the estimation sample ends in 2021. This reflects the availability of harmonized cross-country regulatory, supervisory and financial-system data rather than a judgment that post-2021 developments are unimportant. Indeed, the banking events of 2023 and the subsequent refinement of supervisory standards highlight the continued relevance of our research question. Future research should extend this framework as more comparable post-2021 cross-country supervisory data become available, particularly to evaluate how digitalization, climate-risk supervision, geopolitical-risk monitoring and operational-resilience requirements affect management quality transitions.
5.1 Linking the findings to the research questions
The findings address the three research questions in a layered way. First, the panel estimates show that not all regulatory dimensions matter equally for management quality; instead, supervisory power and supervisory structure emerge as the most consistent predictors. Second, the transition-frequency and intensity results indicate that management quality in developing economies is path-dependent, with both persistence and limited upgrading from weak states. Third, the transition-probability estimates show that the relevance of regulation and supervision extends beyond average performance, affecting whether banking systems remain trapped in weak management states or move toward more sustainable operating positions.
5.2 Practical and policy implications
Three policy implications follow. First, policymakers should prioritize supervisory capacity, independence and timely corrective authority rather than relying exclusively on formal tightening of rules. Second, supervisory agencies should adopt transition-based monitoring frameworks that identify whether banks are persistently stuck in weak management-quality states, because persistence itself is an early-warning signal. Third, bank managers should treat regulation not merely as a compliance burden but as an organizational discipline mechanism: investments in internal controls, reporting quality, cost governance and operational adaptability are more likely to improve management quality when supervisory expectations are credible and consistently enforced.
5.3 Theoretical implications
The study also has theoretical implications. This suggests that the relationship between regulation and management quality is mediated by supervisory effectiveness and institutional capacity, which helps reconcile mixed findings in earlier studies. In other words, the same formal rule may generate different managerial outcomes depending on whether it is embedded in a credible and capable supervisory environment. This perspective is particularly important in developing economies, where de jure regulations and de facto enforcement may diverge substantially.