


The purpose of this study is to examine the perceptions of Malaysian and Bangladeshi retail small- and medium-sized enterprise (SME) business owners on the key elements of business growth.
The construct measurements have all been taken from previous research studies. The data were gathered from retail SMEs in Malaysia and Bangladesh in order to evaluate entrepreneurs' perception towards the essential elements of a business performance. Structural equation modeling (SEM) with PLS technique, specifically Smart-PLS Version 3.2.4, was used to accomplish the study's objectives and analyze the measurements, as well as the structural model.
According to the findings, Malaysian and Bangladeshi SMEs have different perspectives toward the dimensions of their business performance. For example, Malaysian retail SME owners consider business growth and financial results to be the most important aspects of their success. Retailers consider financial performance to be less critical than non-financial performance when it comes to their business's success. Owners of Bangladeshi retail SMEs, on the other hand, see efficiency relative to competition and that non-financial performance is the key component to achieving business success. In the sense of Bangladeshi SMEs, market development and financial results are seen as less significant in attaining success.
Since this research was only conducted in Malaysia and Bangladesh, it did not cover a large number of countries. The sample size was limited; therefore, the findings of this study cannot be applied to the entire population of Malaysian and Bangladeshi retail SMEs due to the non-probability sampling technique.
The findings of this study show that entrepreneurs or business owners in the retail sector in Malaysian and Bangladeshi SMEs view the attributes of their business performance differently.
This study adds to the rising context of entrepreneurship by examining SME owners' perception of main business performance dimensions in the scope of Asian retail SMEs.
1. Introduction
The idea of business success has received a lot of attention in management and entrepreneurship literature because it represents how small- and medium-sized enterprises (SMEs) choose their own success. In particular, it is critical to comprehend business owners' perception toward the critical dimensions of their company's success, as these perceptions can influence their behavior. Numerous past studies have recorded the perspectives of SME owners on the essential metrics and dimensions of market performance (Arzubiaga et al., 2018; Gupta and Mirchandani, 2018; Zakariaa et al., 2016; Gholami et al., 2013; Ahmad et al., 2011; Ahmad et al., 2010; Rai et al., 2006; Hoong et al., 2019). In addition, it is commonly accepted that company owners are a reflection of their business (Ahmad et al., 2018; Chua et al., 2018; Śmigielska, 2016; Chuang et al., 2009; Ahmad, 2007; Hambrick, 2007), and the outcome of their companies is determined by their behaviors. This research aims to examine perceived business success measures through the lens of SME entrepreneurs. In this paper, the words “business owners” and “entrepreneurs” are used as interchangeable terms, as the owners of SMEs are true entrepreneurs who put in their best effort to produce superior results.
The SME sector has received a lot of attention in literatures because it is an important factor in any economy's development (Gërguri-Rashiti et al., 2017). Some industries are often more appropriate than others (Rezaei et al., 2013), particularly to gain in-depth understanding of a specific phenomenon (Ahmad, 2007). Therefore, this research looked at the idea of business success through the eyes of retail entrepreneurs in Malaysia and Bangladesh, two developing countries. Entrepreneurship has been emphasized in both countries as a means of advancing economies. It is the practice of pursuing new opportunities in the face of adversity with the purpose of successfully and efficiently combining different variables to achieve superior business performance (Liao et al., 2018; Ramadani et al., 2014). This definition of entrepreneurship is closely related to the term “entrepreneur”, which refers to an individual who seeks out new opportunities, takes calculated risks and then combines the best elements to improve quality business success (Honig and Hopp, 2019; Ramadani et al., 2014). As a result, entrepreneurs are regarded as micro-economic agents of economic dynamics (Dana and Mallet, 2014), and understanding the idea of business success through the experience of entrepreneurs is critical. As highlighted by Shanine et al. (2019) and Schauer and Hoy (2001), certain studies have demonstrated scientifically that reported entrepreneurship research studies are not always in line with business owners' viewpoints and interests. Thus, there should be an assessment on reality-vs-general perceptions (Schauer and Hoy, 2001). This is only possible by concentrating on specific contexts in any phenomenon, as it has been widely emphasized that context-specific viewpoints are crucial to understanding entrepreneurship better (Welter and Gartner, 2016). The purpose of this paper is to contribute to the entrepreneurship research literature by providing Asian perspectives (perception of business owners/entrepreneurs from Malaysia and Bangladesh) on business performance measures in specific contexts.
Though entrepreneurs have tried to establish their own companies as SMEs, they fail to manage them on a long-term basis (Johara et al., 2017). The causal consequence is that the failure rate of SMEs in developing countries such as Malaysia and Bangladesh is over 50% (Nik et al., 2016; Khalique et al., 2011). Therefore, it is critical to comprehend the idea of business success from the eyes of small-business owners. Successful SMEs act as the backbone of a country's economy and contribute toward GDP, employment, exports and productivity. On the other hand, failing SMEs are unable to contribute significantly to the growth of the country's economy, resulting in residual unemployment. Similarly, a number of studies have acknowledged the importance of SMEs toward the country's GDP, social uplifting, employment, exports and productivity (Dutta, 2017; Cravo et al., 2012; Radam et al., 2008; Karides, 2005; Amini, 2004; Tehseen et al., 2020a, b). Therefore, this research recognizes the value of good SMEs, and it aims to investigate business owners' views on the essential aspects of business performance. According to Carton and Hofer (2006), the drawbacks of qualitative analysis, which is primarily interpretive, complicate and contrast organizations and companies, despite the fact that a variety of contexts and interpretations play an important role in performance measurement. Given the massive interdependencies among financial and non-financial results, Velte (2017) engendered a significant influence on existing literatures.
Based on an integrative analysis of the literature, the current research argues for the use of both financial and non-financial metrics of performance. A thorough analysis of the literature from different contexts was conducted to avoid dismissing any critical performance criterion widely used in the sense of SMEs, both locally and globally. This research has revealed the disparities in business owners' views on main success factors. The second section of this paper is devoted to a review of the literature. It will explain how SMEs are described in Malaysia and Bangladesh. Then it will present a short literature review on the theory of business performance, followed by a summary of the retail industry in both countries.
2. Theory and literature review
2.1 Definition of SMEs
SMEs, since the last eras of the twentieth Century, are special styles of businesses that have gained a lot of attention and importance (Rakićević et al., 2016; Zahan, 2017). The “small- and medium-sized enterprise” is the most widely-used word, and although it is still an unclear definition, it conveys the main idea of an SME as a small, but focused, business (Yan, 2015). Researchers have used different approaches to define SMEs. For instance, according to North and Varvakis (2016), SME is defined as “a small social system whose members share a mutual interest in its existence and participate in collective actions to ensure this end”. This definition describes SMEs as social entities with the weaknesses and strengths to effectively deal with their turbulent environments. According to North and Varvakis (2016), the broad idea of a small business is based on two key criteria: (1) turnover and (2) employee count. However, this definition varies by country. Given the variety of SMEs, most countries use quantitative definitions to capture the fundamental characteristics of SMEs. The Malaysian and Bangladeshi meanings of SMEs are shown in Tables 1 and 2, correspondingly.
Definition of SMEs in Malaysia (by size of operation)
| Category | Micro | Small | Medium |
|---|---|---|---|
| Manufacturing | Sales turnover of less than RM300,000 OR Employees of less than 5 | Sales turnover from RM300,000 to less than RM15 million OR Full-time employees from 5 to less than 75 | Sales turnover from RM15 million to not exceeding RM50 million OR Full-time employees from 75 to not exceeding 200 |
| Service and other sectors | Sales turnover of less than RM300,000 OR Employees of less than 5 | Sales turnover from RM300,000 to less than RM3 million OR Full-time employees from 5 to less than 30 | Sales turnover from RM3 million to not exceeding RM20 million OR Full-time employees from 30 to not exceeding 75 |
Source(s): SME Corp (2015)
Definition of SMEs in Bangladesh
| Category | Micro | Small | Medium |
|---|---|---|---|
| Manufacturing | Amount of investment is 10 lakh to 75 lakh (Replacement cost and value of fixed assets, excluding land and factory buildings) OR Number of employed Workers are 16–30 | Amount of investment is 75 lakhs to 15 crores (Replacement cost and value of fixed assets, excluding land and factory buildings) OR Number of employed workers are 31–120 | TT amount of investment is 15 crores to 50 crores (Replacement cost and value of fixed assets, excluding land and factory buildings) OR Number of employed workers are 121–300 |
| Services and other sectors | Amount of investment is 10 lakh to 75 lakh (Replacement cost and value of fixed assets, excluding land and factory buildings) OR Number of employed workers are 16–30 | Amount of investment is 10 lakh to 2 crores (Replacement cost and value of fixed assets, excluding land and factory buildings) OR Number of employed workers are 16–50 | Amount of investment is 10 lakh to 2 crores to 30 crores (Replacement cost and value of fixed assets, excluding land and factory buildings) OR Number of employed workers are 51–120 |
Source(s): Ministry of Industry (2016)
2.2 Malaysian and Bangladeshi retail SMEs
Due to the purchase of products and services by consumers for personal, family or household uses, retailing is critical in commercial transactions. Therefore, retailers are actively involved in the delivery of products and services to customers. The retail industry, which is a significant segment in the service sector, is widely regarded as the most important in the world due to its crucial contributions to economic development, as well as a country's GDP. While Malaysia's manufacturing industry accounts for only 5.9% of the country's overall business establishments, the Malaysian retail industry has a major share of the country's GDP of more than 14% in the previous years of 2012, 2013 and 2014. Similarly, 50% of the total GDP of Bangladesh's economy is covered by the largest sector that provides services: wholesaling, retailing and trading; transportation, storage and communication; as well as real estate renting and leasing are the most important parts within the service sector. They are business activities that cover 14%, 11% and 7%, respectively, of the total GDP. On the contrary, the industrial sector only accounts for a total 30% of the GDP. As the wholesale and retail SMEs of both countries represent the largest segment of the service sector and contribute more toward a country's GDP and employment, this demonstrates the importance of wholesale and retail SMEs in both the countries' economies. Numerous studies have recognized the value of good SMEs for a country's economic growth and development (Tehseen and Sajilan, 2016; Tehseen et al., 2015; Sajilan and Tehseen, 2015; Tehseen and Ramayah, 2015; Ahmad et al., 2011). Apart from that, retailers have also been attempting for several years to identify the crucial success factors that may affect their business results (Mekraz and Gundala, 2016). Therefore, to better understand the measures associated with business success in Malaysian SMEs, it is necessary to first understand the meaning of business success, which is why wholesale and retail SMEs have been selected specifically for this research.
2.3 The concept of business success
What constitutes as the strongest indicator of performance is still a point of contention. Previous researches have indicated the rigid use of financial metrics, while others have emphasized the importance of non-financial success indicators. Based on a past literature, traditional cost-effective measures of performance such as profitability, sales turnover and return on investment take precedence in deciding whether or not a company is profitable (Bruderl and Preisendorfer, 1998). This research team also disagrees that, in order to become effective organizations, they must generate profit, increase profit and demonstrate some degree of development, as stated in their sales and profit reports (Perren, 2000). Hall and Fulshaw (1993) stated that development is associated with long-term success, while profitability is associated with short-term success. Some scholars have claimed that not all small businesses strive to expand, and for some entrepreneurs, success merely means surviving or maintaining the company that they have built (Whitson et al., 2018; Beaver, 2002). This group affirms that, even though growth is not considered important, survival in business also entails a firm to be financially feasible. The belief that “businesses are only successful if they are financially solvent” may have influenced researchers who use this method (Marlow and Strange, 1994, p. 179). The latter party, on the other hand, compelled the value of non-financial indicators of progress (Frese et al., 2002; Hoque, 2004; O'Regan and Ghobadian, 2004). The basis for doing so is made apparent by Jenning and Beaver (1997) who disagreed that, contrary to common opinion and economic theory, the pursuit of individual economic fortune and money is less important than the desire for independent quality of life, direct interest and responsibility that many small business owners and managers strive for. As a result, achieving these goals is one of the most important requirements for success, as described by the entrepreneur/owner-manager.
The above expresses the idea that, for small businesses, the most important metric of success is the achievement of personal goals such as autonomy, personal engagement and work–life balance, rather than financial results. In a parallel stratum, Beaver (2002) illustrated that revenue is not a primary motivator for many entrepreneurs, but rather a “satisfying by-product” that allows them to take control of their own goals. Entrepreneurship research has focused on a limited definition of success, concentrating solely on company success as measured by “hard” indicators of firm efficiency (Ahmad et al., 2011; Islam et al., 2019). Studies have largely ignored the “softer,” more personally established standards of success that represent the internal profession due to their low expectations. Accordingly, Walker and Brown's (2004) financial and non-financial metrics can be used in tandem to provide a more complete picture of real results. Even though focusing solely on financial results may be inadequate, ignoring this metric of success may introduce bias into the calculation of successful business. More recently, Ahmad and Seet (2009) mentioned that financial and non-financial criteria have been identified in interviews conducted among 10 SME founder-managers in the northern region of Peninsular Malaysia. Despite the fact that the research was conducted in an eastern environment, the findings have yet to be empirically validated. As mentioned previously, the shortcomings of primarily interpretive and qualitative analysis make it difficult to compare and contrast organizations and businesses, particularly when there are a variety of contexts, and that context plays an important role in evaluating success (Carton and Hofer, 2006). As a result, an analysis should be conducted to verify and confirm the dimensions of the features of a business performance structure, as it relates to SMEs.
Both eastern and western contexts are covered in the literature. The present research is unique in that it employs both financial and non-financial performance indicators. This is to avoid ignoring critical performance metrics that have often been used in the context of SMEs, both nationally and globally. Profitability, revenue turnover, revenue growth, return on investment and market share are examples of financial metrics (Chandler and Hanks, 1993), whereas customer satisfaction and retention, owner self-satisfaction, firm image and reputation, employee satisfaction and good working relations are among the non-financial indicators (Ahmad and Seet, 2009). In the manufacturing and service industries, customer satisfaction is linked to repurchase intent. If customers are pleased, they are more likely to suggest the firm's products or services to other prospective consumers (Haber and Reichel, 2005; Adams and Sykes, 2003). On the other hand, customer retention, which refers to loyalty, is also a critical non-financial performance metric, as it has been shown to increase market share and profitability (Haber and Reichel, 2005). Customer retention and satisfaction are two non-financial outcomes that have been listed in the popular literature (O'Regan and Ghobadian, 2004), as well as the owner's satisfaction with and perception of his or her own professional advancement (Frese et al., 2002). Employee satisfaction, supplier relations, successful corporate image, workplace relations and maintaining work–life balance have also been highlighted by other researchers as significant non-financial metrics of performance (Hoque, 2004; Walker and Brown, 2004).
3. Method
3.1 Survey instrument
The construct measurements were all taken from previous studies; therefore, the reliability of these measures has also been recorded. According to the studies of Hoque (2004) and Stephan (2018), non-financial performance is measured using employee satisfaction, customer satisfaction, workplace industrial relations and supplier relationships. For instance, Chandler and Hanks (1993) identified a Cronbach's alpha value of 0.77 internal consistency for their measure. In this study, satisfaction with financial success, including sales growth, profitability, sales turnover and return on investment, was estimated. In another research, Hoque (2004) noted a high internal consistency with a Cronbach's alpha value of 0.75. Five items have been introduced to this measure to define success: (1) customer retention, (2) business image, (3) overall satisfaction, (4) career progress and (5) balance between work and family life (Ahmad and Seet, 2009). Besides that, Chandler and Hanks (1993) stated that a self-report of performance on “objective” financial indicators includes estimates of the firm's performance relative to its competitors. This six-item scale, which consists of market share, return on sales, sales growth, cash flow, net profit and return on investment, has reported a moderate internal reliability value of 0.53. Based on previous studies, business growth was measured by examining changes in sales, market share and cash flow growth. The scale reported a good Cronbach's alpha value of 0.72 (Chandler and Hanks, 1993). According to Haber and Reichel (2005), similar measures in their study also reported a high internal consistency of 0.92.
3.2 Sample and data
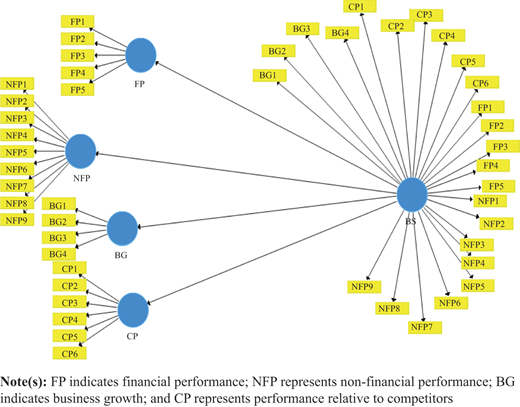
We studied retail SMEs in Malaysia and Bangladesh to identify how they felt about the important aspects of business performance. The data have been obtained from 80 Malaysian retail SMEs and 80 Bangladeshi retail SMEs in Malaysia and Bangladesh, respectively. Their demographic profiles are shown in Table 3. Non-probability sampling technique was adopted to collect the data, with purposive sampling used for the survey. The material validity of the interventions was then investigated, as indicated by Dana and Dana (2005) to avoid type III errors that might be caused by the wrong question asked during survey. To obtain full answers, a face-to-face interview was conducted with the respondents. Using four dimensions to analyze the current structure, a minimum sample size of 95 creates a power of 0.80 for the research model, with a medium effect size (Hair et al. 2014, 2017). Therefore, a total of 160 data from both countries have been analyzed for the purpose of the study that would result in a new product with the power of 0.98 for the research model with a medium effect size of 0.15. Table 1 provides the sample data's demographic details. The items were adopted for all aspects of business performance from Ahmad (2007), and the research model for this present study is shown in Figure 1.
Demographic profile of respondents
| Characteristics | Full sample (N = 160) | Malaysian retail SMEs (N = 80) | Bangladeshi retail SMEs (N = 80) | |||
|---|---|---|---|---|---|---|
| Frequency | Percentage | Frequency | Percentage | Frequency | Percentage | |
| Gender | ||||||
| Male | 109 | 68.12 | 34 | 42.5 | 75 | 93.75 |
| Female | 51 | 31.87 | 46 | 57.5 | 5 | 6.25 |
| Age | ||||||
| 31–40 | 32 | 20.00 | 22 | 27.5 | 10 | 12.50 |
| 41–50 | 83 | 51.87 | 38 | 47.5 | 45 | 56.25 |
| 51–60 | 45 | 56.25 | 20 | 25.0 | 25 | 31.25 |
| Marital status | ||||||
| Single | 34 | 21.25 | 17 | 21.3 | 17 | 21.25 |
| Married | 88 | 55.00 | 43 | 53.8 | 45 | 56.25 |
| Divorced | 35 | 21.87 | 17 | 21.3 | 18 | 22.50 |
| Widowed | 3 | 1.87 | 3 | 3.8 | 0 | 0 |
| Highest education | ||||||
| Diploma | 33 | 20.62 | 23 | 28.8 | 10 | 12.5 |
| Bachelor's Degree | 77 | 48.12 | 37 | 46.3 | 40 | 50.0 |
| Master's Degree | 45 | 28.12 | 15 | 18.8 | 30 | 37.5 |
| PhD | 5 | 3.125 | 5 | 6.3 | 0 | 0 |
| Firm age | ||||||
| 3–5 years old | 14 | 8.75 | 9 | 11.3 | 5 | 6.30 |
| 6–10 years old | 73 | 45.62 | 43 | 53.8 | 30 | 37.50 |
| 11–20 years old | 73 | 45.62 | 28 | 35.0 | 45 | 56.25 |
3.3 Demographic data analysis
The demographic profile reveals that there are 42.5% males and 57.5% females in the Malaysian sample, and 93.75% males and 6.25% females in the Bangladeshi sample. The majority of the respondents belong to the age group of 41–50 years old in both samples. 48% of the total respondents have a Bachelor's degree. 67.50% SMEs have small businesses (60% from the Malaysian sample and 75.50% from the Bangladeshi sample), while 32.50% SMEs own medium-sized businesses (32.50% from the Malaysian sample and 25.0% from the Bangladeshi sample). The other demographic details are shown in Table 3.
4. Findings
4.1 Inferential data analysis
Obtaining the study's goals and analyzing the data involves using a measurement model and structural model; structural equation modeling (SEM) with PLS technique, particularly the Smart-PLS Version 3.2.4, was applied. The PLS–SEM is similar to the analysis of multiple regression, which investigates relationships by focusing less on the measurement model (Hair et al., 2017). PLS–SEM technique was used in this study because it involves a second-order construct (i.e. business success) and works well with a small sample size (Hair et al., 2017; Tehseen et al., 2020a, b; Tehseen et al., 2019; Islam et al., 2020; Hossain et al., 2021). Furthermore, this technique has been applied in many studies to examine the relationship between constructs (Henseler et al., 2015; Bahar et al., 2020; Hossain et al., 2021). In the PLS structure model, individual path coefficients can be interpreted as the standardized beta coefficients of OLS regression (Götz et al., 2010). The significance of each path coefficient can be accessed through the procedure of bootstrapping, whereby the significant paths representing the hypothesized direction provide empirical support for the proposed path relationship and vice versa (Hair et al., 2011; Yung and Bentler, 1994). The process of bootstrapping is a nonparametric test in PLS, which includes repeated random sampling with the replacement from the original sample in order to develop a bootstrap sample and achieve the standard errors to test the relationships (Hair et al., 2011). The current study used bootstrapping with 1,000 re-samples to test the significance of the regression or path coefficients according to the suggestions of Chin (2010). The path coefficients have standardized values of between −1 and +1. The path coefficients closer to +1 indicate a strong positive relationship, while those closer to −1 represent a strong negative relationship (Hair et al., 2017). Moreover, PLS is more suitable in carrying out a multi-group analysis on the SMEs across two different countries and can also explore the differences. The respondents of Malaysian retail SMEs and Bangladeshi SMEs were split into two different data sets (80 samples in each group). In order to estimate the results of the structure model, all criteria such as discriminant validity, convergent validity and measurement invariance were examined separately according to the suggestions of Hair et al. (2017). According to Hair et al. (2009), the items' factor loadings, the constructs' average variance extracted (AVE) and CR are used to examine the data's convergence validity. Therefore, to ensure the reliability of the indicators, the main loadings and cross-loading of items were also checked. We also followed the suggestions of Chin (1998) and retained the items whose factor loadings exceeded the recommended value of 0.6. With reference to Hair et al. (2017) and Hair et al. (2014), we retained or deleted the items with poor factor loadings after examining the impact of their removal, both on the values of convergent validity and composite reliability (CR). For example, if the deletion of an item with a low factor loading could not improve the value of AVE and CR, it is then retained in the model; otherwise, it is deleted. Hence, the items FP4, NFP2, NFP3, NFP4, NFP6, NFP8, CP2 and CP4 with factor loadings below 0.4 were removed in order to improve the values of AVE and CR. The AVE of all the other constructs was more than the cutoff value of 0.5, as suggested by the literatures (Hair et al., 2014; Henseler et al., 2009). Apart from that, the values for the composite reliability of the constructs were above the minimum threshold value of 0.7, as proposed by Hair et al. (2011). Tables 4 and 5 show the results of the measurement model analysis.
Constructs' validity and reliability
| Samples | Constructs | Cronbach's alpha | aComposite reliability | bAverage variance extracted (AVE) |
|---|---|---|---|---|
| Full sample | BG | 0.771 | 0.853 | 0.592 |
| BS | 0.893 | 0.910 | 0.409 | |
| CP | 0.855 | 0.902 | 0.697 | |
| FP | 0.700 | 0.817 | 0.541 | |
| NFP | 0.720 | 0.843 | 0.641 | |
| Malaysian sample | BG | 0.697 | 0.811 | 0.519 |
| BS | 0.808 | 0.848 | 0.282 | |
| CP | 0.730 | 0.829 | 0.552 | |
| FP | 0.707 | 0.819 | 0.532 | |
| NFP | 0.535 | 0.759 | 0.514 | |
| Bangladeshi sample | BG | 0.759 | 0.848 | 0.583 |
| BS | 0.898 | 0.915 | 0.431 | |
| CP | 0.889 | 0.924 | 0.753 | |
| FP | 0.631 | 0.789 | 0.530 | |
| NFP | 0.763 | 0.863 | 0.678 |
Note(s): aComposite reliability (CR) = (square of the sum of factor loadings)/{(square of the sum of factor loadings) + (square of the sum of error variances)}; bAverage variance extracted (AVE) = (sum of the square of factor loadings)/{(sum of the square of factor loadings) + (sum of the error variances)}
Source(s): Own survey results
Factors loadings
| Constructs | Items | Full sample (N = 160) | Malaysian sample (N = 80) | Bangladeshi sample (N = 80) |
|---|---|---|---|---|
| Factor loading | Factor loading | Factor loading | ||
| BG | BG1 | 0.752 | 0.770 | 0.668 |
| BG2 | 0.753 | 0.608 | 0.775 | |
| BG3 | 0.800 | 0.779 | 0.822 | |
| BG4 | 0.752 | 0.712 | 0.782 | |
| CP | CP1 | 0.804 | 0.755 | 0.798 |
| CP3 | 0.861 | 0.865 | 0.859 | |
| CP5 | 0.839 | 0.726 | 0.899 | |
| CP6 | 0.833 | 0.601 | 0.910 | |
| FP | FP1 | 0.804 | 0.762 | 0.784 |
| FP2 | 0.802 | 0.638 | 0.847 | |
| FP3 | 0.805 | 0.724 | 0.875 | |
| FP5 | 0.421 | 0.786 | 0.747 | |
| NFP | NFP1 | 0.823 | 0.744 | 0.837 |
| NFP5 | 0.779 | 0.669 | 0.796 | |
| NFP9 | 0.796 | 0.703 | 0.837 |
Source(s): Own survey results
After analyzing the convergent validity of the model, an analysis of its discriminant validity was also undertaken. Two approaches were used to examine the discriminant validity of the model. The first approach is the Fornell and Larcker criterion, in which the discriminant validity is examined for both the full and split samples by comparing the correlation among the constructs and the square root of AVE for that construct (Fornell and Larcker, 1981). The results revealed that the square roots of AVEs for all the constructs are greater than the off-diagonal elements in both their corresponding rows and columns, which suggest that the discriminant validity is established for the full and sub-models (Table 6).
Fornell–Larcker criterion
| Full sample | BG | CP | FP | NFP | |
| BG | 0.769 | ||||
| CP | 0.523 | 0.835 | |||
| FP | 0.608 | 0.576 | 0.736 | ||
| NFP | 0.514 | 0.577 | 0.497 | 0.801 | |
| Malaysian sample | BG | 0.720 | |||
| CP | 0.289 | 0.743 | |||
| FP | 0.595 | 0.346 | 0.729 | ||
| NFP | 0.375 | 0.296 | 0.348 | 0.717 | |
| Bangladeshi sample | BG | 0.764 | |||
| CP | 0.584 | 0.868 | |||
| FP | 0.477 | 0.643 | 0.728 | ||
| NFP | 0.487 | 0.654 | 0.521 | 0.824 |
Source(s): Own survey results
Henseler et al. (2015) suggested the assessment of the correlations' heterotrait–monotrait ratio (HTMT) to examine the discriminant validity. This recent approach indicates the estimation of the true correlation between two latent variables. A threshold value of 0.90 for HTMT, as well as a confidence interval of HTMT of less than 1 have been suggested as the threshold value for assessing discriminant validity through HTMT (Henseler et al., 2015). Table 7 shows that the HTMT criterion has been fulfilled for our PLS model.
HTMT criterion
| Full sample | BG | CP | FP | NFP | |
| BG | |||||
| CP | 0.627 (0.499, 0.748 | ||||
| FP | 0.806 (0.683, 0.925) | 0.720 (0.595, 0.852) | |||
| NFP | 0.690 (0.554, 0.821) | 0.735 (0.599, 0.853) | 0.679 (0.540, 0.581) | ||
| Malaysian sample | BG | ||||
| CP | 0.350 (0.279, 0.605) | ||||
| FP | 0.770 (0.595, 0.974) | 0.435 (0.284, 0.716) | |||
| NFP | 0.602 (0.388, 0.923) | 0.446 (0.259, 0.825) | 0.519 (0.361, 0.919) | ||
| Bangladeshi sample | BG | ||||
| CP | 0.714 (0.508, 0.851) | ||||
| FP | 0.741 (0.509, 0.880) | 0.830 (0.593, 0.958) | |||
| NFP | 0.629 (0.434, 0.810) | 0.786 (0.641, 0.945) | 0.734 (0.525, 0.922) |
Source(s): Own survey results
Therefore, in total, the measurement model has shown adequate convergent validity, as well as discriminant validity. After testing the measuring model, the structural model was then analyzed. The values of the path coefficients along with their significance indicate how well the hypothesized model is supported by the data (Chin, 1998). Hence, bootstrapping procedure with a resampling of 1,000 was used to estimate the path coefficient's significance (Chin, 1998). Table 8 shows the path coefficients and their significance for the full and split data.
Significance of path coefficients (Bootstrapping)
| Path | Malaysian sample (N = 80) | |||
|---|---|---|---|---|
| Std. beta | SE | t-value | Result | |
| BS → BG | 0.807 | 0.039 | 20.774*** | S |
| BS → CP | 0.644 | 0.097 | 6.659*** | S |
| BS → FP | 0.829 | 0.047 | 17.583*** | S |
| BS → NFP | 0.617 | 0.098 | 6.322*** | S |
| Path | Bangladeshi sample (N = 80) | |||
| Std. beta | SE | t-value | Result | |
| BS → BG | 0.768 | 0.056 | 13.64*** | S |
| BS → CP | 0.911 | 0.036 | 25.533*** | S |
| BS → FP | 0.792 | 0.057 | 13.789*** | S |
| BS → NFP | 0.797 | 0.055 | 14.50*** | S |
| Path | Full sample (N = 80) | |||
| Std. beta | SE | t-value | Result | |
| BS → BG | 0.812 | 0.028 | 29.450*** | S |
| BS → CP | 0.849 | 0.027 | 31.525*** | S |
| BS → FP | 0.820 | 0.026 | 31.248*** | S |
| BS → NFP | 0.769 | 0.037 | 20.977*** | S |
Note(s): Critical t-value 2.57*** (significance level = 1%)
Source(s): Own survey results
In addition, as this study involves the comparison of perceptions across two countries, it is thus essential to test the measurement invariance. Hair et al. (2017) stressed that researchers should ensure that the measures of all constructs are invariant across the two groups while comparing their path coefficients by using the PLS–MGA approach. Bootstrapping was used separately for each group and according to the number of observations in the data set.
Levene's test was later applied (Hair et al., 2014, 2017, 2017) to test the measurement invariance for all items through the outer loadings and standard errors for each group. The criterion is that there should not be difference in the measurement items of at least two items of each construct. The results revealed that there is no significant difference between the two groups. Table 9 depicts the results. Levene's test has been used only in a few studies to assess the measurement invariance. For example, a study by Rahman et al. (2015) used this technique to test the measurement invariance for all items while studying service innovation's management practices in telecommunications industry contextually.
Invariance test
| Welch–Satterthwaite test (Invariance test) | |||
|---|---|---|---|
| Outer loadings-diff (Malaysian-Bangladeshi) | t-value (Malaysian vs Bangladeshi) | p-value (Malaysian vs Bangladeshi) | |
| BG1 ← BG | 0.103 | 1.012 | 0.315 |
| BG2 ← BG | 0.167 | 1.815* | 0.073 |
| BG3 ← BG | 0.043 | 0.680 | 0.499 |
| BG4 ← BG | 0.070 | 0.919 | 0.361 |
| CP1 ← CP | 0.043 | 0.485 | 0.629 |
| CP3 ← CP | 0.006 | 0.101 | 0.920 |
| CP5 ← CP | 0.172 | 2.020** | 0.047 |
| CP6 ← CP | 0.309 | 2.766*** | 0.007 |
| FP1 ← FP | 0.022 | 0.192 | 0.848 |
| FP2 ← FP | 0.210 | 1.928* | 0.058 |
| FP3 ← FP | 0.152 | 1.488 | 0.141 |
| FP5 ← FP | 0.638 | 4.261*** | 0.000 |
| NFP1 ← NFP | 0.063 | 0.58 | 0.564 |
| NFP5 ← NFP | 0.127 | 0.785 | 0.435 |
| NFP9 ← NFP | 0.134 | 1.079 | 0.284 |
Note(s): Critical t-values 1.65* (significance level = 10%), 1.96** (significance level = 5%), and 2.57*** (significance level = 1%)
Source(s): Own survey results
As the results have revealed no significant difference between the two groups in the measurement items of at least two items of each construct-application of the multi-group analysis technique, PLS-MGA was used to assess the difference among the path coefficients of both groups. Table 10 shows that significant difference is found in the perception of business owners toward only two dimensions of business success, including performance relative to competitors, as well as non-financial performance between the Malaysian and Bangladeshi samples. This shows that the key dimensions are perceived differently across the two countries. Thus, the dimensions of business success are context-specific and vary across different countries.
Findings of multi-group comparison between Malaysians and Bangladeshi samples
| Relationships | Path coefficients-diff (|Malaysian sample – Bangladeshi sample|) | t-value (Malaysian sample vs Bangladeshi Sample) | p-value (Malaysian sample vs Bangladeshi Sample) |
|---|---|---|---|
| BS → BG | 0.039 | 0.552 | 0.583 |
| BS → CP | 0.267 | 2.612*** | 0.011 |
| BS → FP | 0.036 | 0.526 | 0.600 |
| BS → NFP | 0.179 | 1.698* | 0.093 |
Note(s): Critical t-values 1.65* (significance level = 10%) and 2.57*** (significance level = 1%)
Source(s): Own survey results
4.2 Common method bias tests
Contemporarily, the issue of common method variance (CMV) has been addressed within organizational studies that used the same type of respondents for obtaining data (Yuksel, 2017; Tehseen et al., 2017; Jakobsen and Jensen, 2015). Doty and Glick (1998) stated that CMV occurs because of the systematic variance in the measures due to the measurement technique. Richardson et al. (2009) referred to CMV as the systematic error variance shared among variables that are measured with the same method or source. This systematic error variance may cause common method bias and may create biasness in the estimated relationships between the variables or measures (Jakobsen and Jensen, 2015; Campbell and Fiske, 1959). Since this study used the same type of respondents (business owners), as well as the same type of Likert scale to obtain data from both countries, we thus addressed the issue of CMV by using the four statistical remedies to detect and control its impacts. The two techniques, namely partialling out a marker variable, a Lindell and Whitney (2001) method, and correlation matrix procedure, were used to detect the CMV issue in this study. On the other hand, the other two statistical tests, construct-level correction (CLC) approach and item-level correction (ILC) approach, were used to remove any impact of CMV from the findings of this study. These tests are explained below:
4.2.1 Partialling out a marker variable
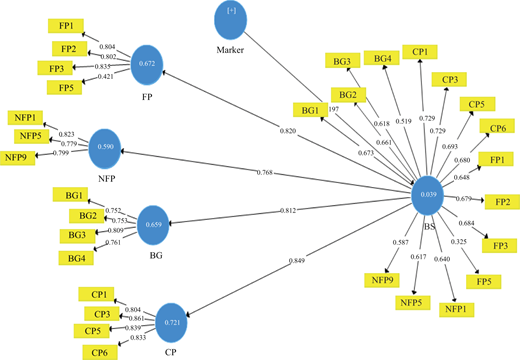
This is a method introduced by Lindell and Whitney (2001) used to identify CMV issues from any PLS studies. Using this method in the current study, a marker variable was partialled out in our full PLS model to detect the CMV by assessing the correlation between the marker variable and constructs, as shown in Figure 2. CMV was not found as an issue in this study because the correlation between the constructs and marker is not greater than 0.3 (r > 0.3), as shown in Table 11.
4.2.2 Correlation matrix procedure
Bagozzi et al. (1991) described the method of identifying the influence of CMV through the constructs' correlations. Thus, following this method, CMV is not evident because a substantially large correlation was not found among the principal constructs (r > 0.9), as shown in Table 12.
4.2.2.1 Measured latent marker variable approach (MLMV)
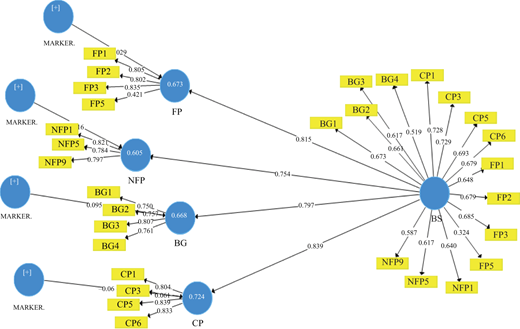
Chin et al. (2013) strongly suggested two approaches to detect and reduce the impact of CMV. The first approach is called the CLC, in which the same number of CMV controls the latent variables as the model's latent variables are created. However, in this study, each CMV control variable used the same set of MLMV items (social desirability items), and the CMV control constructs were modeled as influencing each latent variable of the model, as shown in Figure 3.
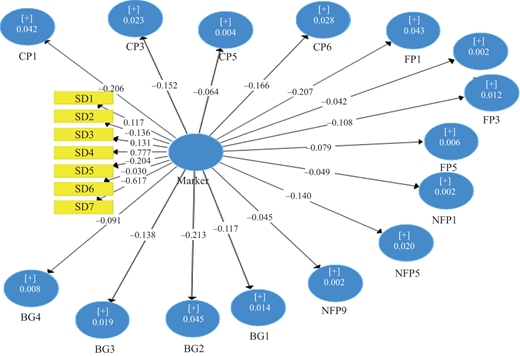
The second approach recommended by Chin et al. (2013) is the ILC that involves partialling out MLMV items in order to partial out the influence of CMV at the level of every measurement item of the latent variable. Using this approach in the current study, every measurement item is regressed on all sets of the MLMV items, as shown in Figure 4.
The resulting residuals for every item represent the latent variable's items with the removed influence of CMV. The R2 that was used was obtained from every item of the MLMV regression. The square root of the R2 was then multiplied with the random error of every measured item and added to each item's residuals. These final ILC items were then used in a PLS analysis of the models, as shown in Figure 5.
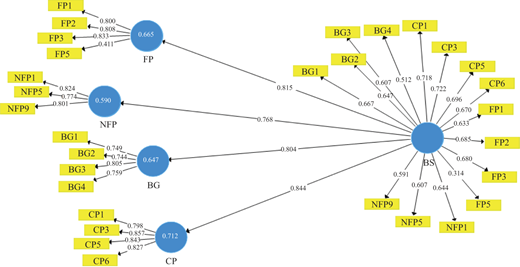
Table 13 shows the PLS estimations, as well as the CLC and ILC estimations for the full sample, Malaysian sample and Bangladeshi sample models. The comparative results revealed no significant differences among the PLS estimations, as well as CLC and ILC estimations. Thus, MLMV techniques have provided evidence regarding the reliable results of this study because no significant difference was found between the PLS and MLMV estimates using the CLC and ILC approaches. These statistical tests have proven that even after controlling the impact of CMV through CLC and ILC approaches, the PLS estimations have not changed much in any of the sample models. Thus, CMV is not a serious issue in this study. Past studies have widely used the most common techniques of assessing common method bias such as partialling out a marker variable (Tehseen et al., 2017; Williams et al., 2010; Richardson et al., 2009; Lindell and Whitney, 2001) and the correlation matrix procedure (Kashif et al., 2016; Podsakoff et al., 2003; Bagozzi et al., 1991). However, researchers have also strongly recommended using CLC and ILC techniques to control the impact of CMV, both on the construct level and item level (Tennant, 2014; Chin et al., 2013).
Comparison of path coefficients and t-values in CLC model and original PLS model
| Relationships | Full sample (N = 160) Estimation of t-values | Full sample (N = 160) Estimation of beta values | ||||
|---|---|---|---|---|---|---|
| CLC estimation | ILC estimation | Original PLS estimates | CLC estimation | ILC estimation | Original PLS estimates | |
| BS → BG | 25.994*** | 30.036*** | 31.399*** | 0.797 | 0.804 | 0.812 |
| BS → CP | 27.355*** | 32.192*** | 30.957*** | 0.839 | 0.844 | 0.849 |
| BS → FP | 26.523*** | 32.523*** | 30.086*** | 0.815 | 0.815 | 0.820 |
| BS → NFP | 18.318*** | 20.351*** | 21.313*** | 0.754 | 0.768 | 0.769 |
Note(s): Critical t-value 2.57*** (significance level = 1%)
Source(s): Own survey results
5. Discussion and implications
The purpose of this study is to explore the perspective of Malaysian and Bangladeshi retail SME owners on key business success factors. The four major components of business performance have been established previously by Ahmad (2007): (1) financial performance, (2) non-financial performance, (3) market development and (4) performance relative to competitors. Prior studies have also emphasized the role of all four dimensions in achieving business success (Ahmad, 2007). Nevertheless, in various countries, the perception of business owners toward the essential dimensions of business success can differ. Therefore, this research has presented empirical data on the views of Malaysian and Bangladeshi retail SME owners. The results suggest that entrepreneurs in these countries have different perspectives on business performance and place a higher value on particular aspects of it. For example, Malaysian retail SME owners place greater emphasis on their companies' growth and financial results in order to achieve success.
On the contrary, Bangladeshi retail SMEs put greater emphasis on their performance in comparison to competitors, as well as non-financial performance in achieving business success. Building on this, the respondents from the two countries have shown that only two of the four aspects of business performance are more important to them. This may be a contributing factor to their business's poor results, as all four components should be given appropriate weight in order to achieve business success. For instance, focusing solely on company development and financial results implies that business owners are unconcerned about the non-financial performance of their business such as customer and employee satisfaction. This could lead to customer dissatisfaction and employee turnover. Consequently, business competitiveness suffers, as owners ignore their company's success in comparison to competitors, implying that owners might not be following the industry's best practices. This could pose a serious threat to the sustainability of such companies compared to their competitors of the same industry. As a result, it is important for Malaysian retail SMEs to boost both their non-financial and financial performances. Similarly, this study has discovered that non-financial success and performance relative to rivals are more important to business owners in Bangladeshi retail SMEs than business growth and financial performance. They believe that putting less emphasis on business development causes their companies to stay small and locally run. As a result, such companies are unable to benefit from the economies of scale that come with expanding their operations.
They might not be able to take advantage of other market opportunities such as internationalization and product exports. Similarly, failing to invest in financial results does not guarantee company sustainability, market share growth, return on investment or cash flow, all of which are critical for successful operations. Companies that invest less in any of the four main dimensions of business success, namely financial performance, non-financial performance, business development and performance relative to competitors, will not be able to achieve long-term competitive advantage and superior performance in the industry. Therefore, in order to achieve successful business performance in any market, these four dimensions must be considered equally.
5.1 Implications of the study
The study's practical implications include giving empirical evidence that retail industry entrepreneurs or business owners in Malaysian and Bangladeshi SMEs view the dimensions of their business performance differently. For example, Malaysian retail SME owners consider business growth and financial results to be the most important aspects of their success. Retailers consider financial performance to be more critical than non-financial performance when it comes to the success of their business. Owners of Bangladeshi retail SMEs, on the other hand, see efficiency relative to rivals and non-financial performance as the most important dimensions for achieving business success. In the case of Bangladeshi SMEs, market development and financial results are seen as less significant in achieving business success. Therefore, these results will provide a strong foundation for SME owners (both new and old SMEs) to reconsider business planning in both the short- and long-terms, especially in terms of performance dimensions, as the Malaysian and Bangladeshi business owners from retail SMEs perceive the importance of their business success measures differently.
Malaysian business owners should give equal weight to the other two dimensions, which are performance relative to competitors and non-financial performance, while also considering which is less critical in achieving business success. Likewise, owners of Bangladeshi retail SMEs should prioritize market development and financial results, as they already recognize the value of non-financial performance and performance in comparison to rivals to achieve business success. By fairly emphasizing all four aspects of corporate performance, business owners would be more likely to achieve their goals. This study has provided useful insight to policymakers or decision-makers to consider SME owners' perspectives, which would in turn help them plan training programs for SME owners. Governments in both countries can initiate training programs to educate retail SME owners regarding the importance of all four indicators of business success, which are financial performance, non-financial performance, business growth and performance relative to competitors, because ignoring any one of these four measures could result in failure to sustain their business success in the long run. Therefore, it is utmost important for retail SME owners to be equipped with essential knowledge regarding these four measures of business success so that they can formulate and execute business strategies accordingly to ensure that they can achieve long-term success for their businesses.
The current study's second contribution is to the theory of business success. The dimensions of business success are considered to be significant in particular industries/SMEs in a specific country. In the sense of the same industry/SMEs in other countries, this may not be regarded as equally significant. This study's third methodological contribution is in the using of the most widely recommended CMV detection and control methods, resulting in trustworthy findings. Moreover, the CMV techniques used in this study can be used by future researchers to detect and control potential impacts of CMV or bias while collecting data from the same type of respondents. Richter et al. (2016) acknowledged that second-order models, CMV analysis, HMT criterion, multi-group analysis approaches as well as measurement invariance test are some of the major improvements and methodological advances that are contributing to the popularity of PLS-SEM.
5.2 Limitations and future recommendations
The current study's drawback is that it was conducted only in Malaysia and Bangladesh, limiting its applicability to other countries. Hence, this research recommends that a similar study focusing on the ethnicity of business owners be conducted in the future, as it would be beneficial to determine which of the main dimensions of business success are considered to be more critical to achieve business success by business owners of different ethnicities in both countries, or other multi-cultural developing countries. This is because ethnic entrepreneurship and entrepreneurs have long been regarded as critical to an economy's growth (Dana, 2007). Apart from that, additional researches could compare business success measures among family firms and non-family firms, as this study made a contribution from the perception of various contexts. This is due to past literatures' emphasis on the contribution of family businesses to the economy of the country (Ratten et al., 2017; Dana and Ramadani, 2015; Ribeiro et al., 2012; Heck et al., 2008). Therefore, it is anticipated that family business owners will view business success in a different light compared to non-family business owners.

