


The purpose of this study is to empirically examine the impact of financial development on poverty reduction in Egypt. The paper also investigates whether financial development affects poverty via gross domestic product (GDP) growth.
This study uses the autoregressive distributed lag approach to estimate two specifications. The first is dependent on poverty by the ratio domestic credit to the private sector (percentage of GDP) and the second is dependent on the poverty by the ratio liquid liabilities to GDP or M3/GDP. The data are annual and cover the period from 1980 to 2015.
In long run, the study finds that relationship between economic growth and poverty is bidirectional. Financial development and poverty (household final consumption expenditure per capita) are complementary as bidirectional (in Granger sense). In short run, the study finds the bidirectional causality between financial development (real domestic credit to private sector per capita) and poverty reduction.
The findings suggest that governments should remove policies that impede the ability of banks to offer loan products or undermine the commercial incentive structure for banks or borrowers. It is crucial to enhance the role of specialized state-owned banks in financial intermediation.
Several attempts have been made to investigate the relationship between financial development and other macroeconomic variables, but few studies have examined the impact of financial development on poverty reduction. Furthermore, the majority of the previous studies are based on Asia and Latin America – affording Egypt very little or no coverage at all.
1. Introduction
There is a general consensus among scholars that a financial system that effectively provides financial services, such as saving mobilization, better capital allocation and an effective risk management, is crucial for the process of economic growth (King and Levine, 1993; Beck et al., 2000; Beck and Levine, 2004). Recent studies have also focused on exploring whether a well-functioning financial system helps improve the standard of living for the poor (Akhter et al., 2010; Moreno, 2011; Jeanneney and Kpodar, 2011).
Although the relationship between financial development and growth is well established, the same cannot be said for the casual linkage between financial development and poverty reduction. In the past two decades, many countries, especially the developing ones, implemented an extensive program of economic reforms and financial sector reforms, which take the form of financial sector liberalization. The proponents of financial liberalization argued that the determination of the rate of interest by market forces will allow for optimization in allocating funds for investment and hence will enhance economic growth.
Market reforms were implemented by Egypt in early 1990 and, while they were developing economic growth, they have not been effective in enhancing the living standards in Egypt which are low by international standards and have even declined continuously since 1990 for the average Egyptian. Since 1991, Egypt has been implementing a policy of financial liberalization which World Bank (WB) and International Monetary Fund (IMF) prescribed. The process of the financial liberalization that Egyptian economy adopted can be divided into two periods. The first phase of financial reform (1991-2003) contained what are known as the orthodox IMF and WB policy prescriptions consisting of liberalizing interest rates and channeling financial resources to the hand of private sector. The second phase of financial reform (2003-2011) involved restructuring the financial system, reinforcing the process of monitoring and supervising over all the financial sector and boosting competition through the privatization programme (Elsayed, 2013).
Poverty, unemployment and an unequal distribution of wealth in Egypt were among the principle reasons that led to the revolution on January 25, 2011. Egypt’s economic situation is not likely to improve shortly, as the economic status is predicted to deteriorate further against an economic situation fraught with problems.
The existing literature offers a set of explanations for the role of financial development in driving economic growth. Theory suggests that financial development forms an important mechanism for achieving long-lasting growth (Honohan, 2004; Levine, 2004; Beck and Levine, 2004). The literature confirms that an effective financial system can boost specialization, reduce transaction and information costs, mobilize savings, support productive investment and ameliorate risk and so on. Moreover, most previous studies that have examined such relationship have focused on Latin American and Asian countries while African countries received little attention.
This paper aims to analyze Egyptian history over a period of 36 years (1980-2015) to find out if financial development has had any bearing on poverty reduction and investigate the dynamic linkage between financial development and poverty reduction in Egypt by incorporating growth of GDP as an intermittent variable, thereby creating a simple trivariate setting.
The paper is organized as follows. Section 2 outlines literature review. Section 3 represents data sources and the underlying methodology. The results and discussions are presented in the Section 4. Finally, Section 5 draws the conclusion and implications in this study.
2. Trends of financial development and poverty in Egypt
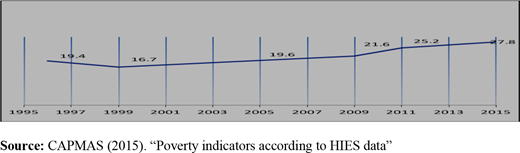
In 1995-1996, poverty rate stood at 19.4 per cent, declining significantly to 16.7 per cent in 1999-2000. The gains achieved in reducing poverty from 1995-2000 were offset by the increase in poverty from 2000-2004 back to 19.6 per cent, and to 21.6 per cent in 2008-2009, then to 25.2 per cent in 2010-2011. Finally, in 2015, overall poverty in Egypt stood at 27.8 per cent, representing approximately 25.5 million, who could not obtain their basic food and non-food needs (Figure 1).
Poverty reduction in the 1990s resulted particularly from employment creation in the non-tradable service sector. Revenues from oil, which constituted over 40 per cent of merchandise exports, catalyzed employment creation in this sector and also resulted in employment opportunities in the Persian Gulf countries for unskilled Egyptian workers. Labor migration, in turn, created remittances that financed increased demand in the economy. It is worth mentioning that remittances averaged more than $3bn in the 1990s, representing more than one quarter of Egypt’s total exports of goods and services. (World Development Indicator [WDI]). Foreign aid as well (which averaged nearly 20 per cent of central government expenditures in the 1990s) supported finance Egypt’s deficit on current account. Finally, receipts from tourism, another sector related to unsteady global changes, represented more than 20 per cent of total exports in the 1990s. The rapid growth of the Egyptian economy undoubtedly stems from these sources of income (WDI).
Egypt’s reliance on these sources of income leaves the country largely vulnerable to unforeseeable and unsteady global changes. In addition, their yields have been used to finance consumption rather than investments in productive assets. Because remittances (which are depended on oil receipts) are more volatile than other sources of employment and income, Egypt’s dependence on remittances for employment creation and income generation were disturbing. Therefore, the sustainability of growth, job creation and poverty reduction in Egypt are questionable. Sustained poverty reduction depends largely on structural reforms aimed at reducing the dependence of the economy on unstable and probably declining sources of foreign exchange, and local policy should aim at channeling whatever income comes from these sources toward investments in productive assets and should not depend on foreign labor markets to create jobs (Salem and Gleason, 2005). Over the past decade, the private sector plays a dominant role in Egypt. The first years of economic reform (1991-1993) were characterized by economic stagnation. Subsequently, a healthy growth rate is resumed. Critics of the economic reform process argued that such reforms would have a negative impact on the poor. This was not the case in Egypt: the incidence of poverty between 1995-1996 and 1999-2000 decreased from 19 to 17 per cent (Haddad and Ahmed, 2002).
Developing the depth of financial markets holds the promise of enhancing economic growth by supplying access to capital to financially restricted economic factors. Given that the expansion of access favors the poor, financial development may improve income distribution by increasing the efficiency of capital allocation. Moreover, financial frictions, such as information and transactions costs, may disproportionately restrain the poor who lack credit history. In principle, by relaxing the credit restrictions of this sort, financial deepening can help the poor and lessen income inequality (Nasr, 2010).
Compared to other developing countries, there are various financial indicators which have put the Egyptian financial sector at a moderate level in financial intermediation. Although mobilization of savings in Egypt is high by international standards, the banking sector is not intermediating efficiently. Most savings are channeled through the financial system as bank deposits, where the ratio of the deposit-to-GDP (per cent) is much higher than the world average and virtually higher than many developed countries. However, little of it is channeled to the real, productive private sector and is fundamentally used to finance government deficits or as loans extended to state-owned enterprises (Nasr, 2010). Over the period of the study, Egypt has experienced financial sector problems necessitating reforms of their systems. The problems are predominantly because of domestic problems, such as weak banking supervision and inadequate capital. For banking reform, it may be required to modernize the financial services industry as in the case of transition countries shifting from a public-sector-led to a market economy. External factors, such as deteriorating terms of trade, can cause currency crises and worsen banking problems.
The impact of the structural reforms, essentially those affecting the investment environment, started by the government appointed in July 2004 is being reflected in the significant amelioration in the investors’ perception of the business climate. The Financial Sector Reform Program was the main pillar of the government’s comprehensive reform program endorsed in September 2004. The program aims at enhancing the soundness of the financial sector and boosting an enabling environment for the growth of an effective private-led financial system that serves Egypt’s development and growth goals. Considerable improvement has been made in the enforcement of these financial sector reforms. Achievements include consolidating the banking sector, divesting the state-owned banks’ shares in the joint-venture banks, privatizing one state-owned bank, pursuing the restructuring of the remaining three state-owned commercial banks and establishing the supervisory capacity at the central bank.
For nonbank financial institutions, various reforms have been promised to strengthen the capital market, restructure the insurance sector, improve a well-functioning mortgage market and stimulate financial leasing and factoring. However, such progress has not yet been reflected in improved performance and enhanced financial intermediation.
3. Literature review
Financial development is investigated by many economists to be of main importance for output growth. Particularly, government restrictions on the banking system (such as interest rate ceiling, high reserve requirements and directed credit programs) prevent financial development and reduce output growth. (McKinnon, 1973; Shaw, 1973). Furthermore, the endogenous growth literature emphasizes the influence of financial markets on economic growth (Bencivenga et al., 1995; Greenwood and Smith, 1997; Obstfeld, 1994).
There is no common assent among economists that financial development is beneficial for growth. In an endogenous growth model, Pagano (1993) uses the AK model (AK model production function is a special case of a Cobb-Douglas function with constant returns to scale) to conclude that the settled state growth rate depends positively on the percentage of savings turned into investment, so one channel through which financial deepening has an influence on growth is diverting savings to investment. Berthelemy and Varoudakis (1996) find that the growth rate depends positively on the number of banks or the degree of competitiveness of the financial system. Their results display that educational development is a prerequisite of growth, and financial lagging is a barrier when the educational system is not fruitful. Greenwood and Jovanovic (1990) examine the relation between growth and income distribution, as well as between financial structure and economic development.
Levine et al. (2000) conduct their analysis using a sample of data for 74 developed and less developed countries over the period 1960-1995. They use dynamic estimators like generalized method of moments estimation (GMM) and cross-sectional instrumental variable estimators where legal rights of creditors, the soundness of contract enforcement and the level of corporate accounting standards are used as instruments to elicit the exogenous component of financial development. Both estimation techniques correct for biases associated with previous studies of the financial development-growth relation. They found that the strong positive relationship between financial development and output growth can be partially explained by the impact of the exogenous components like finance development on economic growth. Beck et al. (2000) examined the relationship between financial development and economic growth and also the relationship between financial development and the sources of growth in terms of private saving rates, physical capital accumulation and total factor productivity. Instrumental variables (IV) and GMM estimators were used to correct for possible simultaneity biases. They conclude that higher levels of financial development lead to higher rates of economic growth and total factor productivity. For the remaining variables, they could not notify any relationship with financial development.
On the empirical front, very few studies have examined the relationship between financial development and poverty reduction. Some of the studies have attempted to examine the relationship between financial development and poverty reduction (Odhiambo, 2009; Jalilian and Kirkpatrick, 2002, 2005; Jeanneney and Kpodar, 2008a, 2008b; Jeanneney and Kpodar, 2005, Quartey, 2005; Honohan, 2004; Banerjee and Newman, 1993; Clarke et al., 2003, 2006; Stiglitz, 2002; Arestis and Caner, 2005; Dollar and Kraay, 2002; Beck et al., 2007; Honohan and Beck, 2007).
Generally, in theoretical literature, it is argued that financial development can help to reduce income inequality and poverty directly by providing credit and financial services to the poor that helps to increase their income through investing productive activities as well as through interest earned from savings, and indirectly by its growth stimulating effect (Schumpeter, 1934, McKinnon, 1973). Financial development can also indirectly reduce poverty and income inequality through enhancing economic growth and the gains from growth are channeled to the poor. One of the way in which financial development enhances economic growth is through the mobilization of funds from inefficient to efficient use.
The evidence pointed that the degree of financial intermediation has a strong and positive impact on the income of the poor (Jalilian and Kirkpatrick, 2002; Beck et al., 2007; Boukhatem and Bochra, 2012).
Financial development can improve the opportunities for the poor to access formal finance by addressing the causes of financial market failures such as information asymmetry (Stiglitz, 1998).
Also, financial development can enable the poor to start micro enterprises, which generates more employment and higher income and thereby reduces poverty. Other findings suggested that financial development may trickle down to the poor through its positive effect on economic growth because of the positive effect of economic growth on poverty reduction.
Ravallion and Datt (2002), Fan et al. (2000) and Uddin et al. (2014) found that a long-run relationship between financial development, economic growth and poverty reduction exists in Bangladesh, and financial development helps to reduce poverty, but its effect is not linear.
Shahbaz and Rehman (2013) find that financial development causes poverty reduction in Pakistan.
Shahbaz and Kirkpatrick (2001) tested the relationship between financial development and poverty through the growth channel. They conclude that one unit change in financial development leads to a 0.4 per cent change in the growth rate of the incomes of the poor, assuming that there are no direct effects. Moreover, they found that financial development contributes to poverty reduction through a growth-enhancing effect up to a certain threshold level of economic development.
Jalilian and Kirkpatrick (2005) and Uddin et al. (2014) found that financial development contributes to poverty reduction and the effect varies with the level of economic development. It seems that there was a certain threshold level of financial development that an economy needs to attain before it can get the full indirect benefits and reduce the risks of capital account liberalization.
Milanovi (2005) indicated that there were significant increases in domestic and global inequality during the periods of global financial liberalization policies. In this regard, high interest rates, caused by financial liberalization policies, harm small firms and leave large firms in very good condition.
Ang and Mckibbin (2007) empirically examined the relationship between financial liberalization and financial development using the time series data of Malaysia. Empirical findings suggested that real interest rate and financial repression have negative impact on financial development, by removing the repressive policies financial liberalization promotes country’s financial sector.
Pradhan (2010) considers the relationship between the financial development, the economic growth and the poverty reduction in India through time series data covering the period 1951-2008. It emphasizes the existence of long-term equilibrium between financial development, economic growth and poverty reduction relationship. It also concludes the existence of unidirectional causality of poverty reduction to economic growth, economic growth to financial development, economic growth to reduce poverty and financial development to poverty reduction. It concludes that financial development and economic growth have a substantial contribution to reducing poverty in the economy.
Recently, in the case of Bangladesh, Uddin et al. (2012) examined the causal relations between financial development and poverty reduction using data over the period of 1976-2010 by applying the ARDL bounds testing approach to cointegration and the VECM Granger causality for long run and causality relationships respectively. Their results reported cointegration between the variables and feedback effect between financial development and poverty reduction.
Singh and Huang (2015) argue that if financial markets were perfect, the availability of finance would allow individuals to fund education, training or business opportunities. In this framework, financial development would contribute to equalize opportunities by reducing the importance of initial wealth and then would favor the poor. They confirm that the benefits of financial development are not automatic, and policies aimed at macroeconomic stability and institutional reforms needed to accompany financial development.
4. Estimation techniques and empirical analysis
This paper studies the link between the financial development and the poverty reduction in Egypt over the period 1980-2015. The data have been obtained from the WDIs by the Word Bank.
4.1 Definitions of variables
4.1.1 Poverty reduction (povred).
The current study uses household final consumption expenditure per capita growth (annual per cent). This is because the consumption expenditure of poor people is reliably documented and quite stable when compared with their income (Odhiambo, 2010; Quartey, 2005; Datt and Ravallion, 1992). The proxy is consistent with the definition of poverty by the WB as “the inability to attain a minimal standard of living” gauged relative to their basic consumption needs (World Bank 1990 besides, Quartey, 2005; Odhiambo, 2010; Ho and Odhiambo, 2011; Uddin et al., 2014; Sehrawat and Giri, 2016a, 2016b).
4.1.2 Financial development (M3 and DC).
Financial development is a multifaceted concept which captures financial depth, access, efficiency and stability (World Bank, 2014). What therefore measures financial development has been a matter of debate in the literature. This study chooses two proxies that frequently appear in the empirical literature to measure financial development. These are the domestic private sector credit by banks to GDP (DC) and M3 to GDP.
The DC measures the relative contribution of the financial system to the economy. Several studies, including Levine et al. (2000), Boyd et al. (2001), Honohan (2004), Levine (2004), Jalilian and Kirkpatrick (2005), Beck et al. (2007), Ho and Odhiambo (2011), Hamori and Hashiguchi (2012) and Sehrawat and Giri (2016a, 2016b), have also used this variable.
4.2 Estimation techniques
Using the autoregressive distrusted lag (ARDL) modeling approach (Pesaran et al., 2001) as an alternative to test cointegration Engel and Granger (1987) and Johansen (1988, 1991). This technique allows the use of variables which differ from order integration I (0) and I (1). It is also better suited to small samples. This paper uses the ARDL approach to estimate two specifications. The first is dependent on poverty by the ratio domestic credit to the private sector (per cent of GDP) and the second is dependent on the poverty by the ratio liquid liabilities to GDP or M3/GDP.
The data are annual and cover the period 1980-2015. The period covered is solely based on data availability. The data are sourced from the WDI database (2016) compiled by the WB.
This section outlines the econometric tests used in the paper and the empirical specifications for the causal estimation of the relationship between poverty reduction and financial development in Egypt.
Before proceeding to the ARDL approach, the study tested the stationary of each series. When the analysis is time series-based, it is essential to test the stationarity of the variables so as to identify the order of integration by the augmented Dickey–Fuller (ADF) and Phillips–Perron unit root tests. The ADF test is widely used in this regard (Dickey and Fuller, 1979, 1981). Phillips and Perron (1988) proposed a modification of the DF test and have developed a comprehensive theory of unit roots.
Choosing appropriate lags is very important in unit root testing. This study decided the appropriate lags for both tests based on akaike information criterion (AIC). These tests have been explained in many studies. The study uses the ARDL bounds testing approach to cointegration developed by Pesaran et al. (2001) to explore the existence of a long-run relationship between economic growth, financial development and capital stock.
The empirical formulation of the ARDL bounds testing approach to cointegration is given below:
Where Δ is the first difference operator, and μt is an error term assumed to be independently and identically distributed. Pesaran et al. (2001) suggest F-test for joint significance of the coefficients of the lagged level of variables. For example, the null hypothesis of no long-run relationship between the variables is (H0: α YL = α F = α KL = 0) against the alternative hypothesis of cointegration (H1: α YL#α F #α KL #0). Pesaran et al. (2001) provide lower and upper bound critical values for the F-test. The lower bound critical values assume all variables are I(0), while the upper bound critical values assume all of the variables are I(1). If the calculated F-statistics exceed the upper bound, the null hypothesis of no cointegration among the variables can be rejected. If the calculated F-statistics fall below the lower bound, the null hypothesis of no long-run relation cannot be rejected. The next step is the estimation of the long-run coefficients that are involved in determining the ARDL model with optimal lags. The selection criteria for the optimal lags such as the Schwarz Bayesian Criterion (SBC) and the AIC are mostly used to determine the order of the ARDL model.
Once the variables are cointegrated for the long-run relation, the long-run and short-run causality can be investigated. The long-run and short-run direction of causality between financial development, economic growth and capital stock was investigated by the VECM (vector error correction method) Granger causality framework.
4.3 Empirical analysis
Table I presents the results of both ADF and PP tests, both of which provide us with a T1 consistent picture. All series have unit roots regardless of whether the tests are I(1). These results confirm that study could apply the ARDL because our series are not I(2). Before conducting the ARDL bound testing approach, this study selects the optimal lag length based on SBC because it performs better than others (Narayan, 2005; Pesaran et al., 2001).
Unit root analysis
| Variables | Level | |||
|---|---|---|---|---|
| ADF | PP | |||
| Intercept | With trend | Intercept | With trend | |
| ln povredt | −2.791 [0.101] | −0.686 [0.858] | −1.174 [0.636] | −1.512 [0.814] |
| ln Yt | 2.899 [1.000] | −1.701 [0.755] | 6.215 [1.000] | −2.333 [0.414] |
| ln DCt | −2.631 [0.124] | −0.724 [0.998] | −1.251 [0.644] | −1.319 [0.881] |
| ln Mt | 0.947 [0.985] | −2.216 [0.466] | 1.188 [0.987] | −2.418 [0.379] |
| First difference | ||||
| ln povredt | −5.554* [0.000] | −6.161* [0.000] | −4.818* [0.000] | −6.161* [0.000] |
| ln Yt | −3.816** [0.007] | −5.319** [0.001] | −3.548* [0.008] | −7.777* [0.000] |
| ln DCt | −5.313* [0.000] | −6.917* [0.000] | −4.982* [0.000] | −6.921* [0.000] |
| ln Mt | −8.018* [0.000] | −7.966* [0.000] | −7.454* [0.000] | −7.555* [0.000] |
Note:
and
is significance level at 1 and 5% respectively
The result in Table I indicates that four is the optimal lag order. Results in Table II indicate that the calculated F-statistic (6.194) exceeds the upper critical bound at the 1 per cent significance level when household final consumption expenditure (Ln) povredt is the predicted variable. This suggests that there is cointegration between household final consumption expenditure, real GDP per capita real and financial development. The coefficients of long-run and short-run results are reported in Table III. In the long-run equation, our results indicate positive and significant impact of financial development on economic growth at 1 per cent level.
Long-run and short-run results
| Dependent variable = Ln povredt | |||||
|---|---|---|---|---|---|
| Long-run results | Short-run results | ||||
| Variable | Coefficient | T-statistic | Variable | Coefficient | T-statistic |
| Constant | 1.699* | 56.741 | |||
| ln Yt | 0.503* | 6.014 | ln Yt | ||
| ln Yt-1 | |||||
| ln DCt | 0.225* | 6.888 | ln DCt | 0.471** | 2.848 |
| ln DCt-1 | 0.092*** | 1.664 | |||
| ln Mt | 0.328* | 4.228 | ln Mt | 0.044*** | 1.979 |
| ln Mt-1 | −0.081* | −6.102 | |||
| ECMt-1 | −0.452* | −5.312 | |||
Notes:
;
; and
denote the significant at 1, 5 and 10 per cent level respectively
Results in Table III indicate that in short run, empirical evidence shows that financial development has positive and statistically significant impact on economic growth. However, one-year lag of financial development has negative and statistically significant impact on economic growth (GDP per capita growth) in the current period. The lagged value of the error correction term (ECMt-1) is negative and significant at 1 per cent level of significance. This shows the speed of adjustment from the short-run toward the long-run. The study finds that the deviations in the short run toward the long run are corrected by 45 per cent each year. This low speed of adjustment in economic growth might be because of the low competitiveness of financial sector in Egypt.
The existence of a cointegration relationship between the variables allows us to apply the VECM Granger causality approach. The information about the direction of causality between the variables provides an important picture for policymakers to formulate policy. Therefore, the VECM Granger causality approach which provides information about the causality is crucial. The results of Granger causality test are reported in Table IV.
The VECM Granger causality analysis
| Dependent variable | Direction of causality | ||||||
|---|---|---|---|---|---|---|---|
| Short run | Long run | Joint long-and-short run causality | |||||
| Δ ln Pt | Δ ln yt-1 | Δ ln Ft-1 | ECT t-1 | Δ ln Pt-1, ECT t-1 | Δ ln yt-1, ECT t-1 | Δ ln Ft-1, ECT t-1 | |
| Δ ln povredt | … | 17.3081* [0.0000] | 0.5213 [0.8644] | −0.1133*** [−3.2055] | … | 18.1121* [0.0000] | 8.0021** [0.0000] |
| Δ ln yt | 20.3284* [0.0000] | … | 11.9954 [0.0000] | −0.20 121* [−4.5287] | 15.5841* [0.0000] | … | 10.5487* [0.0000] |
| Δ ln DCt | 0.7846 [0.6208] | 13.5478* [0.0000] | … | … | … | … | … |
| Dependent Variable | Δ ln povredt-1 | Δ ln y t-1 | Δ ln Mt-1 | ECT t-1 | Δ ln P t-1, ECT t-1 | Δ ln y t-1, ECT t-1 | Δ ln M t-1, ECT t-1 |
| Δ ln povredt | … | 14.9983** [0.0001] | 5.0282* [0.0063] | −0.0828** [−5.7001] | … | 17.5042* [0.0000] | 8.7705* [0.0000] |
| Δ ln yt | 17.1487* [0.0001] | … | 0.5212* [0.8501] | −0.2187*** [−2.6709] | 12.3654** [0.0000] | … | 6.9154* [0.0010] |
| Δ ln Mt | 9.4587* [0.0003] | 3.0052 [0.1182] | … | −0.0088*** [−1.6794] | 8.2140** [0.0003] | 4.7921** [0.0111] | … |
Notes:
;
; and
show significance at 1, 5 and 10% levels, respectively
Table IV results indicate that the long-run causality results indicate that there is the bidirectional causality between financial development and economic growth, financial development and capital stock and economic growth and capital stock. It supports the “demand-following” hypothesis and the “supply leading” hypothesis in Lao context. It indicates that financial sector is important to promote economic growth. The financial reforms which part of economic reform has been implemented in 1990s. This reform promoted sound and efficient financial sector in Egypt. It has facilitated the flow of funds, improving an efficient allocation of resources and quality of investment. In addition, economic growth generates more demand for financial services and resources which lead to promote financial development in Egypt. This empirical result is consistent with Ang and Mckibbin (2007) for Malaysia; Majid (2007) and Majid and Mahrizal (2007) for Thailand; Gries et al. (2009) for Nigeria; Senegal et al. (2008) for Egypt; Wolde-Rufael (2009) for Kenya; Jenkins and Katircioglu (2010) for Cyprus; Gries et al. (2011) for Costa Rica, Chile and Suriname; and Shahbaz (2103) for Pakistan.
Table IV reveals the results of causality once the study used household final consumption expenditure per capita as measure of poverty reduction . In long run, the study finds that relationship between economic growth and poverty reduction is bidirectional (in Granger sense). Financial development and household final consumption expenditure per capita (poverty reduction) are complementary as bidirectional Granger causality is confirmed between both variables. The unidirectional running from financial development to economic growth supporting supply-side hypothesis and demand-side hypothesis is also true as economic growth Granger causes financial development. The results vary when the study used real liquid liabilities (M3) per capita measure of financial development. The feedback effect is found between financial development and economic growth. Economic growth and financial development Granger cause poverty reduction.
In short run, the study finds the bidirectional causality between financial development (measured by real domestic credit to private sector per capita) and poverty reduction (indicated by household final consumption expenditure per capita). The relationship between economic growth and poverty reduction is bidirectional, and feedback hypothesis is validated between financial development and economic growth. Furthermore, poverty reduction is Granger cause of economic growth and financial development (proxies by real liquid liabilities per capita). There is complementary relationship found between economic growth and financial development, i.e. bidirectional.
Diagnostic tests were also applied to test the adequacy of the model specifications. These diagnostic tests suggest that long-run and short-run estimates are free from serial correlation, misspecification of the short-run model, non-normality of the error term and heteroscedasticity.
5. Conclusions
The estimated results confirmed the existence of long-run equilibrium relationship between financial development, economic growth and poverty reduction in Egypt. The results confirm that financial sector development plays a vital role in facilitating economic growth in Egypt.
The combination of financial restructuring and institutional reform will make Egypt’s financial sector more developed and efficient, leading it to provide better-quality financial products and services, exhibiting a lower cost of financial intermediation and being more competitive. Government intervention in the credit-granting and pricing process undermines banks’ incentives to make good loans and borrowers’ incentives to pay back and introduces other forms of market distortions. Regulations and policies to increase small firms’ access to finance, such as interest-rate ceilings, restrictions on lending, priority lending and credit subsidies and other government interference can contribute to a distorted enabling environment for financial intermediation, hindering access.
Governments should remove policies that either unnecessarily impede the ability of banks to design, price and offer loan products or undermine the commercial incentive structure for banks or borrowers.
It is crucial to enhance the role of specialized state-owned banks in financial intermediation. Although analysis of the use of financial services by households suggests that over the longer term, the most dramatic increases in access to financial services are likely to come from demand-side factors (such as those associated with improvements in human-capital development, education and income), in the near term, actions can be taken on the supply side to improve access for households. Specifically, better use could be made of the existing branch networks of state-owned specialized banks to foster access (Nasr, 2010).
It should be said that financial sector development in Egypt should support poverty reduction by broadening the access to financial resources of the poor. Financial development enables poor households to accumulate assets and therefore enables them to increase their future level of income. This suggests that financial development in Egypt, like other countries, would lessen poverty beyond its effect on growth or what is referred to in the literature as trickledown theory.

